

Cardiology / Электрокардиография Ослопова 2005 года
.pdf№5.
№6.
№7.
№8.
80 |
81 |
UNIT 3
Theme 1. MYOCARDIAL ISCHEMIA AND INFARCTION: THE
CLASSIC ECG-FINDINGS, EVOLUTION OF ECG-CHANGES,
TOPICAL DIAGNOSIS.
Goal:
to get a notion about classic ECG findings of ischemia and infarction; to master skills.
Knowledge objectives:
to know the notion of ―ischemia‖, ―injury‖, ―infarction (necrosis)‖; ischemic, injured and necrotic ECG-changes (characteristic of ischemia, myocardial injury and necrosis); evolution of ECG-changes; distribution of ECG changes depending on the site of infarction.
Skill objectives:
to develop practical skills in myocardial infarction ECG-diagnosis (to diagnose myocardial infarction electrocardiographically).
EDUCATIONAL MATERIAL
The ECG is a cornerstone in the diagnosis of acute and chronic ischemic heart disease. The findings depend on several key factors: the nature of the process [reversible (i.e., ischemia) versus irreversible (i.e., infarction)], the duration (acute versus chronic), extent (transmural versus subendocardial), and localization (anterior versus inferoposterior), as well as the presence of other underlying abnormalities (ventricular hypertrophy, conduction defects).
Myocardial ischemia and infarction
Myocardial ischemia is the reduction of blood flow to a region of the heart. Though often causing pain (―angina‖), shortness of breath, sweating and/or nausea, ischemia may be clinically silent up to 75% of the time. Ischemia causes EGG changes, however, even in the absence of symptoms. This forms the basis of EGG applications such as exercise testing and 24 hour ambulatory EGG (Holter) monitoring to detect

82
myocardial ischemia. Persistence of ischemia for a critical period of time results in myocardial infarction (tissue death).
The classic EGG findings of ischemia and infarction are shown in the Fig. 66.
Fig. 66. EGG findings of ischemia and myocardial infarction.
Ischemia exerts complex time-dependent effects on the electrical properties of myocardial cells. Severe, acute ischemia lowers the resting membrane potential and shortens the duration of the action potential. Such changes cause a voltage gradient between normal and ischemic zones. As a consequence, the current flows between these regions. These so-called currents of injury are represented on the surface by deviation of the ST segment. When the acute ischemia is transmural, the ST vector is usually shifted in the direction of the outer (epicardial) layers, producing ST elevations and sometimes, in the earliest stages of ischemia, tall, positive, the so-called hyperacute T waves over the
83
ischemic zone (Fig. 67). With ischemia confined primarily to the subendocardium, the ST vector typically shifts toward the subendocardium and ventricular cavity, so that overlying (e.g., anterior precordial) leads show ST-segment depression (with ST elevation in lead aVR). Multiple factors affect the amplitude of acute ischemic ST deviations. Profound ST elevation or depression in multiple leads is usually indicative of very severe ischemia. Complete resolution of ST elevation promptly following thrombolytic therapy is a relatively specific, though not sensitive, marker of successful reperfusion.
Fig. 67. ST segment elevation.
With infarction, depolarization (QRS) changes often accompany repolarization (ST-T) abnormalities. Necrosis of sufficient myocardial tissue may lead to decreased R-wave amplitude or frank abnormal Q waves in the anterior or inferior leads. Previously, abnormal Q waves were considered to be markers of transmural myocardial infarction, while subendocardial infarcts were thought not to produce Q waves. However, careful pathology correlative studies have indicated that transmural infarcts may occur without Q waves and that subendocardial (nontransmural) infarcts may sometimes be associated with Q waves.
Therefore, infarcts are more appropriately classified as ―Q-wave‖ or ―non-Q-wave‖.
Q waves which are ―abnormal‖ are suggestive of irreversible myocardial cell death. They represent a vector of electrical forces which are directed away (thus the negative deflection) from an area of infarcted myocardium. A negative deflection is only a Q wave when there is no preceding positive deflection (no matter how small).
Q-waves will usually appear within several hours of the onset of an infarction. Some small Q-waves are normal on some leads in some people. Therefore, not all Q waves are abnormal.
84
Q-WAVE ABNORMALITY
The following are guidelines for determining whether a Q wave is abnormal (Fig. 68).
1.Any Q-wave in precordial leads V2 , V3 or V4 is abnormal (unless there is axis rotation in precordial leads).
2.Q-waves can be wide and deep in normal hearts in leads III, aVR
or V1 (because of the rightward orientation of these leads) and therefore should be ignored if no other Q waves are found.
In all other leads a Q wave is abnormal if it is:
1)0.03 sec in duration,
2)at least one quarter of the height of the R-wave in the same QRS complex (except for lead aVL where it should be at least one half).
A B
Fig. 68. Q-wave
(A - Significant Q waves. B - Q wave in a QRS complex without an R wave is called ―QS complex‖).
Loss of depolarization forces due to posterior or lateral infarction may cause reciprocal increases in R-wave amplitude in leads V1 and V2
without diagnostic Q waves in any of the conventional leads. Atrial infarction may be associated with PR-segment deviations due to an atrial current of injury, changes in P-wave morphology, or atrial arrhythmias. In the weeks and months following infarction, these ECG changes may persist or begin to resolve. Complete normalization of the ECG following Q-wave infarction is uncommon but may occur, particularly with smaller infarcts. In contrast, ST-segment elevations that persist for several weeks or more after a Q-wave infarct usually correlate with severe underlying wall motion disorder (akinetic or dyskinetic zone), although not necessarily a frank ventricular aneurysm.
85
There are two major changes seen in T waves in the setting of myocardial ischemia and infarction: peaked or ―hyperacute‖ T waves (Fig. 69) and T wave inversion (Fig. 70). These are important changes that may be part of a Q-wave or non Q-wave infarction.
The T wave in a normal electrocardiogram shares the same polarity as the preceeding QRS complex in any given lead. In myocardial ischemia, repolarization of the affected area is delayed and therefore remains electrically negative (i.e., depolarized) for a longer period of time.
If the ischemia only affects the subendocardium, the delay of depolarization, the negative charge maintained by the ischemic area unopposed by the rest of the myocardial wall. This results in peaked or
―hyperacute T waves‖.
Fig. 69. Peaked T wave.
When ischemia affects the epicardium, repolarization will occur in an endocaridal to epicardial direction (i.e., reversed). Therefore, the vector of ventricular repolarization in the affected area will reverse. For this reason, an electrocardiogaphic electrode placed over a zone of transmural ischemia will record an inverted T wave.
Fig. 70. Inverted T wave.

86
Thus, the three major changes take place in leads recorded near from the area of infarcted ventricular wall (Fig. 71).
They are:
1.An initial negative deflection which is both deeper and wider than the physiological Q of LV surface leads – termed as a pathological Q wave. This is due to the transmission of negative intracavity potentials out through the ―electrical window‖ provided by the dead area. The positive ventricular deflection R is correspondingly reduced and may be absent.
2.S-T elevation, the reflection of a ―current of injury‖ arising from anoxic damage to the epicardium around the infarct.
3.T wave inversion, due to the reversal of the normal direction in which electrical recovery takes place. These changes take a few hours to develop, and may be undetectable in the ECG taken immediately after the onset of symptoms. S-T elevation is the first sign to appear, followed by developing Q waves. S-T elevation subsides within a day or two; the characteristically sharp and symmetrical T wave inversion is seen. The latter may take months or even years to disappear, while pathological Q waves often persist indefinitely.
Fig. 71. Evolution of ECG changes. 1 – ST elevation marked, Q waves beginning.
2 – ST elevation subsiding, Q waves deepening, T becoming inverted in III.
3 – ST elevation subsided, deep Q waves, T symmetrically and sharply inverted in III and becoming inverted in II.
87
REMEMBER:
Many conditions cause ST-T wave changes that can mimic ischemia and infarction (see below Abnormalities of repolarization). Most of these conditions affect the EGG diffusely. THE HALLMARK OF THE EGG CHANGES OF ISCHEMIA AND INFARCTION IS THAT THEY ARE LOCALIZED to a specific region of the heart, and reciprocal changes may be seen!
Distribution
Distribution of the above mentioned ECG-changes varies with the site of infarction. There are four common patterns: anterior, inferior, posterior, and lateral.
Anterior Myocardial Infarctions
Anterior myocardial infarction is normally caused by an occlusion of the anterior decending branch of the left coronary artery. Abnormal Q waves as well as other important changes such as ST segment elevation can be seen in precordial leads V1 to V4. An ominous feature of anterior infarcts is ST segment depression in inferior leads II, III and aVF, occuring in 37% to 62% of anterior infarcts. If the lateral wall is also involved, changes may be seen in lateral leads I, aVL, V5 and V6.
To be more precise, anterior myocardial infarction can be localized even more specifically to include anteroseptal, anterolateral, true anterior and extensive anterior infarctions.
Anteroseptal Infarction
This is an infarct of the anterior part of the intraventricular septum. QS deflections and/or ST elevation can be seen in V1-V3
Anterolateral Infarction
Caused by an occlusion of the left main coronary artery. Abnormal Q waves and/or ST elevation is seen in V5, V6 , I, aVL and sometimes V4.
True Anterior Infarction
This is simply an anterior infarct not involving either the septum or the lateral wall. Abnormal Q waves and/or ST elevation is seen in any of leads V2, V3 or V4.
88
Extensive Anterior Infarction
Infarct that affects the anterior wall as well as the anteroseptal wall and/or the anterolateral wall. Abnormal Q waves and/or ST elevation is seen in any or all of the precordial leads.
Inferior Myocardial Infarctions
Inferior infarction is usually caused by an occlusion of the right coronary artery and commonly involves the inferior wall of the left ventricle. It can also be called a ―diaphragmatic infarct‖ because the inferior part of the heart sits on top of the diaphragm.
Q-waves and/or ST segment elevation is seen in inferior leads II, III and AVF. Since Q waves can sometimes be seen normally in lead III (see abnormal Q waves), an inferior infarct cannot be diagnosed on the basis of this lead alone. Reciprocal ST depression, a negative prognostic feature, is seen in the precordial leads (V1-V6) 50% to 70% of the time.
Inferolateral myocardial infarction fulfills criteria for inferior infarction as well as abnormal Q waves in lateral leads V5 and V6.
Inferoposterior myocardial infarction fulfills criteria for inferior infarction as well as abnormal criteria for posterior infarction. Posterior wall ischemia may be indirectly recognized by reciprocal ST depressions in leads V1 to V3.
Lateral Myocardial Infarctions
An occlusion of the left circumflex artery can cause an infarction of the lateral myocardial wall. Abnormal Q waves as well as other important changes such as ST segment elevation can be seen in lateral leads I, aVL, V5 and V6.
Anterolateral Infarction is caused by an occlusion of the left main coronary artery. Q waves and other important changes are seen in V5, V6, I, aVL and sometimes V4.
Inferolateral myocardial infarction fulfills criteria for inferior infarction as well as abnormal Q waves and/or ST segment elevation in
V5 and V6.
Posterolateral myocardial infarction fulfills criteral for posterior infarction as well as abnormal Q waves and/or ST segment elevation in leads I, aVL and/or V5, V6.
89
ABNORMALITIES OF REPOLARIZATION
Ventricular repolarization, the process by which depolarized cells repolarize, might be viewed as a wave front of negative charge, and would thus be expected to inscribe an EGG wave form in the opposite direction from depolarization. However, the two processes occur in opposite directions - depolarization from endocardium to epicardium and repolarization from the epicardium to the endocardium.
Therefore, the T-wave of repolarization should always be oriented in the same direction as the major portion of the QRS in each EGG lead.
The same is true of the U-wave that follows the T-wave (often seen best in V2-V4). Numerous processes may alter T-wave morphology.
THE ST-SEGMENT
This period of electrical quiescence between depolarization and repolarization should be isoelectric or slightly bowed (concave when viewed from above). Various processes cause ST-segment shifts:
a)ST-segment elevation
1.Early repolarization - a normal variant in which the J-point is elevated but the normal concave appearance of the ST-segment is preserved and the T-wave is normal.
2.Hyperkalemia - Tall, peaked T-wave; Flat P-waves.
3.Pericarditis.
4.Acute transmural myocardial ischemia.
5.Left ventricular aneurysm post-myocardial infarction.
b)ST-segment depression
Some degree of ST-segment depression occurs as the heart rate increases. By convention, ST-segment depression is called abnormal if the ST-segment is depressed > 1.0 mm below the baseline at a point 0.08 sec after the J-Point (the point where the ST-segment leaves the QRS). Numerous causes of ST-segment depression occur. Among them there are:
1.Subendocardial myocardial ischemia.
2.Alkalosis.
3.Hypokalemia - flat or inverted T-wave + prominent U-wave.
4.Digitalis, antiarrhythmic drugs.

90
5. LVH with ―strain‖ pattern.
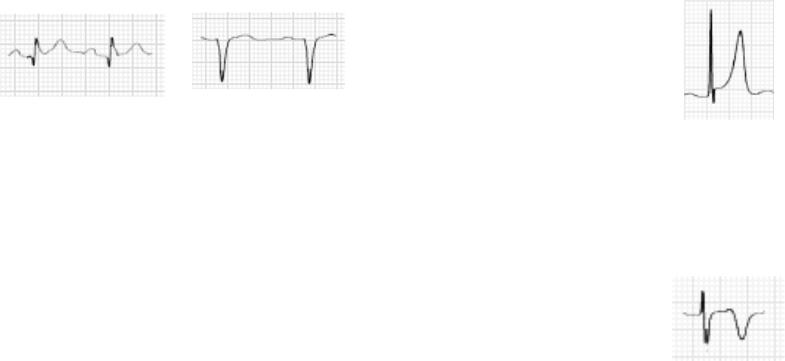
The examples below are ECG repolarization patterns: 1. Normal ECG (Fig. 72).
Fig. 72. Normal repolarization process.
2. Early Repolarization Syndrome (Fig. 73). ST-segment elevation after jag (―fish-hook‖), ST-segment by its convexity is bowed and transforms into the positive T-wave.
Fig. 73. Early Repolarization Syndrome.
3. Non-specific repolarization abnormality (Fig. 74). Bowed ST; flat, inverted T.
Fig. 74. Non-specific repolarization abnormality.
91
4. Left Bundle Branch Block (Fig. 75). QSV1, no septal q-V5, secondary ST-T abnormality – ST-depression, misshapen T. NOTE: ST-
T wave changes of LBBB are called ―secondary‖ as result of markedly altered depolarization (wide QRS).
Fig. 75. Left Bundle Branch Block.
5. Right Bundle Branch Block (Fig. 76). rSR’V1, Deep, terminal SV5, Secondary ST-T abn. in V1 but not in V5.
Fig. 76. Right Bundle Branch Block.
6. Digitalis effect (Fig. 77). ―Scooped‖ ST-segment, flat T-wave.
Fig. 77. Digitalis effect.

92
7. Left ventricular hypertrophy ―strain‖ pattern (Fig. 78).
Downsloping ST-segment, ST-T junction forms ―hockey stick‖ - always most prominent in leads with tallest R-waves.
Fig. 78. Left ventricular hypertrophy ―strain‖ pattern.
8. Ischemia (Fig. 79). Straight to convex ST-segment V-shaped, symmetrically inverted T-wave.
Fig. 79. Ischemia.
9. Quinidine effect (Fig. 80). Broad T-wave, long QT interval (0.58 sec). T-wave inversion in this example is due to previous myocardial infarction.
Fig. 80. Quinidine Effect.
93
STANDARD EXERCISE ELECTROCARDIOGRAPHY
The exercise stress test is not only a means of establishing the diagnosis of myocardial ischemia, but can also be used to assess the efficacy of antianginal therapy and the extent of the myocardium at risk, to identify patients to have possibly more severe coronary artery disease, and to assess serially the degree of conditioning or exercise capacity in patients of all age groups.
The rational behind the exercise stress testing is that as the work performed by a patient increases, the cardiac work increases. This increase in work results in an increase in myocardial oxygen utilization, which demands an increase in coronary blood flow. If narrowed or obstructed coronary arteries prevent the required increase in coronary blood flow, ischemia may occur and be manifested as a chest pain or EGG changes.
Various techniques have been devised, but the most commonly used and best standardized ones require a patient to be monitored with a 12-lead EGG while walking on a treadmill at work loads that can be progressively increased by increasing the speed and inclination of the device. A bicycle ergometer (with hand pedals) may be substituted for a treadmill, permitting a patient to exercise with his or her arms instead of legs. This is particularly useful in patients who cannot use a treadmill because of claudication, arthritis, or amputation, and in the evaluation of patients who have chest pain predominantly or exclusively with work that involves arms and shoulders.
The stress test should be performed in a facility that has equipment and staff trained to deal with arrhythmias and other cardiac emergencies. With properly selected patients and an appropriately equipped laboratory and the trained staff, an exercise stress test is a safe procedure with reported mortality rates of approximately 0.01%.
Ordinarily a patient exercises until a predetermined heart rate is attained. This is usually 90% of the maximal heart rate predicted
94
on the basis of a patient's age. This goal can be modified according to the pre-exercise evaluation of a patient, keeping in mind the needs of a patient and a physician. For example, in a young person in whom there is a low probability of ischemic heart disease, attempting to reach the maximal heart rate or exercising a patient to the point of exhaustion is reasonable and adds to the sensitivity of the study. A negative study under such circumstances is strong evidence against myocardial ischemia. On the other hand, in an older patient a negative study (no chest pain and no ischemic EGG changes) may be clinically meaningful at a lesser work load if the work load approximates a patient's normal daily activity.
Criteria
The electrocardiographic criterion for a positive stress test is generally considered to be downsloping or horizontal ST depression of more than 1 mm. Correlation of significant angiographic (usually defined as 50% luminal narrowing of at least one major coronary vessel) and electrocardiographic results shows the 65% sensitivity of the test. This means that only 65% of patients with documented significant coronary artery disease have an abnormal exercise EGG and 35% have a false-negative result. However, the specificity of the EGG exercise is 90%, which means that 90% of people without coronary artery disease have a normal exercise EGG and 10% have a false-positive response. If stricter criteria for a positive stress test are used, such as 2 mm ST depression for the diagnosis of ischemia, the sensitivity decreases and the specificity increases. It is important to note that with more extensive coronary disease (e.g., severe three-vessel or left main disease), false-negative studies are rare.
False-positive stress tests are often encountered in patients taking various medications (e.g., digitalis or phenothiazines), in women, and in patients with left ventricular hypertrophy or mitral valve prolapse. In such patients or in patients with baseline STsegment abnormality or conduction defects such as LBBB and
95
RBBB or other conduction system disorders (e.g., Wolff- Parkinson-White syndrome), the sensitivity of the exercise stress test can be enhanced by concurrent radioisotopic or echocardiographic imaging and is commonly used.
Occasionally, especially in patients after transmural myocardial infarction, ST-segment elevation may be noted during exercise. Studies show that this finding in itself does not indicate ischemia but rather relates to the size of the underlying infarct and probably suggests left ventricular dysfunction. ST elevation in leads without Q waves, however, does indicate ischemia.
In evaluating the results of exercise stress testing, it is important to keep in mind Bayes' theorem: The predictive accuracy (number of subjects with true positive tests divided by the number of positive tests) of any diagnostic test is directly related to the sensitivity of the test (the percentage of patients with the disease in whom the test is positive), the specificity of the test (the percentage of patients without the disease in whom the test is negative), and the prevalence of the disease in the population studied. This relationship exists whenever the specificity of any test is less than 100%. In populations that have a high prevalence of disease, the predictive accuracy is very high even when sensitivity and specificity are low, Conversely, the predictive accuracy is very low in groups of patients with a low prevalence of disease even when the procedure has high specificity and high sensitivity. Therefore the predictive accuracy of an exercise stress test depends on the characteristics of the population studied. In men with classic angina pectoris or previous myocardial infarction, a positive exercise stress test accurately predicts the presence of occlusive coronary artery disease approximately 85% of the time.
Indications for Exercise Stress Testing
In general, exercise stress testing is used for diagnostic or prognostic purposes or to assess the effectiveness of therapy.
96
To clarify the cause of chest pain.
This is probably the most common reason for recommending an exercise stress test in an ambulatory population. In some practices, exercise stress tests are recommended for many patients to provide reassurance that chest pain is not caused by cardiac ischemia. In such cases, factors influencing sensitivity, specificity, and predictive accuracy of the test must be kept in mind.
To assess prognosis in patients with known ischemic heart disease and after myocardial infarction.
A positive stress test after minimal exertion, hypotension with exercise, or extensive sustained ST depression in several EGG leads probably indicates severe three-vessel disease or left main coronary artery disease. Studies from the pre-thrombolytic era suggested that a positive submaximal stress test in patients after myocardial infarction identified a high-risk population and recommended that such patients be considered for coronary arteriography. The 1996 American Heart Association-American College of Cardiology Guidelines support symptom-limited treadmill testing at 3 weeks after myocardial infarction.
Serial stress tests, at 18-month intervals, can also be used to follow patients with stable angina. Deterioration in performance (angina or ischemic changes on the EGG at a lower work load) strongly suggests worsening coronary artery disease. Occasionally, the physiologic significance of an anatomic lesion (e.g., 30 to 50% left anterior descending coronary artery stenosis) noted at coronary arteriography may be questionable. In such a patient, a positive stress test in the appropriate EGG leads or a reperfusion defect on a thallium scan (see below) would clearly define the hemodynamic significance of the anatomic lesion.
To ascertain the effects of medical or surgical (revascularization) management of coronary artery disease, particularly when baseline studies have been performed.
97
The exercise stress test documents objectively whether a patient has improved and, if so, to what extent. The documentation of improvement with a stress test is often reassuring to a patient and in many instances necessary before an employer will allow a patient to return to work (especially if physical labour is required). On the other hand, patients with worsening coronary artery disease can also be identified, and in such patients more aggressive evaluation, such as coronary arteriography, may be indicated.
To document the response of a patient with a cardiac arrhythmia to exercise and to document the response of arrhythmia to therapy.
This is particularly useful in patients in whom the history suggests exercise-induced arrhythmia. Decrease in ventricular ectopy with the exercise in a patient with known ventricular arrhythmias is often a favourable prognostic sign.
Contraindications to Exercise Stress Testing
There is a number of contraindications to stress testing. The recent onset of unstable angina pectoris after a period of stabilization or acute myocardial infarction is a relative contraindication to exercise stress testing. Most of these patients should not be subjected to maximal exercise stress tests. However, modified submaximal stress tests can be performed with a reasonable degree of safety in selected patients as early as day 4 or 5 after myocardial infarction. The information thus obtained may be invaluable for making recommendations about physical activity and further therapy.
Uncontrolled hypertension is a relative contraindication and depends on the level of blood pressure and the degree of the terminal organ impairment.
Exercise stress testing should not be performed in patients with severe uncontrolled congestive heart failure because of the risk of acute pulmonary edema, hypotension caused by the low cardiac output and serious arrhythmias.
98
Significant ventricular arrhythmias are relative contraindication to exercise stress testing. However, it may be difficult to know before the test whether a given ventricular arrhythmia is significant because patients with frequent multifocal premature ventricular contractions may show a decrease or an increase in ectopic activity when stressed. If ventricular ectopy increases with exercise, the test should be terminated.
Suspected severe valvular disease, particularly obstructive valvular disease such as mitral stenosis, aortic stenosis, or sub valvular aortic outflow obstruction, may impose serious risks on patients who are exercised. This is because the heart may be unable to increase cardiac output in response to an increased demand. In such patients the usual
increase in blood pressure with exercise significantly increases ventricular afterload and thus reduces perfusion. Again, however, modified stress tests can probably be performed with a reasonable degree of safety in appropriately selected patients.
Exercise stress testing should be performed with caution in a variety of other conditions. Exercise testing is contraindicated in patients with myocarditis, acute pericarditis, severe pulmonary hypertension, and recent pulmonary embolism, atrial fibrillation with an uncontrolled ventricular response, intercurrent acute systemic illness, or significant infection. Patients with a high degree of AV-block should be exercised cautiously because they may not be able to increase their heart rate appropriately. Patients with severe chronic pulmonary disease, such as increased bronchospasm, increased hypoxemia, or cardiac arrhythmias, may have difficulty when exercised. However, exercise stress tests in such patients, with concomitant pulmonary function studies and blood gas analyses, can provide useful information.
99
Patient Experience
A patient spends 1 to 1.5 hours at the stress test laboratory and should not eat for at least 2 hours before the test; the preceding meal should be light and should not contain butter, cream, coffee, tea, or alcohol; comfortable clothes and shoes should be worn. A patient should be told which regular medicines should be taken on the day of the test (if not told at the time the appointment was made, a patient should be instructed to telephone the stress test laboratory to inquire about medications several days in advance). Before testing, EGG leads are applied to the chest and blood pressure cuff is applied to one arm. The test consists of walking on a treadmill; the speed and the slope of the treadmill are increased during the test. Alternatively, the test may consist of pedaling on a bicycle ergometer. The patient is asked to exercise to a point where discomfort is experienced; if chest pain, shortness of breath, claudication, or light-headedness are experienced, the test is terminated. The degree of exercise is consistent with the age and physical condition of a patient. The duration of the test is determined by the time it takes to reach an age-predicted maximal heart rate (usually no more than 10 to 15 minutes).