

Cardiology / Электрокардиография Ослопова 2005 года
.pdf40 |
41 |
Fig. 21. Tall, peaked P waves in II & III due to RA hypertrophy. VENTRICULAR HYPERTROPHY
Left Ventricular Hypertrophy (LVH) Echocardiographic studies have shown that the ECG is an
insensitive tool for diagnosing LVH (a condition associated with increased cardiovascular mortality).
LVH is suggested by a constellation of ECG findings:
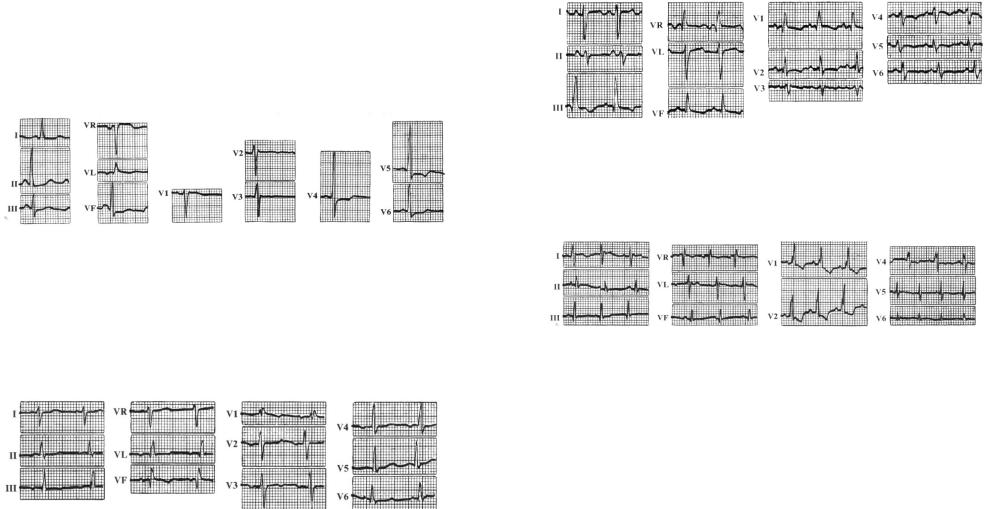
1) Increased QRS voltage - various criteria have been proposed. LV leads (V5-6) show tall, slightly widened R waves, while on the right side (V1-2) correspondingly altered S waves appear (Fig. 22, a). 2) Though amplitude by itself is not a reliable criterian for excluding LV hypertrophy (because of variation in such factors as skin resistance and thickness of subcutaneous tissue), commonly accepted criteria of LVH include:
-R or S wave in limb leads > 20 mV
-R in aVL > 11 mV
-Sum of RV1 (RV2) + SV5 (SV6) >35 mV
3) Overall QRS duration is increased to somewhere between 0,10- 0,12 sec.
Early LV hypertrophy shows only these QRS changes. In severe hypertrophy, the changes of S-T depression and T wave inversion are added to the left-sided pattern, the results of prolongation of the excitation phase and reversal of the normal direction in which recovery takes place (Fig. 22, c). An intermediate or moderate grade can be recognized in which there is slight S-T depression accompanied by T wave flattening without frank inversion (Fig. 22, b).
Fig. 22. Left ventricular hypertrophy.
The heart is usually electrically horizontal, i.e. there is left axis deviation in the limb leads. The abnormal LV surface pattern is therefore transmitted chiefly to I and aVL, with the right-sided S waves going to III and aVF (Fig. 23).
Fig. 23. Left ventricular hypertrophy with electrically horizontal position.
42
Occasionally, the normal semi-vertical position is maintained. This so-called concordant LV hypertrophy pattern characteristically occurs in aortic stenosis, where hypertrophy is unaccompanied by over-filling and dilatation of the LV cavity. Lead II remains the ―axial lead‖, showing the tallest R wave and reflecting the left-sided S-T changes (Fig. 24).
Fig. 24. Left ventricular hypertrophy with electrically semi-vertical position.
Right Ventricular Hypertrophy (RVH)
Changes due to RV hypertrophy are best seen in leads recorded from near the surface of the right ventricle itself, i.e. VI and V2. The terminal R deflection is delayed and increased in amplitude. In early RVH the only abnormality may be an increase in R-R duration to more than 0,04 of a second (Fig. 25).
Fig. 25. Early Right ventricular hypertrophy.
A clearly dominant R in V1 suggests a more advanced grade, while severe RVH causes R dominance extending from VI to V2 or V3, accompanied by T wave inversion and S-T depression (Fig. 26, 27).
More remote leads do not always reflect the increase in the right ventricular mass. Left-sided chest leads may show the reciprocal change of a delayed or prominent terminal S wave (Fig. 26).
43
Fig. 26. Severe Right ventricular hypertrophy (in pulmonary fibrosis)
The limb leads usually indicate right axis deviation, the average electrical force of ventricular excitation being displaced by the increased RV contribution (Fig. 25-27). In severe cases, the right-sided S-T changes tend to be transmitted to leads III, aVR and aVF (Fig. 26).
Fig. 27. Severe Right ventricular hypertrophy (in cyanotic congenital heart disease).
Three ECG patterns of RVH have been described:
1) Type A:
a)R > S in VI - V2 usually due to severe RVH (R-type)
b)M-shaped form of QRS-complex (M-type)
2) Type B:
R = S in V1-V6 in states of predominantly septal hypertrophy (i.e. Tetralogy of Fallot)
3) Type C:
Prominent S waves in V5-V6.
All 3 kinds of RVH are commonly accompanied by the Right axis deviation and Right atrial abnormality.
INTRAVENTRICULAR CONDUCTION DISTURBANCES
(BUNDLE OF HIS BRANCHES BLOCK)
Block of one or other bundle branch delays contraction of the corresponding ventricle, excitation of which has then to take place by

44
relatively slow muscle-to-muscle conduction from the contralateral ventricle.
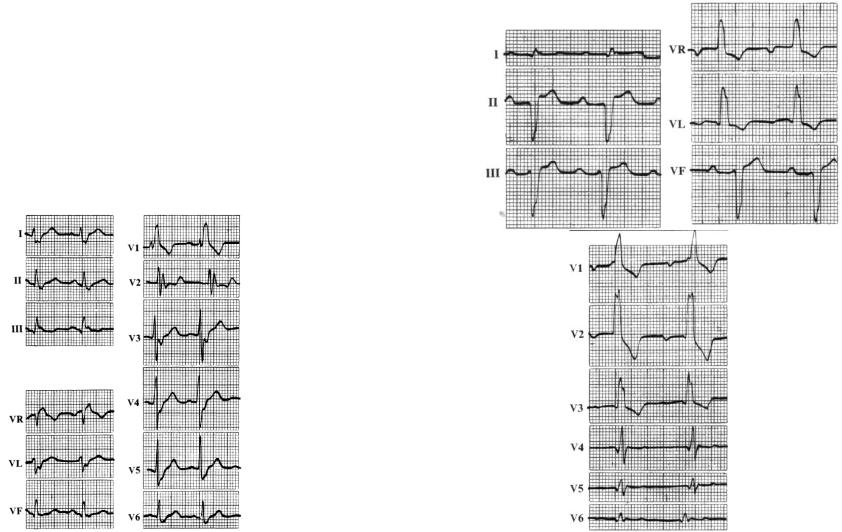
Leads recorded in the direction of the delayed ventricle display a predominantly positive M-shaped QRS complex exceeding 0,12 seconds in duration, followed by S-T segment depression and T wave inversion (Fig. 28): these features are due to the abnormally slow approach of the excitation wave. Leads recording in the opposite direction, i.e. overlying the contralateral ventricle, show the reciprocal pattern of a widened, notched S wave resembling the letter W.
Fig. 28. M-shaped QRS complex of bundle branch block.
Intrinsic impairment of conduction in either the right or left bundle system (intraventricular conduction disturbances) leads to prolongation of the QRS interval. With complete bundle branch blocks the QRS interval is 0,12 sec in duration; with incomplete blocks the QRS interval is between 0,10 and 0,12 sec. The QRS vector is usually oriented in the direction of the myocardial region where depolarization is delayed. Thus, with right bundle branch block, the terminal QRS vector is oriented anteriorly and to the right (rSR in V1 and qRS in V6,
typically). Left bundle branch block alters both early and later phases of ventricular depolarization. The major QRS vector is directed to the left and posteriorly. In addition, the normal early left-to-right pattern of septal activation is disrupted such that septal depolarization proceeds from right to left as well. As a result, left bundle branch block generates wide, predominantly negative (QS) complexes in lead V1 and entirely
positive (R) complexes in lead V6. A pattern identical to that of the left
bundle branch block, preceded by a sharp spike, is seen in most cases of electronic right ventricular pacing because of the relative delay in left ventricular activation.
45
Bundle branch block may occur in a variety of conditions. In subjects without structural heart disease, the right bundle branch block is seen more commonly than the left bundle branch block. Right bundle branch block also occurs with heart disease, both congenital (e.g. atrial septal defect) and acquired (e.g. valvular, ischemic). Left bundle branch block is often a marker of one of four underlying conditions: ischemic heart disease, long-standing hypertension, severe aortic valve disease, and cardiomyopathy. Bundle branch blocks may be chronic or intermittent. A bundle branch block may be rate-related; for example, often it occurs when the heart rate exceeds some critical value.
Bundle branch blocks and depolarization abnormalities secondary to artificial pacemakers not only affect ventricular depolarization (QRS) but are also characteristically associated with secondary repolarization (ST-T) abnormalities. With bundle branch blocks, the T wave is typically opposite in polarity to the last deflection of the QRS. This discordance of the QRS-T-wave vectors is caused by the altered sequence of repolarization that occurs secondary to altered depolarization.
LEFT BUNDLE BRANCH BLOCK
Diagnosis is a simple matter of inspecting the chest leads. In left bundle branch block (LBBB) the left-sided leads V5-6 show the positive M-shaped pattern, whereas the right-sided leads have the reciprocal W pattern (Fig. 29).
Transmission of the abnormality to the limb leads depends on heart position. This is usually horizontal, as indicated by the arrow in the diagram. The left-sided pattern thus appears in leads I and aVL, while the right-sided pattern is reproduced in lead III and to a lesser extent in aVF. The typical limb lead appearances in left bundle branch block are shown in Fig. 30 (from the same record as Fig. 29).
An additional feature of diagnostic importance which should be noted is the invariable absence of an initial Q deflection from the leftsided pattern. This is due to the fact that, when the left bundle branch is blocked, excitation of the intraventricular septum can no longer take place in the normal left-to-right direction.

46
Fig. 29. Left bundle branch block.
FASCICULAR BLOCKS
Fascicular Blocks (partial blocks, ―hemiblocks‖) in the left bundle system (left anterior or posterior fascicular blocks): these are blockages of transmission that also may occur in the anterior or posterior branches (fascicles) of the left bundle branch. The main effect of a fascicular block is to markedly change the QRS axis without changing the shape or duration of the QRS wave form.
Left Anterior Hemiblock
As to the degree of the EA deviation to the left, characteristic of the block of the anterior branch of the left bundle branch (Left Anterior Hemiblock), yet there is no unanimous opinion in this respect. The majority of authors think EA sharp deviation to the left to be specific for this blockade, when -60 . In that RI>RII>RIII, SIII>RIII, SII>RII, RaVR Q(S)aVR. , making up from -45 to -60 , clearly points at the presence of the incomplete block of the anterior branch of the left bundle branch. In contrast to the complete block, in the incomplete
47
block of the anterior branch Q(S)aVR>RaVR. In <-30 -45 one should make conclusion only concerning the EA sharp deviation to the left.
Fig. 29. LBBB, horizontal heart position: transmission to limb leads.
Left Posterior Hemiblock
The majority of researchers think EA sharp deviation to the right to be characteristic of the block of the posterior branch of the left bundle branch (Left Posterior Hemiblock), when +120 . In that RIII>RII>RI, SI>RI, RaVR Q(S)aVR. Diagnosis of the Left Posterior Hemiblock can be made in EA sharp deviation to the right ( +120 ) and absence of pulmonary chronic disease, hypertrophy of the right ventricle, vertical position of the heart, and chest reformation, especially
48
in people over 40 (who may have EA horizontal position). Incomplete Left Posterior Hemiblock may be supposed in ranging from +90 to +120 in people over 40 without clinical data concerning right ventricular hypertrophy, chest deformation and vertical position of the heart.
RIGHT BUNDLE BRANCH BLOCK
Right bundle branch block (RBBB) results in delayed activation of the right ventricle. In right-sided chest leads (Vl-2) this is manifested in delayed and heightened R waves followed by S-T segment depression and T wave inversion (Fig. 30). In left-sided leads, potentials due to normal left ventricular excitation continue to predominate, but there are correspondingly delayed and prominent terminal S waves. As in the case of the left BBB, the heart is usually more or less horizontal in position. The positive M-shaped complexes tend therefore to be transmitted to leads III and aVF, while left-sided limb leads like lead I display the exaggerated S wave. Fig. 30 demonstrates these typical appearances.
Fig. 30. RBBB, usual horizontal heart position.
49
Occasionally, however, the heart is vertical, when casual examination of the limb leads alone may be misleading. Right BBB, obvious in the chest leads, gives limb lead appearances resembling those usually associated with a lesion of the left bundle - apart from a positive complex in aVR (aVR always shows the right-sided pattern, regardless of heart position). Fig. 30 shows this vertical position with right BBB, together with partial A-V block.
Fig. 30. Right BBB, vertical heart position, and prolonged PR interval.

50
COMBINATIONS OF FASCICULAR AND BUNDLE BRANCH BLOCKS
More complex combinations of fascicular and bundle branch blocks may occur involving the left and right bundle system. Examples of bifascicular block include the right bundle branch block and the left posterior fascicular block, right bundle branch block with left anterior fascicular block, and complete left bundle branch block. Chronic bifascicular block in an asymptomatic individual is associated with a relatively low risk of progression to high-degree AV heart block. In contrast, new bifascicular block with acute anterior myocardial infarction carries a much greater risk of complete heart block. Alternation of right and left bundle branch block is a sign of trifascicular disease (Fig. 31). However, the presence of a prolonged PR interval and bifascicular block does not necessarily indicate trifascicular involvement, since this combination may arise with AV node disease and bifascicular block. Intraventricular conduction delays can also be caused by extrinsic (toxic) factors that slow ventricular conduction, particularly hyperkalemia or drugs (type 1 antiarrhythmic agents, tricyclic antidepressants, phenothiazines).
Fig. 31. Trifasicular block (Complete Right Bundle Branch Block, Left Anterior Hemiblock, and Long PR interval).
51
CONTROL TASKS AND QUESTIONS
1.Name the P-mitrale signs.
2.Name the P-pulmonale signs.
3.What leads is it better to diagnose the atrial combined hypertrophy in?
4.What is characteristic of the left ventricular hypertrophy?
5.Enumerate and characterize ECG variants of the left ventricular hypertrophy.
6.Fill in the table:
Variants of the left ventricular hypertrophy
|
Form of QRS |
Form of QRS |
Change of the |
Variants |
complex in V1-2, |
complex V5-6, |
terminal part of the |
|
III, aVF |
I, aVL |
ventricular complex |
|
|
|
|
Type A (―R-type‖) |
|
|
|
|
|
|
|
Type A (―M-type) |
|
|
|
Type B
Type C
7.Name the general signs of intraventricular conduction disturbance.
8.Fill in the table:
Disturbance of intraventricular |
ECG-signs in V1-2, |
ECG-signs in V5-6, |
conduction |
III, aVF |
I, aVL |
|
|
|
Right bundle branch block |
|
|
|
|
|
Left bundle branch block |
|
|
|
|
|
52
UNIT 2
Theme 1. SINUS RHYTHM DISTURBANCES. SINO-ATRIAL BLOCK. ATRIOVENTRICULAR BLOCK. PREEXCITATION
SYNDROME.
Goal:
to get a notion about sinus rhythm disturbances, sino-atrial block, and atrioventricular block; to master skills.
Knowledge objectives:
to know the general signs of the disturbance of impulse conduction at different levels (sinus node, atria, atrioventricular node), the criteria of sinus rhythm disturbances, sino-atrial block, and atrioventricular block; approach to ECG-rhythm analysis.
Skill objectives:
to develop practical skills in analyzing electrocardiogram with sinus rhythm disturbances, sino-atrial block, and atrioventricular block.
EDUCATIONAL MATERIAL
BASIC CAUSES OF THE HEART RHYTHM DISTURBANCE
There are three basic causes of disturbance of the heart rhythm:
1.Suppression or enhancement of initiation or propagation of the action potential.
2.Re-entry of the action potential into a pathway through which it has already passed.
3.Triggered activity.
1. Suppression or Enhancement of Initiation or Propagation of Action Potential
A disease process that interferes with pacemaker activity within the SA node or with the movement of the electrical impulse through the normal conduction pathways of the heart results in abnormal slowing of the heart rate (bradyarrhythmia) and/or in one of the various forms of heart block.
53
Enhanced automaticity of a part of the cardiac conduction system may result in the initiation of an impulse more rapidly than is normally generated by the SA node. If that happens episodically, occasional premature contractions occur, the nature of which depends on the location of the ectopic pacemaker. On the other hand, if there is rapid sustained firing of the ectopic focus, a tachyarrhythmia ensues.
2. Re-entry
Most clinically significant arrhythmias result from re-entry (Fig. 32). Re-entrant arrhythmias occur in the setting of two anatomically or functionally distinct conduction pathways, unidirectional conduction block in one of the pathways, and slowed conduction. When these three conditions are fulfilled, the electrical impulse may travel down one limb of the re-entrant circuit and return via the second limb of the circuit resulting in a ―short circuit‖ or ―circus‖ arrhythmia. The conditions needed for the development of re-entrant arrhythmias often occur in the setting of structural heart disease or, less commonly, result from anatomic abnormalities such as an accessory AV connection, as in the case of the Wolff-Parkinson-White (WPW) syndrome.
3. Triggered Activity
Triggered arrhythmias are less common; they result from afterdepolarizations that follow an action potential and that reach threshold for triggering additional impulses. Examples of triggered arrhythmias include torsades de pointes, multifocal atrial tachycardia, and atrial tachycardia resulting from digitalis toxicity.
SINUS RHYTHM DISTURBANCES
Sinus rhythms originate in the sinoatrial node. Diagnosis of sinus rhythms requires examining leads II and aVR for the correct polarity of the P waves. The P wave is always positive in lead II and negative in lead aVR. P wave will precede each QRS complex, and the P-R interval should be constant. In adults the normal sinus rate is 60-90 (100) beats per minute.

54
Figure 32. Sequence of activation of a loop of Purkinje fiber bundles and ventricular muscle (VM) during reentry.
A region of unidirectional conduction block is indicated by the dark shaded area in branch B. Conduction cannot occur through this area in the antegrade direction (from B to VM), but only in the retrograde direction (from VM to B). Slow conduction is present in the loop. The bottom of the figure shows a possible electrocardiographic pattern that may result from this type of reentry. [From Wit AL, Rosen MR, Hoffman BF. Electrophysiology and pharmacology of cardiac arrhythmias. II. Relationship of normal and abnormal electrical activity of cardiac fibers to the genesis of arrhythmias. B. Re-entry, Section I. Am Heart J 88:664, 1974].
SINUS TACHYCARDIA
Sinus rhythm with a rate > 90 (100) beats per minute is usually a physiologic rhythm in that the rate is ordinarily appropriate to the physiologic state of a patient, the state that requires an increased cardiac output to meet increased metabolic demands. With fast rates, P waves may be merged with preceding T waves and be indistinct. They can originate from the sinoatrial node, atrial muscle, or atrioventricular
55
junction, often referred to as supraventricular tachycardia without specifying the site of origin.
SINUS BRADYCARDIA
Sinus Bradycardia is a heart rate below 60 beats per minute. Impulse generation in the sinus node is often slow in aerobically wellconditioned people (e.g., long-distance runners, heavy labourers) because of high vagal tone.
SICK SINUS SYNDROME
In elderly people, the sinus node may undergo degenerative changes and fail to function effectively. Periods of sinus arrest, sinus tachycardia, or sinus bradycardia may occur.
The term sick sinus syndrome refers to a heterogeneous group of arrhythmias involving defective impulse generation by the sinus node or abnormal impulse conduction in the atria and AV-node. The syndrome is characterized by periods of inappropriate sinus bradycardia (often severe with rates between 25 and 40 beats/minute) that may precede or follow supraventricular tachyarrhythmias and by varying degrees of sinoatrial block, sometimes including sinus arrest. The rubrics bradycardia-tachycardia syndrome and tachycardia-bradycardia syndrome are sometimes used, depending on whether bradycardia precedes or follows a tachyarrhythmia.
The ECG may be normal or may simply reveal sinus bradycardia. Often, there are varying degrees of sinoatrial block, characterized by varying PP-intervals on the ECG. Sometimes sinus arrest occurs, manifested by absent P waves and usually associated with a junctional escape rhythm. Some patients have slow atrial fibrillation reflecting a concomitant AV conduction abnormality.
SINOATRIAL BLOCK (SA BLOCK)
SA block refers to failure of the sinus node to function for one or more beats. In this condition, there are simply one or more missing beats; i.e., there are no P waves and QRS complexes seen. Fortunately, when the sinus fails to function for a significant period of time (sinus
56
arrest), another part of the conduction system usually assumes the role of a pacemaker. These pacing beats are referred to as escape beats and may come from the atria, the atrioventricular junction, or the ventricles.
SA block of the 1 degree appears as a result of the delayed formation of impulses in the sinus node or their delayed conduction to the atria. It isn’t manifested clinically and electrocardiographically (by usual electrocardiographic examination). SA blocks of the II and III degree are clinically expressed as Morganji-Adams-Stocks attacks (sudden loss of consciousness, dizziness in mild cases, paleness, sometimes spasmodic convulsions, pulse and blood pressure disappearance). SA block of the III degree (complete SA block) is equivalent to the ―sinus node arrest‖. It is characterized by bradycardia and replacing rhythm (from atria, AV-junction, ventricles).
By means of ECG it is possible to diagnose SA block of the II degree. SA block of the II degree means conduction disturbance when the normal sinus rhythm is interrupted by separate prolonged episodes during which the impulses, generated by sinus node, can’t reach the atria. Because of the block of impulses neither atria nor ventricles are excited thus leading to the disappearance of the whole complex of PQRST.
There are 2 types of SA block of the II degree:
1)II degree SA block, Mobitz I (with Samoilov-Wenckebach periodics), or Wenckebach type;
2)II degree SA block, Mobitz II.
II degree SA block, Mobitz I
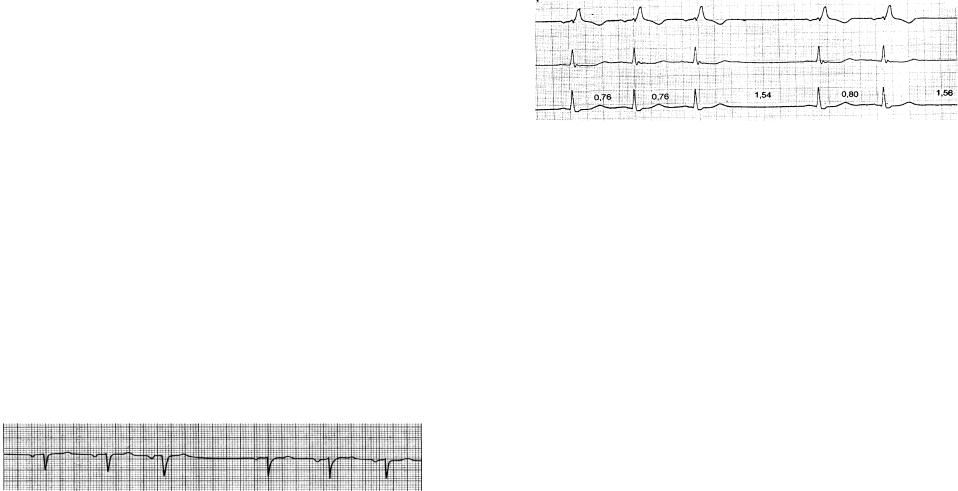
PQRST disappearance is indicated by a pause on the ECG, its duration is less than doubled shortest PP-interval. PP-interval on the ECG progressively shortens until there appears a pause next followed by repetition (Fig. 33).
Fig. 33. Sinoatrial block, II degree, Mobitz I
57
II degree SA block, Mobitz II
РР-interval between the conducted impulses is normal. PQRST disappearance is indicated by a pause on the ECG, its duration is multiple to the PP-interval duration, i.e. twice, three times, four times, etc. exceeds the duration of the normal PP-interval (Fig. 34). The pause duration is measured from the P-wave preceding the pause up to the P- wave following it.
Fig. 34. Sinoatrial block, II degree.
(falling out of the cardiac cycle (PQRST), presence of the pause equal to the doubled previous PP-interval)
ATRIOVENTRICULAR HEART BLOCKS
The PQ(R) interval normally varies with heart rate but should not exceed 0,21 sec in people in normal sinus rhythm. A prolongation of the PR interval is usually caused by degenerative, ischemic, or inflammatory changes in the AV conduction system.
AV Heart block occurs in 3 forms: the first degree, the second degree, and the third degree. The second degree heart block is divided into two types: Mobitz type 1 and Mobitz type 2.
First Degree Heart Block: First degree AV block in itself does not produce symptoms or abnormal physical findings except the first heart sound that is reduced in intensity. The ECG abnormality is simply a prolonged P-R interval to greater than 0,21 seconds (Fig. 35).
Second-degree AV block is present when some but not all P waves are followed by QRS complexes. It is caused by conduction delay or block either in the AV node or in the conduction system below the AV node, most commonly caused by ischemic heart disease or idiopathic cardiomyopathy.

58
Fig. 35. First-degree AV Block
(PR interval prolonged to 0,4 sec; paper speed 25 mm/sec).
Second Degree AV Block, or Mobitz-I AV block (with SamoilovWenckebach periodics), or Wenckebach type. This block within the AV node results in the Samoilov-Wenckebach phenomenon, characterized by progressive lengthening of the PR interval with shortening of the RR interval for several cycles until the P wave is blocked completely (Fig. 36). The dropped beat is seen as a P wave that is not followed by a QRS complex. The sequence begins again, often with a normal PR interval in the beat that follows the blocked P wave. The second degree AV block Mobitz-I is characterized by the ratio of the number of P waves to the number of QRS complexes in each cycle of block. In other words, if block occurs after every third P wave, it is called 3:2 Wenckebach.
Fig. 36. Mobitz-I second-degree AV block.
The Second Degree AV Block Type 2, or Mobitz-II AV block. It’s a more severe form of second degree block, since it often progresses to complete heart block. Mobitz-II block is defined as intermittent failure to conduct a P wave caused by the block below the level of the AV node (Fig. 37). The PR interval of the conducted beat before a blocked P wave is usually normal. The block may be intermitted or may occur in a fixed 2:1 or 3:1, etc. ratio. Coexistent bundle branch block is commonly seen. Progression to higher degrees of block or to asystole may occur rapidly. The characteristic ECG picture is that of a series of nonconducted P waves; e.g., 2:1, 3:1, 4:1, block.
59
Fig. 37. Mobitz-II AV block with 2:1 AV ratio.
The Third Degree Heart Block, also known as a Complete Heart Block. Complete heart block occurs when there is a total failure of conduction of impulses from atrial through the AV junction to the bundle of His (or, more rarely, if all three fascicles below the His bundle are diseased). The atrioventricular junction does not conduct any stimuli from the atria to the ventricles. Instead, the atria and the ventricles are paced independently.
The characteristic ECG-picture is:
1) P waves are present and occur at a rate faster than the ventricular
rate;
2)QRS complexes are present and occur at a regular rate, usually <60 beats per minute (usually 40 beats per minute);
3)the P waves bear no relationship to the QRS complexes (Fig.
38).
Thus, the ―P-R intervals‖ are completely variable. The QRS complex may be of normal or abnormal width, depending on the location of the blockage in the AV junction.
Fig. 38. Complete AV block
(QRS-form is changed because of following posterior myocardial infarction).
PRE-EXCITATION SYNDROME
The atria and ventricles are electrically isolated from each other by the AV groove, and the electrical signal from the atria is conducted to the ventricle via the AV node and conducting system. If the AV groove is short-circuited by muscle fibers, if muscle fibers from the atria enter the His bundle below the AV node, or if muscle fibers from the His bundle bypass the bundle branches, a variable portion of the right or left