

Cardiology / Электрокардиография Ослопова 2005 года
.pdf20
cardiac muscle increase. In the hypertrophy of the right atrium or the right ventricle the potentials of the ―right half of the heart‖ prevail which leads to the amplitude increase of the corresponding ECG waves in the right chest leads. Potentials predominance of ―the cardiac left half‖ in the hypertrophy of the left atrium or the left ventricle is shown on the ECG by the amplitude increase of the corresponding waves in the left chest leads.
Together, the frontal and horizontal plane electrodes provide a three-dimensional representation of cardiac electrical activity. The conventional 12-lead ECG can be supplemented with additional leads under special circumstances. For example, right precordial leads V3R,
V4R, etc. are useful in the detecting evidence of acute right ventricular
ischemia. Esophageal leads may reveal atrial activity not detectable on the surface ECG. In bedside telemetry units and ambulatory ECG (Holter) recordings one or two modified leads are usually employed.
GENESIS OF THE NORMAL ECG
P WAVE
The normal atrial depolarization vector is oriented downward and toward the subject's left, reflecting the spread of depolarization from the sinus node to the right and then the left atrial myocardium (Fig. 7). Since this vector points toward the positive pole of lead II and to the negative pole of lead aVR, the normal P wave will be positive in lead II and negative in lead aVR. By contrast, activation of the atria from an ectopic pacemaker in the lower part of either atrium or in the AV junction region may produce retrograde P waves (negative in lead II, positive in lead aVR).
QRS COMPLEX
Normal ventricular depolarization proceeds as a rapid, continuous spread of activation wavefronts. This complex process can be divided into two major, sequential phases, and each phase can be represented by a mean vector. The first phase is depolarization of the interventricular septum from the left to the right (Fig. 7).
21
Fig. 7. The ECG deflections (P & Q).
P-wave: excitation of the atrial myocardium, initiated by the impulse discharge from the sino-atrial node.
PQ-interval: passage of the impulse through the atrio-ventricular node (slow) and a-v bundle (rapid).
Q wave: excitation of the interventricular septum from the Left bundle branch, fractionally before the rest of the ventricular myocardium.
The second phase results from the simultaneous depolarization of the main mass of the right and left ventricles; it is normally dominated by the more massive left ventricle, so that vector 2 points leftward and posteriorly (Fig. 8).
Fig. 8. The ECG deflections (R wave).
Synchronous excitation of the majority of both ventricles, via respective bundle branches; wave travels outwards through ventricular walls, average direction being
mainly influenced by preponderant LV mass.
S wave deflects when excitation of remote portion of RV wall occurs, fractionally later than main ventricular excitation (Fig.9).

22
Fig. 9. The ECG deflections (S wave)
Therefore, a right precordial lead (V1) will record this biphasic
depolarization process with a small positive deflection (septal r-wave) followed by a larger negative deflection (S wave). A left precordial lead, e.g. V6, will record the same sequence with a small negative deflection
(septal q wave) followed by a relatively tall positive deflection (R wave). Intermediate leads show a relative increase in R-wave amplitude (normal R-wave progression) and a decrease in S-wave amplitude progressing across the chest from right to left. The precordial lead where the R and S waves are of approximately equal amplitude is referred to as the transition zone (usually V3 or V4).
Interval during which the ventricular myocardium remains in
―excited‖ (depolarised) state is called as an ST interval (Fig. 10).
Fig. 10. ST interval.
T WAVE AND U WAVE
Spread of electrical recovery wave through ventricular walls is slower than excitation. Normally, the mean T-wave vector is oriented roughly concordant with the mean QRS vector. Since depolarization and repolarization are electrically opposite processes, this
23
normal QRS-T-wave vector concordance indicates that repolarization must normally proceed in the reverse direction from depolarization (i.e., from the epicardium to the endocardium or from the cardiac apex to the base).
The normal U-wave is a small, rounded deflection that follows the T-wave and usually has the same polarity as the T wave. An abnormal increase in the U-wave amplitude is most commonly due to drugs (e.g., quinidine, procainamide, disopyramide) or hypokalemia. Very prominent U-waves are a marker of increased susceptibility to the torsades de pointes type of ventricular tachycardia.
Diastolic interval, during which the myocardium remains in the resting (repolarised) state until sinoatrial discharge initiates the next cardiac cycle.
REMEMBER:
1.P-wave – atrial depolarization.
2.PQ(R)-interval – depolarization of atriae & AV-node.
3.QRS – ventricular depolarization.
4.ST-segment – electrical quiescence.
5.U-wave – part of ventriculae repolarization, corresponds to period of time when ventricles are most vulnerable to developing serious ventricular arrhythmias.
THE ECG WAVE FORM
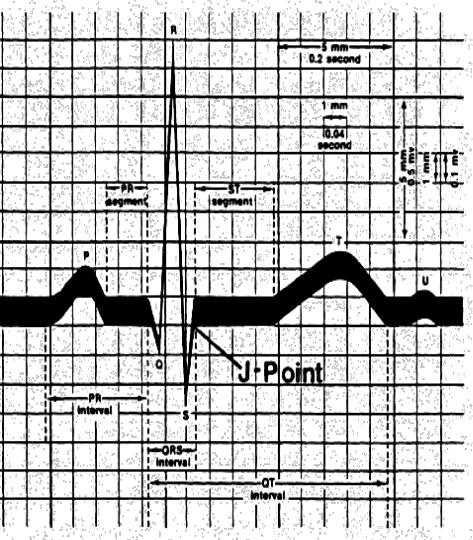
The ECG graphic recording consists of the main line (isoline) and the deflections from it (waves). ECG sections between the adjacent waves are called the segments and the distances between different waves including the segments are called the intervals. The waves, segments and intervals of the ECG are designated by P, Q, R, S, T letters (Fig. 11).
QRS terminology. The individual components of the ventricular excitation complex (QRS) are conventionally labelled as follows:
- 1st positive deflection - ―R‖, |
|
- 2nd and more positive deflection - |
―R ‖, |
- negative deflection preceding R - |
―Q‖, |
24
- negative deflection following R - ―S‖.
If a wave amplitude is more than 5 mm, the capital letter (e.g. R) is written, if it is less than 5 mm, the small letter (e.g. r) is written.
Fig. 11. The ECG wave form.
25
P-wave
Duration 0,06 - 0,10 sec; amplitude 0,5 – 2,5 mm.
Р-wave is recorded after the impulse leaves the sinus node and corresponds to the time of atria excitation.
The wave РII > РI > РIII and PII, III, aVF < TII, III, aVF in the norm.
РI, РII, РV2-V6 - always positive.
РIII, РV1 – can be positive, two-phase or negative. РaVR - always negative.
Time of the internal deflection of atrtia (TIDA)
Time of atrial activation reflecting the time from the beginning of the atrial excitation to the excitation envelopment of the maximal amount of its muscular fibers. It is measured from the beginning of the P-wave up to its apex. TIDA 0,04 sec is normal for the right atrium, TIDA 0,06 sec is normal for the left one.
PQ(R)-interval
Duration 0,12 - 0,20 (0,21) sec.
PQ interval includes P-wave and PQ(R)-segment and reflects the time of the excitation spreading on the atria and AV-junction, i.e. it characterizes the duration of AV impulse passage. PQ-interval tends to increase with a patient’s age; in bradycardia PQ can make up to 0,21 sec. In tachycardia PQ interval shortens (PQ normal values are advised to determine by special tables).
Makruz Index: 1,1 - 1,6 sec in the norm. It is performed according to the formula [P:PQ], where P is for the P-wave duration while PQ is for the duration of PQ-segment. This index is used in the diagnosis of atrial hypertrophy.
QRS complex
Duration 0,06 - 0,10 sec.
QRS-complex is recorded during excitation spreading along the myocardium of the ventricles.
Q-wave: duration < 0,03 sec, amplitude Q < 1/4 R (of the same lead).
R-wave: in standard and augmented leads R-wave amplitude depends upon electrical axis location; in the chest leads R-wave amplitude mustn’t exceed 25 mm. Normally the amplitude of QRScomplex must exceed 5 mm in one of standard leads and 8 mm in one of the chest leads at least.

26
S-wave: duration SI < 0,04 sec, amplitude SI = 0 - 4 mm.
S in not obligatory wave, by the amplitude usually makes up – ¼
from the R-wave.
Time of the internal deflection of ventricles (TIDV)
The activation time of the left and right ventricles is measured from the beginning of QRS-complex up to the perpendicular drawn from the R apex to the isoline. TIDV reflects the time from the beginning of the ventrical excitation to the excitation envelopment of the maximal amount of its muscular fibers. In the norm TIDV of the left ventricle 0,04 sec (is determined in V5 –V6), and TIDV of the right ventricle 0,03 sec (is determined in V1 –V2).
ST-segment
Normally it is located on the isoline. It can be wavy, oblique ascending or oblique descending, but only in 1 mm limits.
N.B.! If 1 mm dislocation of ST-segment appears in dynamics, it is necessary to exclude the pathological ST depression or elevation.
ST-segment reflects the period when both ventricles are excited.
T-wave
Duration 0,1 - 0,25 sec, amplitude ТI, II - 3 - 5 mm.
T-wave reflects processes of ventricular repolarization. The largest (by its amplitude) T-wave is naturally recorded in the lead where there is
the largest (by its amplitude) R-wave, and ТI>Т III. Normally ТI, II, V2-6 is always positive, ТIII, aVL, V1 can be smooth, negative or two-phase.
QT-interval
Duration 0,35 - 0,44 sec.
QT-interval is called the ventricular electric systole. QT duration depends upon the heart rate and patient’s sex. That’s why to calculate the QT duration the Bazette formula [QTс=k √RR] is used, where RR is for the distance between the adjacent R-waves on the ECG in seconds; k=0,37 for men and k=0,40 for women. Besides the standard tables of the ventricular electric systole for a given sex and the heart rate are used. Increase of the QT-interval is diagnosed in QTc > 0,44 sec. Another parameter, dispersion (variability) of QT-interval (QTcd), is nowadays considered to be a marker of nongomogeneity of repolarization
27
processes. Dispersion of the QT-interval is calculated by the formula [QTcd=QTmax-QTmin] (thus the difference between maximal and minimal values of the QT-interval, measured in the 12 leads recorded within 3-5 minutes at the recording rate of 25 mm/sec is determined).
QT-interval increase is a risk factor of sudden death from the ventricular fibrillation. Dispersion increase of QT-interval is a predictor of the development of fatal arrhythmia and sudden death.
U-wave
Amplitude 1 - 2 mm, inconstant wave. The clinical importance has a marked U-wave (U T), which can point at hypokalemia. The U-wave amplitude also increases in bradycardia, physical exertion, complete heart block, use of cardiac glycosides, quinidine, novocainamide, etc.
TP-segment
It is heart diastole. The segment is located on the isoline, its duration depends upon the heart rate.
RR-interval
Normally it can differ on one EKG, the difference shouldn’t be more than 0,1 sec. RR characterizes the duration of the cardiac cycle (of systole and diastole).
Measurement of heart rate (HR)
Precise calculation of the heart rate requires measurement of cycle length. This is the duration between any two analogous deflections of successive complexes (R peak to R peak is often the most convenient). Measure RR-interval in sec (at 50 mm/sec paper speed, each small box = 0,02 sec, each large box = 5 small boxes = 0,1 sec). Divide 60 (the number of sec per minute) by RR:
HR=60/RR.
A short-cut, approximate estimate of the rate can be made by dividing 600 to the number of large divisions in one cardiac cycle, e.g. in 6 large divisions in one cardiac cycle the heart rate is 100 beats per minute, 10 large divisions - 60 beats per minute and so on.
When ECG is recorded at 50 mm/sec, the number of large boxes separating 2 R-waves corresponds to HR as follows:

28
RR-interval |
12 |
11 |
10 |
9 |
8 |
7 |
6 |
5 |
4 |
(number of large boxes) |
|
|
|
|
|
|
|
|
|
Heart rate |
50 |
55 |
60 |
66 |
75 |
85 |
100 |
120 |
150 |
|
|
|
|
|
|
|
|
|
|
Regularities of the correlation of elements of the normal ECG
1.All three standard leads can’t simultaneously have the complete set of waves forming QRS-complex. That is, if Q and S are recorded in two leads, then there won’t be these waves in the third lead. The largest by the amplitude Q-wave is recorded in the lead with maximal R-wave.
Heart turns around the diametrical (transversal) axis are marked as a turn by the apex upwards or backwards. In the upward turn of the apex Q-waves are recorded while in the backward turn S-waves in I, II, III (aVF) leads are recorded. The presence of Q (no pathological) in all
three standard leads is marked as ―the syndrome of three Q‖ while the presence of S – ―the syndrome of three S‖1.
2.Normally Q-wave is absent in V1-2. Beginning with V4 there appears Q, its amplitude mustn’t exceed ¼ of the R-wave, its duration being not more than 0,03 seс.
3.In chest leads the S-wave has the largest amplitude in V1-2, and the least one - in V5-6.
ELECTRICAL AXIS
At any point in time, the projection of cardiac electrical forces on to the chest wall may be described as a VECTOR - a force with both MAGNITUDE and DIRECTION. Though the instantaneous vector changes throughout the cardiac cycle, one can calculate the NET or AVERAGE VECTOR of the P-wave, the QRS and the T-wave. This average vector is termed the ELECTRICAL AXIS (EA). Clinically, most information is derived from the QRS axis in the frontal plane (that is the plane running head-to-toe down the surface of the chest), which describes the pattern of left ventricular (LV) depolarization. The 6 frontal plane ECG leads
1 “S-syndrome‖ is rS-complex in I, II, III, aVF leads and is detected mostly in young people of asthenic build with the small middle-located heart.
29
form a hexaxial reference system. The heart is viewed as being at the centre of the 6 lead arrays (Fig. 6, 12).
Fig. 12. Hexaxial system
The QRS pattern in the extremity leads may vary considerably from one normal subject to another depending on the electrical axis of the QRS, which describes the mean orientation of the QRS vector with reference to the six frontal plane leads (Fig. 13-15). Normally, the QRS axis ranges from 30 to 69 . An axis more negative than 30 is referred to as a horizontal position, more negative than 0 - as a left axis deviation. An axis more positive than 70 is referred to as a vertical position, while an axis more positive than 90 is referred to as a right axis deviation.
REMEMBER: |
|
There are the following positions of |
EA: |
1) normal electrical axis position: |
= +30 +69 , |
2) horizontal electrical axis position: |
= 0 +29 , |
3) vertical electrical axis position: |
= +70 +90 , |
4)left electrical axis deviation: = -1 -90 ,
5)right electrical axis deviation: = +91 +180 .

30
Left axis deviation may occur as a normal variant but is more commonly associated with left ventricular hypertrophy, a block in the anterior fascicle of the left bundle system (left anterior fascicular block or hemiblock), or inferior myocardial infarction. Right axis deviation also may occur as a normal variant (particularly in children and young adults), as a spurious finding due to the reversal of the left and right arm electrodes, or in such conditions as the right ventricular overload (acute or chronic), infarction of the lateral wall of the left ventricle, dextrocardia, left pneumothorax, or left posterior fascicular block.
The average direction of the main ventricular excitation phase (or electrical axis) determines the dominant QRS deflection. With the heart in its normal semi-vertical position, this is closest to the direction of lead II, which therefore has the tallest R wave. aVR has a dominant S (negative) deflection, since it records in the opposite direction. The smallest ventricular deflections normally occur in aVL, which is almost at right angles to the axis (Fig. 13).
31
correspondingly (Fig. 14). This variant is common in older and thick-set subjects and when the diaphragm is high (pregnancy, ascites).
Fig. 13. Normal electrical position
Positional variation alters the normal QRS pattern. When the heart is more horizontal than normal (left-axis deviation) lead I becomes the ―axial lead‖ with the tallest R wave, and other leads are altered
Fig. 14. Electrically horizontal heart
The vertical position (right axis deviation) is less common as a normal variant in adults, but it is physiological in the early childhood. Lead I becomes negative, being now behind the axial direction (Fig. 15). Right ventricular hypertrophy, which displaces the average direction of excitation by increasing the right ventricular contribution to it is frequently responsible for this pattern.
Axis calculation - vector method
1.Determine the total amplitude of the QRS complex (that is, the total positive forces -the total negative forces) in leads I & aVF.
2.Draw arrows of the appropriate length & direction for the QRS amplitude in each lead. For example, if the total amplitude in each lead is 6 mV (6 mm or 6 small boxes) then one draws a 6 mm arrow on the
X-axis (lead I) pointing toward 0 degrees (the positive pole of lead I)

32
and a 6 mm arrow on the Y-axis (lead aVF) pointing toward 90 degrees (the positive pole of lead aVF).
3. Sum the two vectors: they form an isosceles triangle, the hypotenuse of which is the vector sum. The angle of the vector sum is the electrical AXIS of the QRS complex - 45 degrees in this case.
Fig. 15. Electrically vertical heart
Estimation of QRS Axis
For clinical purposes, calculation of the exact angle representing the QRS axis is not necessary. For quicker assessment of it is sufficient, with the help of Hexaxial system (Fig. 12), to orientate on the following three basic rules:
1. Find the lead which defines the highest R-wave in the minimal S- wave or without S-wave – EA is located in this area. E.g.:
RImax - horizontal electrical axis position,
RaVLmax - left electrical axis deviation, RIImax - normal electrical axis position,
RaVFmax - vertical electrical axis position, RIIImax - right electrical axis deviation.
33
2.Find the lead which defines low, approximately equal R-waves and S-waves. EA will be perpendicular to the lead.
3.If the largest equal amplitude of R-waves is approximately determined in two leads, then EA is located in the middle between them.
APPROACH TO ECG ANALYSIS
The best way to analyze the ECG, especially at first, is to systematically look at:
1.Rate and rhythm.
2.Axis.
3.P-wave morphology (size, shape, duration).
4.PQ(R) interval.
5.QRS morphology (size, shape, duration).
6.ST-segment, T-wave, U-wave changes.
7.QT interval.
8.Comparison with the previous tracings, if exist (Do the present findings differ from the previous ECG?).
9.Fill in the ECG-card:
1.Name ______________________________________________
2.Age ________________________________________________
3.Clinical diagnosis _____________________________________
4.The date of examination ________________________________
ECG analysis:
I. Rhythm _____________________________________________
II. The count of waves amplitude and intervals duration:
PI=____ mm; |
PII=____ mm; |
PIII=____ mm; |
PQ=______ sec |
QI=____ mm; |
QII=____ mm; |
QIII=____ mm; |
PII= ______sec |
RI=____ mm; |
RII=____ mm; |
RIII=____ mm; |
QRSII=_____sec |
SI=____ mm; |
SII=____ mm; |
SIII=____ mm; |
QRSTII=_____sec |
ТI=____ mm; |
ТII=____ mm; |
ТIII=____ mm; |
RRII=_____sec |
III. Heart rate (per minute) _______________
IV. Deflection from the norm of ST-segment and T-wave _______
V. The electric systole of the ventricles _____________
VI. ______________
Conclusion: rhythm, heart rate, electric axis position, conductivity change, interpretation of the changes of the waves and ST-segment.

34 |
35 |
CONTROL TASKS AND QUESTIONS
1.Characterize the normal ECG elements (origin, duration, amplitude):
- Р-wave,
- PQ-interval,
- Q, R, S waves; QRS-complex; - ST-segment, Т-wave;
- U-wave.
2.How is Makruz index calculated, what is it used for?
3.How does the segment differ from the interval?
4.Characterize the notion of ―the time of internal deflection of atria and ventricles.
5.What does the electric systole of the ventricles mean? How can you correctly determine the value of QT-interval of a specific patient?
6.Characterize the obligatory leads in ECG recording.
7.How can you determine the heart rate?
8.How can you calculate the angle of the heart electric axis
deviation ( )?
9. What are the ECG signs of the heart electric axis deviation to the
left?
10.What are the ECG signs of the heart electric axis deviation to the right?
11.Analyze the ECG (Fig. 16) according to the following parameters:
1) РI______(mm)____ (sec)
2) PQI interval ____(sec)
3) QRSI____(sec)
4) QI_______(mm)______(sec)
4) ТI _______(mm)_____(sec)
5) QTI interval _____(sec)
6)___________
7)Makruz index I_______; Makruz index III______
8)TIDA, TIDV
Fig. 16. Electrocardiogram for control task No 11.

36
UNIT 1
Theme 2. ATRIAL AND VENTRICULAR HYPERTROPHY. RIGHT AND LEFT BUNDLE (BUNDLE OF HIS)
BRANCHES BLOCK
Goal:
- to get a notion about atrial and ventricular hypertrophy, right and left bundle (bundle of His) branches block; to master skills.
Knowledge objectives:
- to know general ECG-signs of cardiac hypertrophy, signs of atrial and ventricular hypertrophy, the main and accessory ways of the impulse conduction from the sinus node on the atria and ventricles; general signs of disturbance of the impulse conduction in the ventricular conducting system (intraventricular blocks); signs of bundle of His block.
Skill objectives:
- to develop practical skills in analyzing electrocardiogram with signs of hypertrophy of cardiac parts and bundle of His block
EDUCATIONAL MATERIAL
The P Wave
The P wave is due to depolarization of the atrial myocardium, normally initiated by the sinoatrial node situated high up in the right atrium (RA). Normally, both atria are activated so quickly that all of the atrial activation inscribes a single-humped P-wave on the II lead (Fig. 17).
Left atrial (LA) abnormalities occur when delay in LA activation allows separation of RA and LA activation to be seen in some of the ECG leads, manifest as 2 peaks in P-wave in II, III or aVF with > 0.04 sec separating the two peaks or diphasic P-wave in V1 with terminal negative (inverted) portion (Fig. 18).
37
Fig. 17. P-wave form in the norm
LA abnormality (LAA) occurs when a disease process affects the LA more than the RA. Any process that increases the pressure and/or volume of the LV will cause LA hypertension and/or dilatation & LA abnormality. Used to be called the Left Atrial Enlargement (LAE) but changed to LAA with recognition that delay in LA activation can occur without actual enlargement of the LA.
Fig. 18. Left atrial abnormality.
Due to disease affecting RA more than LA the right atrial abnormality (RAA) occurs (Fig. 19). Most common cause of it is Pulmonary Hypertension due to congenital heart disease in children & Lung disease in adults.

38 |
39 |
Fig. 19. Right atrial abnormality.
Since the average direction of spread of excitation is downwards and leftwards, P is usually upright in all three standard limb leads and maximal in II (Fig. 20, a). Occasionally P may be inverted or diphasic in lead III in normal subjects (Fig. 20, b). Inversion of P in leads II and III is indicative of the shift of the pace-making function to a focus low down in the right atrium, the resultant being directed upwards and to the left - so-called "coronary sinus rhythm" (Fig. 20, c). In congenital dextro-cardia excitation is downwards and rightwards, causing P inversion in I and maximum positivity in III (Fig. 20, d).
REMEMBER:
Delay in the left atrial (LA) component results in widened and bifid or dome-shaped P waves most obvious in lead I, II, aVL, the usual cause being LA hypertrophy secondary to mitral stenosis – P-mitrale (Fig. 18, 20 - e & f).
Criteria: two peaks P-wave in I, II, aVL 0,11 sec; biphasic P wave in V1 with predominant negative part.
Fig. 20. P-wave forms
REMEMBER:
RA hypertrophy, by increasing and slightly delaying the RA contribution, causes tall, peaked waves exceeding the maximum normal amplitude of 2.5 mm in lead II (Fig. 19, 21). Since the P wave axis tends to be more vertical than normal, the exaggerated P is usually also well reproduced in III, aVF. The sign is known as P-pulmonale because of its frequent association with pulmonary heart disease but may be due to RA hypertrophy from any cause e.g. tricuspid stenosis.
Criteria: P-wave in II, III, aVF 2,5 mm tall. If biphasic P wave in V1, positive part of P wave predominates.