

Mechanical Properties of Ceramics and Composites
.pdf330 |
Chapter 5 |
G, except for a distinctly higher rate of increase with load for the finest G body at higher load for two passes versus one pass of the diamond tip. Friction coefficients tended to decrease with increasing load, more so for two passes versus one pass, except again for the finest G body, where friction markedly increased with load. Groove widths increased with both load and G, and wear rate initially increased rapidly and then more slowly or not at all as load increased with significant G dependence. The finest G body had the greatest changes in, but the lowest, wear rate, and the two larger G bodies, lower rates of increase (and only at lower loads) with overall higher wear rates, i.e. the intermediate G body had nearly, and the largest G body over, an order of magnitude higher wear rate. Track examination showed that the finest G wear appeared to be mainly plastic deformation to 10 N loads, which then transitioned to mixed plastic deformation and intergranular fracture above 10 N, while the two larger G bodies, especially the largest G body, was mainly controlled by interand transgranular fracture. They noted that their results did not support the concept of material removal by joining of lateral and radial cracks based on indentation fracture and attributed the substantial G dependence to a combination of the G dependence of H and TEA stress effects.
Xu and colleagues [88–90] conducted similar scratch tests, i.e. using a conical diamond tip with an included angle of 120° and a tip radius of 10 m under loads of 10–40 N (i.e. 1–4 kg) on dense sintered Al2O3 bodies of G = 3, 9, 15, 21, and 35 m. They reported scratch hardness values with 10 and 40 N loads decreasing from 25 to 21.5 GPa as G increased from 3 to 9 m, i.e. similar relative changes as found by Wu et al. [82]. Xu et al.’s [89] scratch hardness data for G 15–35 m was presented as then being constant at 21 GPa, but their data would also suggests a possible minimum at 20 GPa at G = 21 m. Though scattered, some their data indicated values 5% lower for 40 versus 10 N loads.
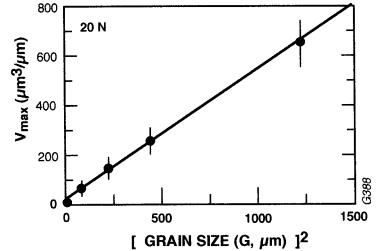
The scratch wear track results of Xu and colleagues [88–90] generally corroborate and extend those of Wu et al. [82], e.g. increasing intergranular microfracture as G increases, and provide very useful additional information, e.g. showing slip or twin bands, or both, involved in both the wear track forming process and the microfracture process. They showed that for single scratches the volume of removed material increased as the square of G (Fig. 5.15), and that the net volume of material removed in sequentially forming two parallel scratches was distinctly dependent on G. This G dependence resulted from, first, the extent of lateral damage due to cracking increasing as G increased due to its increasingly extending beyond the width of the indenter diameter at the specimen surface and, secondly, the interactions of this lateral cracking as a function of the separation of two parallel scratches. Thus they clearly showed that there were critical scratch separation distances for the onset and maximum of interaction to enhance material removal by microfacture that increased with both load and G. They showed that the scratch separation for the onset of inter-
Grain Dependence of Comprehensive Strength, Wear |
331 |
FIGURE 5.15 Plot of the volume material removed versus the grain size (G) squared for dense sintered alumina bodies with a 20 N load on the scratch indenter tip. (Data from Ref. 90, published with the permission of the Journal of the American Ceramic Society.)
action was 3+ times G and that for maximum interaction was 2- times at a 20 N load, with the scratch separations for these interactions increasing linearly with grain size (Fig. 5.16). (The G multiples are not totally constant for the onset and maximum interaction, since the plots of scratch separations for these interaction stages versus G do not go through the origin.) The material volume removed increased not only as the square of G (Fig. 5.15) but also as the square of the load. Thus progressively less material is removed as the scratches start to and then fully overlap. However, they also showed that the volume removed also increased linearly as the number of repeat scratches in the same track increases, but with the rate of increase again being a significant function of both load and G.
Rice [91] summarized many of the known and expected effects of microstructure, especially G, on ceramic wear, noting for example that grain size effects on wear can arise not only from the size of the surface indentation relative to G and the subsequent motion of the indenter across grain boundaries but also from the depth of penetration into the grain. The probable role of EA and TEA on wear were noted, and that of the transition of fracture energy and toughness from polycrystalline to single crystal or grain boundary values (Fig. 2.15) has been previously noted [92], as has the greater influence of TEA (and probably EA) as the crack size approaches G [93]. Xu et al. [89] also noted probable

332 |
Chapter 5 |
FIGURE 5.16 Plot of the separation (d) of two parallel scratches on the surfaces of a dense sintered alumina for enhanced removal as a function of the grain sizes of the alumina. Vertical bars are standard deviations. Note the constant multiple of separation for initiation and maximum of enhanced removal due to scratch interactions, and that the curves do not go through the origin. (Data from Ref. 90, published with the permission of the Journal of Materials Science.)
contributions of TEA to their alumina wear results and cited them as a reason that use of substantially lower fracture toughness values may be more appropriate than normal polycrystalline values.
Diamond POD tests (2 kg load) of fibrous grain structures and their orientation effects were conducted by Wu [94] on the same jade samples discussed earlier (Table 2.3). The Guatemalan jadeite with the lowest toughness of 3 MPa·m1/2, coarser G (dia. 40 m with an aspect ratio of 2), and random grains had the smallest width ( 64 m) and cross section of the track from the diamond, but subsurface crack damage often extended to twice the track width.
Grain Dependence of Comprehensive Strength, Wear |
333 |
The Siberian hornblende with somewhat higher toughness ( 3.5 MPa·m1/2) and finer G ( 5 m with an aspect ratio of 10) with random grain orientation hadtwice the track cross section and 20% greater track width, but with a similar extent of subsurface crack damage. The LB hornblende with finer G ( 1 m dia with an aspect ratio of 50), substantial orientation, and associated toughness anisotropy ranging from 2–5 times the other jades had anisotropic track character. This character was similar for any direction of fibers parallel with the plane of the track, since the diamond tip samples all orientations in the plane of its circular path. This gave track cross sections 2 times those for the jadeite, but track and damage widths the same as for the other hornblende. However, when the fibrous direction was normal to the surface and plane of the track, the second lowest track cross section and track width were obtained, indicating a definite anisotropy of response. An uncertainty in these tests was the hardness values for these materials and a measure of the depth of associated damage below the track (as opposed to the extent of damage near the surface outside of the track). However, these results show a definite anisotropy due to substantial preferred orientation, as might be expected, but pronounced effects of whether damage was much worse for motion normal to the fibers, as might be expected for some fibrous materials, was apparently not observed.
As with other properties, single crystal wear results are an important reference point for grain structure, especially orientation, effects. Though used more in other properties reviewed in previous sections and chapters, there is some data on friction and wear for single crystals beyond that previously cited. Thus, for example, Bowden and Brookes [95] showed that sliding friction on {100} surfaces of LiF, MgO, and diamond was the greatest in <100> and the least in <110> directions, with the extent of the anisotropy increasing as the sharpness of the slider tip increased. This anisotropy was related to the depth of penetration due to increased activation of slip and resultant cracking, especially in LiF and MgO, which was consistent with the frictional anisotropy reflecting the hardness anisotropy (Fig. 4.21 and Tables 4.3 and 4.4), especially as the sharpness of the slider increased. Buckley [96–98] reported friction coefficients for some planes on some single crystals, e.g. on sapphire varying from 0.5 to 1 depending on the surface and direction of motion. Similarly he showed the rate of wear as a function of crystal plane and direction for rutile similar to that of hardness anisotropy, but of much greater amplitude, e.g. peak-to-valley ratios of up to 7 for wear rate.
Turning to polycrystalline results, consider first abrasive wear, e.g. measured by weight loss, of a sample rotated under an abrasive wheel loaded against the sample by a fixed deadweight load so that the abrasive wheel is free to rotate about its axis, which is normal to that of the specimen rotation. This test (a commercial manifestation of which is the Taber Wear Tester) is thus similar to a pin-on-disk test with multiple contacts of the abrasive wheel replacing
334 |
Chapter 5 |
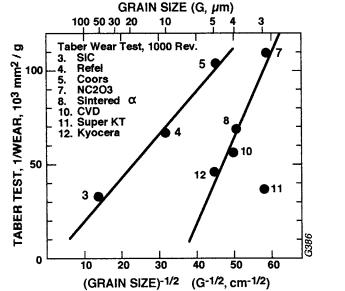
the single contact of the pin against the rotating disk sample. Wu et al. [82] conducted some Taber tests on two bodies of G 1 and 50 m from the same or similar alumina used for their DPOD tests giving a clear increase in wear as G increases and hence decreasing wear resistance as G increases, but at a lower rate than in the DPOD tests (Fig. 5.10). However, again note larger G polycrystalline results below those for single crystals. Taber testing of the same SiC specimens from the DPOD tests (Fig. 5.11) resulted in a separation of the data into two groups, one of RBSC specimens that had larger G, Si second phase, higher wear rates for a given G, and a lower slope versus G-1/2, and the other sintered or hot pressed SiC with finer G, lower wear rates at a given G, and a higher slope versus G-1/2 (Fig. 5.17).
FIGURE 5.17 Wear rate (i.e. inverse of wear weight loss per unit wear area) versus the inverse square root of grain size for Taber wear tests of various RBSC and sintered and hot pressed SiC bodies, the same ones as were shown in Fig. 5.11. Note that this wear test separates the bodies into two groups, one of RBSC with more wear and a lower slope versus G -1/2 and the other the sintered and hot pressed bodies with a higher slope versus G -1/2, but displaced to the right, i.e. to lower wear. (From Ref. 84, published with the permission of Ceramic Engineering and Science Proceedings.)
Grain Dependence of Comprehensive Strength, Wear |
335 |
B.Grain Dependence of Sliding and Related Wear
Turning to predominately sliding wear, Cho et al. [99] conducted some pin-on- disk tests of three of the same or similar Al2O3 bodies used by Xu and colleagues where the “pin” was a 12 mm diameter Si3N4 ball (rather than a rod with a spherical end) rotated at 100 rpm under a load of 450 N with paraffin oil lubricant. The widths of the resultant wear track used as a measure of the wear as a function of test time showed an incubation period of low wear for all samples and then a change to a much more rapid wear rate that began at a specific time for each body, with the time varying inversely with G, i.e. the time for onset of more rapid wear increasing substantially as G decreased. They observed corresponding wear track development as being only smooth striations before significant wear onset and microfracture, mostly intergranular after the onset of increased wear. The occurrence of plastic deformation was confirmed by TEM showing “severe accumulation of dislocation pileups and twins with strong crystallographic features, characteristic of abrasion damage in ceramics.” They presented a model based on TEA stresses and resultant cracking for their observed G dependence of the onset of significant wear, predicting a dependence close to, but not exactly of, a Hall–Petch form. Liu and Fine [100] also modeled their data based on microcracking from TEA stresses, with similar agreement between their model and the data. However, neither group addressed the issue of whether such wear behavior is unique to noncubic materials, as might be implied by a direct dependence on TEA.
Gahr et al. [101] studied unlubricated sliding and oscillating wear using a hollow cylinder whose outer surface was rotated against a thin block, or oscillated over a plate, of the same ceramic, using respectively a 10 N load and a speed of 0.8 m/s and a 100 N load and a speed of 0.02 m/s at 20 Hz. Both a dense sintered, pure alumina (G 0.8–12 m) and three mol% Y TZP (G 0.3–2m were used. Both H and KIC were measured (10 N load) showing H decreasing from 19.5 to 16 GPa for Al2O3 and 13.8 to 12 GPa for the TZP as G increased, and KIC increasing with G and then being constant at higher G, i.e. respectively from 3.7 to 4.1 MPa·m1/2 by G 4 m and 5 for Al2O3 to nearly 10 MPa·m1/2 by G 1.2 m for ZrO2. They also showed that surface roughness was low and constant over the limited G range for the TZP, and for the alumina started from the levels achieved for TZP ( 0.1+ m) at fine G but increased to 0.7 m at G12 m. They showed that the unidirectional sliding coefficient of friction for the alumina was nearly independent of G at 1, while that for the TZP increased from 0.5 at the finest G to 1 by G = 0.6–0.8 m and constant beyond. For unidirectional sliding the wear resistance of both the alumina and the TZP varied as G-1/2, with that for TZP being over an order of magnitude lower, but for reciprocating sliding the G dependences were respectively G-2 and G-1/3, so the larger G wear rates for the alumina were about the same as for the TZP. Their examina-
336 Chapter 5
tion of the wear tracks showed the same general trend, namely more plastic flow at finer G and more intergranular fracture as G increased, especially in alumina over its larger G range. Their results clearly showed there is no correlation of their indent KIC values and wear results.
He et al. [102] conducted similar pin-on-disk tests of fine grain Y-TZP using a 4 mm diameter SiC ball under a load of 8 N oscillated over the surface at 810-2m/s in dry N2. They found that wear decreased linearly with G-1/2 to G = 0.7m and then transitioned to a higher rate of wear, varying as G-1 for G > 0.9 m. The higher wear regime was characterized by delamination, accompanying grain pullout, and transformation to monoclinic ZrO2.
While the above results all show substantial decrease in wear as G decreases, there are tests showing opposite trends. Thus Xiong et al. [103] used a pin-on-disk test of Al2O3 disks and pins with G = 4, 8, or 12 m with a 10 N load on the pin as the disk was rotated or oscillated at 1000 rpm and 1 m/s in air. A key difference was that they used flat rather than rounded pin tips. Their wear rates (based on weight loss) for both the disk and the pin of the same G clearly showed wear of both linearly decreasing as G increased, e.g. by 3/4 from G = 4 to G = 14 m, i.e. opposite of the G dependence in other tests. They reported that the wear surfaces of the finer G test samples showed severe damage manifested as extensive intergranular fracture and substantial debris, while the largest G samples showed some intergranular fracture but no wear debris. They suggested that the opposite G dependence from that normally found versus that of their tests resulted from the use of a flat pin generating more debris at finer G that could not be removed because of the flat versus normal rounded pin tip.
There is other evidence for an opposite dependence of wear on G, i.e. for wear to increase rather than decrease as G decreases. A more detailed study of this is the wear of Ni-Zn ferrite head materials due to the passage of CrO2 or Fe2O3 recording tapes over them. Thus Kehr et al. [104] showed that the amount of ferrite wear decreased by 10–20% as G increased from 3+ to 39 m for both tapes, but with about threefold higher absolute wear levels for the CrO2 tape. The wear trends for as-machined or annealed (1 hr in air at 900°C) ferrite surfaces were the same, though there was a trend for the machined surfaces to have somewhat lower wear, at least against the Fe2O3, as expected from probable work hardening of such surfaces. This trend for less wear at larger G occurred with a small reduction in porosity from 0.3 to 0.1%, but this was not seen as sufficient to explain the difference (though there may be an effect of incorporating pores within grains with grain growth on wear behavior, as is noted below). That the amount of porosity decreased by itself is not sufficient to explain the increase in wear with increased G, but it is consistent with normal decreases in both hardness and flexure strength as G increases (both linearly versus G , with somewhat higher strengths for annealed versus machined
Grain Dependence of Comprehensive Strength, Wear |
337 |
samples). Note, however, that similar ferrites also showed more transgranular fracture with SCG and more intergranular fracture in fast fracture than most materials (Chap. 2, Sec. III.B).
There is further precedence for wear apparently decreasing as G increases in various industrial wear tests and applications, at least of alumina bodies [105]. For example, many 99% commercial alumina products are sintered with MgO additions to control grain size (e.g. to 8 m) to give better mechanical performance, including wear resistance for various applications. However, for some wear applications, better performance is found by leaving out the MgO, which about doubles the grain size from the same or similar firing with MgO additions. The resulting larger grain bodies of very similar density as those sintered with MgO gives better wear resistance in some tests (e.g. rotating specimens in a wa- ter–sand slurry) and applications but worse performance than its finer grain counterpart in other applications and tests, e.g. of grit blast resistance. It has been suggested that the better performance of the larger G bodies may reflect probable increased intraversus intergranular pores, but these results are a clear indication of the complexities of microstructural interactions in wear, i.e. similar to those, but possibly even more complex than, for other properties, and the need for more comprehensive testing and characterization. It should also be noted that such industrial tests also generally show many of the wear and erosion trends indicated earlier, e.g. the common superiority of Si3N4 (and some toughened bodies, Chap. 10, Sec. III.C).
Another important mode of wear behavior is rolling contact fatigue (RCF), since this is the method of selecting ceramics for ball and roller bearing applications. In such tests a ceramic rod with a high-quality, bearing grade surface finish is rotated at high speed while held between three balls in a plane normal to the rod axis with high contact pressures between the balls and the rod. In such tests and applications what is sought are materials and finishes that result in noncatastrophic failure with long incubation times for formation of small local spalls which can in turn lead to more serious damage and vibration. There has apparently not been any study of G dependence in Si3N4, which dominates the ceramic bearing field, in part since G commonly does not vary widely in Si3N4, and, though no clear correlation apparently exists, generally finer G bodies are common in this application. However, Rice and Wu [85] conducted limited RCF tests on four ZrO2 materials, a PSZ single crystal, and three polycrystalline TZP bodies. Despite some limited porosity in the latter, they all showed longer RCF lives than the single crystal, indicating better performance with finer G, especially at the finest G ( 0.25 m), where the life was over an order of magnitude higher. Failure was by spalling, which in the polycrystalline bodies was typically from larger, mostly isolated, pores or pore clusters, indicating further potential advantage of G with improved body quality, especially less and smaller pores.

338 |
Chapter 5 |
FIGURE 5.18 Difficulty of sawing with a standard commercial diamond blade with a fixed horizontal force moving the specimen into the blade versus the inverse square root of the grain size for the three ceramics shown. The correlation coefficients were reported to be 0.99, 0.98, and 0.6 for B4C, Al2O3, and MgO respectively. (From Ref. 106, published with the permission of the Journal of the American Ceramic Society.)
VI. GRAIN DEPENDENCE OF MACHINING RATES AND EFFECTS
While the preceding sections reviewed material removal and damage by erosion and wear, there is also interest in and need for documenting and understanding corresponding grain effects on machining of ceramics. However, while there is common interest in limiting the extent of surface damage in both cases, it is desired to have higher machining rates rather than lower ones as typically sought with wear and erosion. Clearly both fixed and free abrasive machining involve similar basic mechanisms found in erosion and wear, so the topics are related.
Rice and Speronello [106] made a fairly comprehensive study of the rate

Grain Dependence of Comprehensive Strength, Wear |
339 |
of diamond sawing and of diamond grinding of various ceramics and grain sizes under a fixed horizontal force driving the work piece into the saw blade or grinding wheel. Thus they measured the times to saw through a given area or remove a given volume of material using commercial diamond blades and grinding wheels respectively. Their sawing tests for 12 ceramics (six with reasonable to substantial G range) and grinding tests of seven of these ceramics (three with reasonable to substantial G range) clearly showed that the difficulty of machining (i.e. the reciprocal of the sawing or grinding rate) was a linear function of G-1/2 (Fig. 5.18). They further showed that more extensive sawing data correlated with representative Vickers hardnesses of the ceramics (i.e. an average value for each material neglecting G dependence) whether the slope of the inverse sawing rate versus G-1/2 plot was used or the sawing difficulty at a fixed G was used (Fig. 5.19).
FIGURE 5.19 Plot of the slope of the sawing difficulty versus G-1/2 slope (left scale) and the actual sawing difficulty at a fixed G (50 m here), versus representative Vickers hardnesses showing a correlation of sawing and hardness (e.g. correlation coefficients of 0.91 to 0.95). (From Ref. 106, published with the permission of the Journal of the American Ceramic Society.)