

Mechanical Properties of Ceramics and Composites
.pdf300 |
Chapter 5 |
FIGURE 5.1 Compressive strength versus G -1/2 for ZrB2 [19], TiB2 [19,20], and WC + 10 w/o CoO [23], and cubic BN (cBN) [24] at 22°C. Note the high strength levels relative to those for tensile strength, and that despite these values being low relative to theoretical expectations, they clearly show substantial G dependence; also that some data points reflect more than one test, e.g 5 for cubic BN. (From Ref. 3, published with the permission of Plenum Press.)
SiC was reported to be > 3 GPa for G = 5–10 m [21], but more recent tests of pure hot pressed TiB2, G 10 m, giving σc = 5.7 ± 0.2 GPa, are seen as closely approaching the theoretical compressive strength [14,15,22]. Theoretical compressive strength is commonly taken as E/10 or H/3, the former not being load dependent, but not reflecting any G dependence, which is at least partly reflected in H/3 (where H should probably be at higher loads where there is little load dependence, but not reflecting surface cracking effects).
Data for WC + 11 w/o Co with little or no porosity reported by Exner and Gurland [23] shows very similar G dependence, but at somewhat higher σc levels. Data of Tracy and colleagues [14,15,22] for hot pressed (G 1 m and sintered ( 4 G m) SiC also indicates some G dependence, since the former had σc
Grain Dependence of Comprehensive Strength, Wear |
301 |
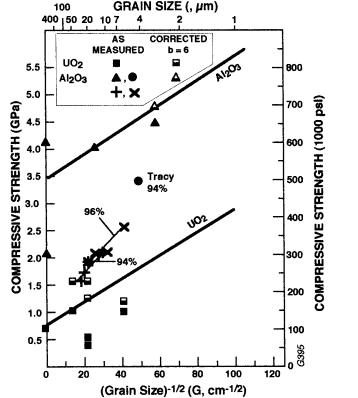
FIGURE 5.2 Compressive strength versus G -1/2 for 94% alumina [4,26], higher purity aluminas [3], and sapphire (stressed perpendicular and parallel with the c- axis) [27], and from a more recent test a commercial 94% alumina [22,28], along with data for UO2 polycrystals [30] and single crystals [31] at 22°C.
6.3 and the latter 4.6 GPa, though respective percent porosities of 1–2 and 3–4 are a factor in this difference. Data of Vereshchagin et al. [24] on cubic BN is limited but clearly indicates a Petch relation. B4C data of Osipov et al. [25] shows similar behavior but is bilinear, i.e. very similar to their tensile strength behavior (Fig. 3.1) but with higher slopes and compressive strengths 3 times tensile strengths. The bilinear character and low multiple of compressive versus tensile strength are consistent, i.e. serious parasitic tensile stresses are the likely source of both, as are the lower strength levels and scatter in much of the other compressive strength data.
302 |
Chapter 5 |
There is more extensive data for Al2O3. Earlier data of Floyd [4,26] for commercial 94 and 96% alumina bodies, both as-produced and with added heat treatment to increase G (which also decreased density some) clearly showed a G dependence of their compressive strengths that closely paralleled that of their H. Strengths were somewhat higher for 96 versus 94% alumina as expected, and Floyd’s tests on the same bodies in flexure clearly showed less G dependence of tensile versus compressive strengths (especially for tensile strengths of the finer G branch, Chap. 3), which is also shown by comparing the G dependence of both strengths for other ceramics). More limited data on mostly purer, e.g. 99.9% alumina bodies, gives higher strengths, which are approached when the 94 and 96% alumina bodies’ strengths are corrected for limited porosity and silicate-based glass content. Tests of Tracy et al. [22,28] on 94% alumina are seen as closely approaching the theoretical compressive strength (again taken as H/3 or E/10 as noted earlier) for such a body of 3.4 ± 0.2 GPa. These higher strengths are also consistent with their probable extrapolation between the compressive failure stresses of 4.2 and 2.1 GPa for sapphire tested respectively with the stress axis parallel and normal to the c-axis [27]. Castaing et al. [29] showed apparent yield of sapphire at compressive stresses of 6 GPa normal to the c-axis with 1.5 GPa confining pressure and a strain rate of 2 10-5/s but noted that this was due to delayed fracture from creep rupture at 25°C, not dislocation glide till test temperatures ≥ 200°C.
The limited compressive strength data for ThO2 of Knudsen [32] and of Curtis and Johnson [33] corrected for porosity shows a substantial linear trend as a function of G-1/2 and a substantial extrapolation of 1.4 GPa at G-1/2 = 0 [3]. Similarly, UO2 data of Burdick and Parker [30] and Igata et al. [31] extrapolates to 0.7 GPa at G = 0, consistent with Igata et al.’s compressive strength of0.7 GPa for UO2 crystals. The implication of plastic flow in compressive failure by the extrapolation of polycrystalline compressive strengths to those of single crystals is reinforced by observation of slip in UO2 by Yust and Hargue [34]. Paterson and Weaver [35] measured compressive strengths of three MgO bodies of G (1) 10–15 m (P 0), hot pressed with 3% LiF and then annealed at 1300°C, (2) 30 m, isopressed and sintered at 1700°C, P = 0.03, and (3) 300–500 m, core drilled from skull melted ingots. Recognizing that their finest G body had lower strength (attributed to residue from the LIF addition) than their two remaining data points for the intermediate and large grains showed some measurable decrease in σC as G increased, and on extrapolation to G = ∞. The latter is consistent with it being the yield stress for single crystals stressed in the <111> direction, i.e. 0.4 GPa versus that for <100> stressing 0.15 GPa of Copley and Pask [36].
Paterson and Weaver [35] also measured compressive strengths of the same three above MgO bodies at 22°C, but with superimposed hydrostatic pressure (Fig. 5.3). They used two different types of rubber jackets to prevent fluid

Grain Dependence of Comprehensive Strength, Wear |
303 |
FIGURE 5.3 Compressive strength of MgO versus G-1/2 at 22°C with superimposed hydrostatic compressive stresses of 0 (i.e. none), 0.2, 0.5, 0.8, and 1 GPa from Paterson and Weaver [35] and Auten and Radcliffe [37] along with single crystal yield stresses (hence compressive strengths) of Copley and Pask [36] for <100> and <111> stress axes.
intrusion into cracks, with some differing effects of the two jacket materials. All tests with the application of such pressure showed higher G dependence of σC, with higher values for extrapolation to G = ∞ for the two highest confining pressures. (Note that the finer G specimens, those made with LiF, are much more consistent with values for the other bodies made without LiF in contrast to tests with no confining pressure.) Auten and Radcliffe [37] also measured compressive strengths of one polycrystalline MgO material (G 30 m) prepared very similarly to that of Paterson and Weaver’s intermediate G body, but conducted their tests without a rubber jacket on the samples. As shown in Fig. 5.3,

304 |
Chapter 5 |
FIGURE 5.4 Compressive strength and hardness, HV(9.8 N) at 22°C for dense (< 3% porosity) AlN sintered with different amounts and types of oxide sintering aids [43]. Note that compressive tests used dumbbell specimens after Tracy and were conducted at three strain rates (the highest and lowest rates are shown) with all showing strength increasing as G decreased and strain rate increased. Also note the similar trend for hardness and its being 3 times compressive strength.
their results showed very similar trends with confining pressure but were somewhat higher in fracture or yield stress.
Extrapolation of the polycrystalline data to G = ∞ falls between the values of Copley and Pask [36] for MgO single crystals stressed in <100> and <111> directions but closer to the substantially higher value for yield/fracture in the <111> direction as expected. Both Weaver and Patterson [38] and Auten et al. [39] measured compressive strengths of MgO single crystals at 22°C along <100> loading axes as a function of confining pressure using respectively rubber jackets and no jackets. Both obtained compressive strengths with substantial sin-
Grain Dependence of Comprehensive Strength, Wear |
305 |
gle crystal deformation. Patterson and Weaver’s values for jacketed samples were 120 MPa without confining pressure and increasing, mostly modestly, with increasing pressure. Auten et al.’s values for unjacketed samples were 80 MPa without confining pressure and decreased modestly with increasing pressure. However, the averages of these two sets of tests were independent of confining pressure and agreed fairly well with values of Copley and Pask. (Auten et al. noted that a probable reason for their lower results was surface cracking and resultant loss of surface chips without jackets versus such cracking and especially loss of surface chips being constrained with jackets on the specimens.)
Limited data of Brace [3,40,41] for nominally single phase limestone (CaCO3) and dolomite (CaCO3 + MgCO3) follows a G-1/2 dependence and parallels his data for high load hardness (both using the maximum rather than the average G (Fig. 4.14) [3]. Fredrich and Evans [42], besides reviewing the limited compressive data and models for rocks as a function of G (generally showing Petch-type behavior), also presented their own data for four marble limestones with G from 6–1800 m, which also clearly followed a Petch relation. They further showed that tests with confining pressures of 5 or 10 MPa resulted in essentially the same relation, except for a possible upward shift of the data by a few percent as the confining pressure increased.
Finally consider more recent AlN data of Rafaniello [43], which over a limited G range ( 2+ to 12 m) showed a substantial decrease with increasing G consistent with a G-1/2 dependence (Fig. 5.4). Note that compressive strength increased with increasing strain rate, which was corroborated by tests at 0.6 sec-1 being in between the two sets of results in Fig. 5.4 but closer to those for the lowest strain rate.
B.Other Microstructural and Testing Effects, H Correlation, and Failure Mechanisms
No data specifically on effects of grain shape or orientation on compressive strength is known. However, the correlation of σC and H, and the substantial data on the dependence of H on crystal orientation, provide guidance, as does limited data on effects of grain shape on indentation fracture (Chap. 4, Sec. II.E). There is also limited single crystal data, e.g. that for sapphire compressively stressed parallel or normal to the c-axis (Fig. 5.2). There are also some theoretical estimates of some, e.g. diamond structure, crystals that provide some guidance, such as that of Nelson and Rouff [44] predicting theoretical strengths of diamond of 1.8 GPa for [100] loading and 4.1–4.8 GPa for [111] loading.
The first of two important loading parameters not addressed in the above review is strain rate. The limited data has been reviewed by Lankford [45,46] along with presenting his own data for sintered, nearly dense SiC (G 3 m) and dense sintered Al2O3 (G ~ 25 m). He showed that there was an 30% increase
306 |
Chapter 5 |
in compressive failure strength of Al2O3 over the strain rate range of 10-5 to > 102 sec-1, while there was none for SiC. He observed that in both materials microcrack nucleation appeared to be athermal. While strain rate effects on slip and probably twin deformation are typically thermally activated, this may not always be true at high strain rates, so further study is needed. Lankford also showed a marked rate of increase in compressive strengths at strain rates > 102 sec-1 indicating a fundamental change in mechanism for both materials for which there is some theoretical basis in inertial effects on crack initiation and propagation. He noted that extrapolation of the high strain rate increase in compressive strengths indicates reaching theoretical strengths ( E/10) at rates of ≥ 106 sec-1.
The issue of loading rate also raises the issue of possible environmental effects, especially of slow crack growth, particularly due to moisture. Lankford [10] reported that the strain rate dependence of the compressive strength in his testing of (Lucalox) Al2O3 corresponded to n values for slow crack growth for tensile strength, i.e. values of 50 (hence implying a G dependence per Fig. 2.7A). He subsequently noted similar correspondence of compressive and tensile slow crack growth in SiC and Si3N4, but not in Mg PSZ [12]. Similarly Nash [47] reported that a 97.5% and a 99.7% alumina (both noted as having average G of a few microns) showed reductions of σC from respectively 1.7 and 2.2 GPa to1.2 and 1.5–1.7 GPa in air and Ringer’s solution (and other water-based solutions for the 99.7 body) in testing at a strain rate of 0.55 10-3/sec. However, Ewart and Suresh [48] ruled out environmental effects in their studies of compressive fatigue crack propagation in Al2O3.
While slow crack growth must be considered in view of the local nucleation, growth, and coalescence of microcracks under local tensile stresses, there are two sets of issues that raise serious questions about such growth in true compressive failure. The first is the uncertainties in n values in crack propagation under macro tensile stresses, in particular the indicated significant G dependence (Fig. 2.7A). This for example raises the question of whether there is a similar G dependence in compression and whether the tensile n values used for comparison have sufficiently similar G values for adequate comparison. The second and more fundamental question is that of the extent and time of environmental access to the crack tips. While crack propagation of a single surface connected crack allows ready access of the test environment to the crack tip, in well conducted tests, compressive failure is seen as a process of cumulative nucleation, growth, and coalescence of microcracks throughout the bulk of the sample. Thus over much of this process many, probably most, microcracks are not accessible by the environment over much of the stage of the compressive failure process. This raises the question of how effective the environment can be in the probably limited portion of the failure process during which it has considerable access into the sample and the crack tips. On the other hand, in less well conducted compressive tests, local tensile stresses, e.g. often from end constraints, commonly
Grain Dependence of Comprehensive Strength, Wear |
307 |
result in “compressive” failure due to propagation of one or a few surface connected cracks. Clearly both the surface connected and commonly resultant macro nature of these cracks and their dependence on substantial parasitic tensile stresses provide much more opportunity for environmental effects on their growth and the resultant reduced “compressive” strength. This probable role of such surface connected cracks also raises the issue of whether there is a specimen size effect on compressive failure, since many microcracks appear to form at the surface, which could allow them to grow preferentially in from the surface. Thus what might start as a true compressive failure could become dominated by cracks propagating in from the surface, but with this being increasingly favored as specimen size decreases. This basic issue of the extent of intrinsic versus extrinsic environmental effects on compressive failure is an important scientific issue. However, it is also potentially a very important one in the engineering design of ceramic components for substantial compressive loading, since such loading is likely to be plagued by more parasitic tensile stresses than in most compressive testing. Another complication in considering environmental effects on compressive strength is the possibility that the fluids involved may act as lubricants in addition to, or instead of, environmental effects, since crack friction is seen as playing an important role in compressive strengths.
The second stressing aspect to consider is repeated loading, i.e. compressive fatigue. While this has been studied substantially less than tensile fatigue (with very limited attention to grain effects in both), there is some limited guidance mainly in a review by Suresh [49] and especially tests by Ewart and Suresh [48]. They studied cyclical fatigue crack growth from machined notches in two high-purity Al2O3 bodies (AD 995 and 999 with respective G of18 and 3 m) and one orientation of sapphire. The latter resulted in no stable crack propagation, while the two polycrystalline bodies showed similar overall crack growth characteristics, but the finer G material required 50% higher compressive stress for stable crack propagation, i.e. consistent with higher compressive strengths at finer G. (Note that they observed an enhanced extent of crack propagation near the machined surfaces pertinent to the issue of surface and related finishing effects on crack propagation discussed in Chap. 2, Sec. III.B.) The absence of stable crack propagation in sapphire versus stable propagation in the polycrystalline bodies via almost exclusively intergranular fracture shows that such crack propagation in polycrystalline bodies is clearly associated with grain boundaries, and it further questions conventional slow crack growth (which occurs with tensile loading in sapphire, Chap. 2, Sec. III.B) in compressive loading. They concluded that large compressive stresses induce inelastic deformation in the vicinity of notch roots that can result in residual tensile stresses at the notch tip due to permanent strains left upon unloading. They saw their results as not necessarily being consistent with microplasticity as a mechanism of compressive failure and saw probable

308 |
Chapter 5 |
contributions of TEA stress and crack face friction effects (but did not consider possible effects of EA).
Before considering mechanisms and correlations, consider variations in compressive strength values. Though almost never, or never, used, Weibull moduli are as pertinent to compressive as to tensile strengths (as they are not only to other mechanical and nonmechanical properties but also to microstructural parameters such as grain size, shape, and orientation). While Weibull moduli (m) values have not been directly measured, compressive strength data of Tracy and colleagues [15,22], besides generally being the most free of serious parasitic stresses, also commonly made several, typically 10, measurements for each material, thus providing reasonable data to calculate m values via Eq. (3.4). As shown in Table 5.1, Weibull moduli calculated for σC (mC) roughly follow trends for tensile moduli (mT) they directly measured for flexural strengths, σT, but with mC > mT by 40–400%. While 10 tests per material is a limited data base on which to calculate m values, the consistency of mC being > mT, and the fact that higher mC than mT values were found across six materials indicates a trend that is highly probable. The higher moduli in compressive failure are consistent with expectations of Weibull moduli being less sensitive to microstructural heterogeneities in compressive loading than in tensile loading, but the differences may be limited by the greater G dependence of σC versus that of σT.
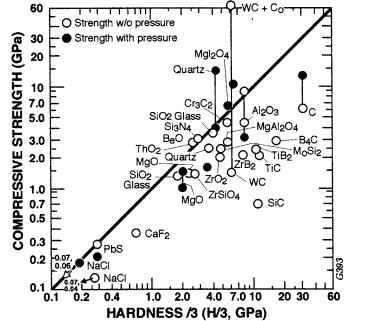
Consider now the correlation of hardness and compressive strength. Rice, in his review of ceramic compressive strength [3], showed that it correlated with hardness, i.e. the upper limit was typically H/3 (Fig. 5.5), though other constraint factors than three may occur, as also discussed by Lankford [5]. Deviations below this limit were attributed to, roughly in order of decreasing scope, impact, or both, (1) frequent and often substantial parasitic stresses in testing, (2) material defects and heterogeneity, and (3) other, lower stress mechanisms of failure, e.g. twinning. Lankford accepted this H correlation and further documented and extended it. A summary of results shown in Fig. 5.6 clearly shows that (1) more recent results from generally better conducted tests, often with denser specimens,
TABLE 5.1 Comparison of Weibull Moduli for Flexure (Tensile, mT) and Compressive (mc) Failure of Ceramicsa
Material |
mT |
mc |
Material |
mT |
mc |
|
|
|
|
|
|
Al2O3 (94%) |
— |
|
SiC-S |
10.8 |
14 |
TiB2-HP |
29 |
41 |
SiC-HP |
9.6 |
31 |
B4C-HP |
5.2 |
18 |
Al2O3/SiCw |
5.1 |
25 |
|
|
|
|
|
|
amT values measured in studies published by Tracy and colleagues [15,22], while mc values were calculated from their compressive strength data per Eq. (3.4). HP = hot pressed, S = sintered, and SiCw = a SiC whisker composite.
Grain Dependence of Comprehensive Strength, Wear |
309 |
FIGURE 5.5 Compressive strength versus H/3 for various ceramics from a survey of Rice (previously unpublished) from a variety of sources, including Patterson and Weaver [35] (circular points).
give a generally closer approach of σC to H/3, and that (2) data for bodies tested with superimposed hydrostatic loads commonly equal or exceed H/3 as the hydrostatic pressure increases. Data of Bairamashvili et al. [51] on hot pressed B4C, B6O, and SiB4 with P 0.1–0.04 and G 1–3 m may also support the H–σC correlation, since it appears that their σC values may be shown as 10 times their true value. If this is the case, their respective values of σC for the above respective order for the materials versus those of the corresponding H/3 values (in parentheses for H with 1–2 N load) are 7.9 (11.7), 6.3 (10.7), and 5.0 (9.0). This correlation of σC with H/3 and the typical association of H/3 with the general yield stress of a material is a strong indicator of yielding as a basic mechanism controlling compressive strength in well conducted tests of samples of reasonable to good quality.
The σC–H correlation is quite suggestive, but it does not fully prove a microplastic mechanism of failure (discussed further below.) Thus the correlation with H may reflect more basic correlations with elastic moduli in general [1,2], and shear modulus specifically, e.g the theoretical compressive strength limit