

Mechanical Properties of Ceramics and Composites
.pdf320 |
Chapter 5 |
did not attempt any correlations of erosion with the grain structure, which progressed from the above two finer G bodies to ones of 17, 22, and 38 m (the latter reflecting a bimodal grain structure averaging 8 and 60 m). In further analysis of their data for indications of a G dependence, this author found none for the slopes of their V–U curves or of their toughness values but did find a definite correlation of their calculated m values and G. Thus their m values progressively decreased from 0.33 at the largest average G to values of 0.28 and 0.22 for G 22 and 17 m respectively, and m = 0.16 and 0.08 respectively at G 2 and4 m. The lowest m value at G 4 m might suggest a minimum, but this low value likely reflects the impact of the 10% glass content of the 90% alumina body. The exact meaning of the above correlation is uncertain, but it clearly serves as a reminder that neglect of grain structure in analysis of data can be a serious limitation on understanding. Routbort and Matzke [66] similarly noted apparent failure of available models to reflect accurately the microstructural effects in their study of erosion of various SiC bodies.
The above study of Wiederhorn and Hockey, which includes data for sapphire specimens, illustrates the value of single crystal tests in general and especially for studying effects of grain structure. Data of mainly Rickerby and Macmillan [67,68] provides useful detailed studies of MgO crystal erosion. Unfortunately there is limited direct comparison of these studies with their study of a polycrystalline MgO body [69], though some differences are indicated, but their crystal data provides a basis for future comparisons. Similarly, data of Schoun and Subramanian [70] on single crystals of LiF, NaCl, KCl, and CaF2 and of Routbort et al. [71] on crystals of Si provide an opportunity for comparison to polycrystalline erosion and hence added insight into effects of grain structure.
Consider now the effects of erosion of ceramic surfaces on the resultant strengths of the eroded specimens tested with the eroded surface as the tensile surface in uniaxial or biaxial flexure (the latter for disk or plate samples). Ritter [72,73] has evaluated the residual strength after erosion of the same five commercial alumina bodies studied by Breder and Giannakopoulos [65], apparently using the same apparatus, SiC abrasive particle sizes, and velocity range. Biaxial flexure strengths of eroded and uneroded specimens, the latter with Vickers indents, mainly with 100 N loads, showed that large grain size bodies gave rise to crack resistance and resultant increased resistance to indent and erosion induced strength loss. This was based on using a similar analysis to that of Breder and Giannakopoulos to allow for variable toughness, but in an equation predicting residual strength rather than erosion rates based on the same underlying inden- tation–crack concepts giving higher m values, since m correlated very similarly for both indented and eroded strengths as for the erosion rate, as noted earlier. However, the actual strengths of both indented and eroded disks were highest at intermediate G ( 17 m), not at the maximum G, i.e. clearly differing from
Grain Dependence of Comprehensive Strength, Wear |
321 |
both the normal σT–G trend (Fig. 3.1) and the predicted strength trend. Further confusion arises since Breder and Giannakopoulos concluded that R-curve effects were not operative in the erosion of these alumina bodies under the same test conditions. Whether enhanced material removal occurs when the impact crater is G is unknown. Similar comparison was made using three commercial Si3N4 bodies [74], which, though more limited in the range of finer G values and complicated by bimodal grain structures, showed a similar trend for m to increase with G at finer G.
Besides the obvious very limited data on, and especially attention to, G effects on erosion and resultant strengths, there are two sets of issues that need to be noted for further attention. The first set is microstructural, i.e. not only G, but its variations along with grain shape and orientation. While the effects of G have been barely addressed, the other grain parameters have not been addressed at all. As for other properties, single crystal data provides insight to the limits of grain orientation effects, but such crystal data is very limited for erosion and apparently nonexistent for residual strengths from erosion.
Turning to other erosion studies, there can be added complexity. For individual particle impacts there may be a material-dependent velocity threshold for the onset of strength reduction [75]. For multiple particle impacts, erosion may not decrease strengths, and in some cases erosion can actually increase strengths. Thus Wada et al. [76] and subsequently Chakraverti and Rice [77,78] showed that abrasive grit blasting can measurably increase resultant strengths of TZP materials. This may be seen as an isolated case due to transformation toughening, which in part it is (e.g. PSZ bodies also show greater erosion resistance relative to their hardness, at least partly correlating with their higher relative toughness). However, Gulden [80] reported that while RBSN eroded with various size and velocity quartz particles had reduced strengths, such erosion of a commercial sintered 95% alumina and especially a commercial hot pressed Si3N4 showed a probable increase in strength. Similarly Laugier [81] eroded surfaces of a sialon, Al2O3 + 4 wt% ZrO2, and an Al2O3 + TiN +TiC cutting tool bodies with Al2O3 grits and then measured fracture toughness via Vickers indents in the as-eroded surfaces and after polishing various depths of material from the eroded surfaces. He reports that all three materials showed substantially increased toughness in the eroded surfaces, e.g. respectively nearly fivefold, about fourfold, and nearly fourfold. However, the increased toughness rapidly diminished as material was removed from the eroded surface, implying that the surface toughening was due to a fairly shallow layer (e.g. 20–40 m) of compressive stress (e.g. from impact generated slip).
In addition to the complications of the absence of strength degradation, or more seriously strength improvements as a result of surface erosion, there are more general issues. These include the transition from a few to many impacts, i.e. from isolated impacts and damage areas to overlapping impacts, damage ar-
322 |
Chapter 5 |
eas, or both, which has been only partially addressed. There is also the issue of environmental effects on both erosion and subsequent strengths. While strain rates in impact loading may limit effects of environment, there may still be environmental effects in play due to residual stresses, and in subsequent strength testing. The possible G dependence of such environmental effects (Fig. 2.7) is an added complication that needs to be addressed in a broader evaluation of G effects. Finally, there is a serious need better to evaluate the nature of erosive impact damage and its impact on both erosion and resultant strengths in terms of the nature of the cracks, their scale and character relative to the grain size, and the relevance of macro crack propagation tests to such cracking. Thus impact cracks are as complex or more complex than many indent cracks, consisting of various combinations, natures, and extents of cone, lateral, and median cracks. While such more complex crack patterns are likely to reduce somewhat the stress intensity on the resultant crack that propagates, e.g. in a post erosion strength test, there is at best a very uncertain and probably limited relation between the effect of such stress intensity reduction and toughness increases due to crack bridging and branching in large scale crack propagation. The latter have commonly been indirectly asserted via assumed contributions of R-curve effects, but the issues of both crack scale and their nature (as just noted) need to be recognized and objectively evaluated.
V.GRAIN DEPENDENCE OF WEAR AND MACHINING
A.Grain Dependence of Scratch Hardness and Abrasive Wear
Two of the common methods of studying wear are its direct study by various tests of two bodies against one another and by simulating the effects of a single abrasive particle or surface asperity impressed into and translated over the test surface under varying conditions. The grain effects on the former test are discussed in the following section and the latter, which is based on scratch hardness testing, is the subject of this section.
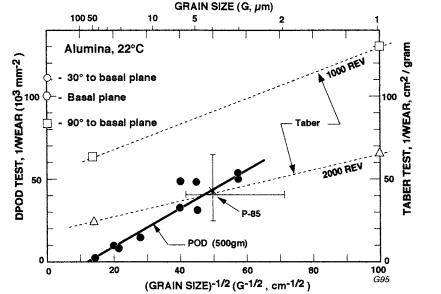
Wu et al. [82] conducted scratch hardness tests as a function of G for several ceramics using a conical diamond point with an included angle of 90° and a tip radius of 15 m with loads of 0.5, 1, and 1.5 kg on the tip as the specimen is rotated under it at 0.1 cm/s to make a circle 1 cm diameter. Such tests are referred to as diamond pin-on-disk (DPOD) tests. The wear (W) was taken as the average of the wear track cross-sectional area in planes normal to the wear surface; the reciprocal (1/W), i.e. the wear resistance, was plotted versus G-1/2, since this is analogous to such plots of indentation hardness. Data for dense hot pressed polycrystalline Al2O3 of various grain sizes down to 3 m was all below the data for sapphire (Fig. 5.10), which may indicate effects of grain boundaries and related TEA and EA stresses. Subsequent results for a commercial 85%
Grain Dependence of Comprehensive Strength, Wear |
323 |
FIGURE 5.10 Diamond pin-on-disk scratch tests of hot pressed and an 85% commercial alumina (P-85) Al2O3, as well as three orientations of sapphire with a 0.5 kg load and for Taber wear tests of two similar aluminas at 1000 and 2000 revolutions. Note that both tests clearly show wear resistance decreasing as G increases and that the DPOD results are not only well below the sapphire data but also extrapolate to a negative intercept at G -1/2 = 0. (From Refs. 82, 83, published with the permission of Ceramic Engineering and Science Proceedings.)
alumina [83] agreed reasonably well with the hot pressed data. The polycrystalline data clearly showed substantial decrease in wear resistance as G increases, not only extrapolating well below those for three orientations of sapphire but also to a negative intercept at G-1/2 = 0. This suggests that it has a distinct minimum similar to, but probably more extreme than for, indentation hardness (e.g. Figs. 4.1,4.2).
Wu et al. [84] also made DPOD tests on several commercial SiC bodies of varying additive amount and type, and frequently with substantial G ranges, again plotting 1/W versus G-1/2. Their HV (0.5 kg load) showed similar trends with their DPOD data at 0.5 and 1 kg (Fig. 5.11). Both the DPOD tests extrapolate to positive intercepts at G-1/2 = 0, but the 1 kg load tests cover a reduced range of 1/W. Both 1/W and HV plots indicate that in bodies with substantial ranges of grain sizes, their wear behavior is more consistent with data for bodies

324 |
Chapter 5 |
FIGURE 5.11 Plot of HV (0.5 kg load) and the reciprocal of the DPOD wear (0.5 and 1 kg loads) versus G -1/2 for the same set of commercial SiC bodies. Note that both sets of 0.5 kg data extrapolate to positive intercepts at G -1/2 = 0, that the 1 kg data is consistent with this despite its compression, and that data for bodies with wide G ranges agree with other data toward or at their larger G values. (After Wu et al. [84], published with the permission of Ceramic Engineering and Science Proceedings.)
with narrower G ranges when plotted versus the larger G values, i.e. the larger G values dominate such wear behavior.
Wu et al. [82] also made DPOD tests on (1) various hot pressed MgO bodies along with data on a {100} MgO crystal surface, (2) various experimental and commercial PSZ and TZP bodies (all with Y2O3 partial stabilization, except two with MgO) and on {110} surfaces of crystals with 20 and 12 wt% Y2O3, and (3 mostly dense MgAl2O bodies and {100}, {110}, and {111} surfaces of stoichiometric crystals (Fig. 5.12). Again plots of 1/W versus G-1/2 all showed 1/W decreasing as G increased, with many polycrystalline values substantially below single crystal values and extrapolating near, or below, the lower end of the single crystal values. Again, there was compression of the range of wear resistance at higher loads, so polycrystalline values tended to extrapolate closer to

Grain Dependence of Comprehensive Strength, Wear |
325 |
FIGURE 5.12 Plot of 1/W versus G-1/2 for (A) ZrO2 and (B) MgO for loads of 0.5 and 1 kg. Note again that (1) where bodies have a large range of grain sizes, results are more consistent with the larger G rather than the finer G, (2) polycrystalline trends extrapolate to below single crystal values, indicating a minimum in the wear resistance analogous to H minima frequently observed, and (3) compression of the data range at higher loads. (From Ref. 82, published with the permission of Ceramic Engineering and Science Proceedings.)
single crystal values at 1 versus 0.5 kg loads. All three of these data sets could be consistent with a minimum of 1/W at some intermediate G value as for indentation hardness, since there is either no data at larger G, e.g. > 20–50 m for ZrO2 and MgO, or almost no data between 0.5 and 50 m for MgAl2O4 (which may be why it showed less G dependence than the other two materials). Also note that

326 |
|
|
|
|
|
|
|
|
|
|
Chapter 5 |
|
TABLE 5.2 Diamond POD Wear of Various Nonoxide Ceramics of Varying |
||||||||||||
Grain Sizes at Three Loads |
|
|
|
|
|
|
|
|||||
|
|
|
|
|
|
|
|
|
||||
|
|
|
|
|
Grain |
|
Diamond POD wear track cross-sectional |
|||||
|
|
|
|
|
|
|
area (m)2 loads |
|
|
|||
Ceramic |
Fabri- |
size |
|
|
|
|
||||||
|
|
|
|
|
|
|||||||
( H)a |
|
cationb |
(G, m) |
|
0.5 kg |
|
1 kg |
|
1.5 kg |
|||
|
|
|
|
|
|
|
||||||
AlN [12] |
S |
6 |
± 1 |
0.06 ± 0.02 |
0.18 ± 0.06 |
0.28 ± 0.15 |
||||||
|
|
|
|
HP |
8 |
± 3 |
0.08 ± 0.1 |
0.18 ± 0.1 |
0.26 ± 0.15 |
|||
|
|
|
|
HP |
16 |
± 3 |
0.08 ± 0.07 |
0.30 ± 0.20 |
0.59 ± 0.25 |
|||
Si |
N |
4 |
[18]c |
HPd |
0.5 |
|
— |
2.3 ± 0.6 |
21 |
± 2 |
||
3 |
|
|
|
|
|
|
|
|
|
|
|
|
|
|
|
|
HP |
1.3 |
|
— |
20 |
± 3 |
48 |
± 3 |
|
|
|
|
|
HP |
15 |
|
|
— |
7 |
± 2 |
45 |
± 7 |
TiC [26] |
HP |
16 |
|
8.7 ± 0.9 |
22 |
± 5 |
39 |
± 5 |
||||
TiB2 [23] |
HP |
0.9 |
6.7 ± 1.2 |
24 |
± 5 |
51 |
± 12 |
|||||
|
|
|
|
S |
6 |
|
11 ± 2 |
25 |
± 5 |
51 |
± 12 |
|
|
|
|
|
S |
120 |
|
5.8 ± 1.2 |
52 |
± 27 |
138 |
± 75 |
|
aApproximate HV (500 gm load) values.
bS = sintered, HP = hot pressed, all to low, e.g. ~ 0, porosity. cNC 132.
Source: Ref. 82.
separate DPOD and HV tests of ZrO2 crystals as a function of Y2O3 content indicate that both are essentially independent of Y2O3 content until it gets below 5 w/o, i.e. where significant monoclinic content begins to appear, in which case H progressively decreases and wear substantially increases [82].
More limited data of Wu et al. [83] from their DPOD tests on various nonoxide materials of low to zero porosity, though scattered some, also shows a general trend for increased wear (i.e. decreased wear resistance) as G increased (Table 5.2). Scatter is attributed to factors such as residual porosity, heterogeneities of additive distribution (and possibly to some extent the type and amount of additive), and variations in grain structure. One important example of this was the observation of significant relic structure from spray drying in a sialon body. Microcracking, which is another source of higher wear rates, is suspected in the large G TiB2.
An important question regarding such scratch tests is how similar or different they are relative to both indentation hardness (Chap. 4) and other wear tests (considered in the next section). Scratch tests are very similar to indent tests in that a tip, commonly a sharp one, is pressed into the surface to make an impression, but in the scratch hardness test the tip must also plow through the material in order to make its track. Direct comparison of both tests is feasible by plotting scratch hardness versus HV at the same loads on the same or similar materials and surface finishes for various ceramics for the same G (e.g. for G
Grain Dependence of Comprehensive Strength, Wear |
327 |
15 m) where there is more data [82–84]. This comparison shows there is a general correspondence between the two tests, as might be expected, but with two sets of deviations. The first and most obvious was two materials having much higher scratch hardness versus HV than the other materials, i.e. Si3N4 and especially AlN. Some difference might be expected, since while indent tests have varying extents of interactions with grain structure and hence with grain boundaries (Chap. 4), scratch tests inherently have more such interaction. Thus where impressions in either test are smaller than the grain size, the indent test will reflect more limited effect of the grain structure, while the scratch test is literally forced into successive grains and resultant broader interaction with the grain structure. The combination of the wear track character (considered next), and the fact that fracture is often a more serious source of wear, suggest that the deviations of Si3N4 and especially AlN are due to greater plastic flow. The second difference between indent and scratch tests is that while most materials compared in the two tests show reasonable correlation, this correlation is not constant as a function of G, since variations decrease as load increases. Thus comparison at another G result in different scatter, slopes, or both, as is also indicated by the two tests generally having different slopes as a function of G, which is again consistent with more interaction of scratch tests with the grain structure.
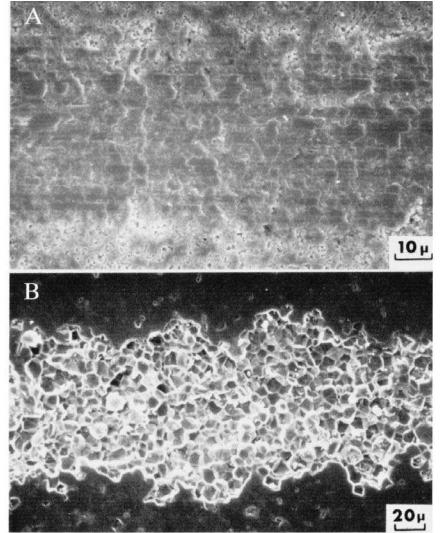
SEM examination of the wear tracks showed a broad trend for the track surface to fall in the range from a relatively smooth surface, with some undulations and striations parallel with the track at fine G, to more, or exclusively, fractured surface, usually with substantial to exclusive intergranular fracture at larger G (Figs. 5.13,5.14). The smoother surfaces with striations are typically interpreted as evidence of plastic flow. A frequent intermediate step between striations and fracture is the occurrence of partial, then complete, approximately periodic transverse interruptions of the smooth striated track surfaces as G, or other parameters presumably enhancing stick–slip conditions, increases, which again indicates plastic flow. The occurrence of plastic flow is supported by TEM studies of wear and abraded surfaces, e.g. Hockey et al. [86]. Though not directly studied, the intergranular fracture mode appears to commence at a finer G and be more complete at larger G and in bodies with weaker grain boundary phases, as is probably true for both MgO (Fig. 5.13) and MgAl2O4 (Fig. 5.14). Further support for the indications of plastic flow in such track formation and its role in limiting wear rates, and fracture enhancing them, is the greater extent, smoothness, and persistence to larger G in bodies showing lower wear, e.g. Si3N4 and AlN.
Mukhopadhyay and Mai [87] did similar scratch tests on three sintered, dense, pure alumina bodies [G = 0.7, 5, and 25 m, having HV (500 gm load) of 19, 16, and 11 GPa] using a conical diamond with a 100 m tip radius with loads of 8–40 N. Tangential forces increased with load but were mixed as a function of
328 |
Chapter 5 |
FIGURE 5.13 SEM photos of DPOD scratch wear tracks under a 1 kg load on hot pressed MgO with G = (A) 0.7 m and (B) 8 m. Note the smoother surface at finer G with striations parallel with the scratch path indicating plastic flow (but some possible cracking, probably along grain boundaries, under the translucent surface layer) and the essentially complete intergranular fracture at larger G. More cracking at such finer Gs is attributed to residual boundary phases. (From Ref. 82, published with the permission of Ceramic Engineering and Science Proceedings.)

Grain Dependence of Comprehensive Strength, Wear |
329 |
FIGURE 5.14 SEM photos of DPOD scratch wear tracks under a 1 kg load for MgAl2O4 with G = (A) 0.4 m and (B) 50 m. Note the smooth track surface except for some striations parallel with the track at finer G and the marked increase in microfracture, mainly intergranular at the larger G, and that this often occurs over a wider region than the track width. (From Ref. 82, published with the permission of Ceramic Engineering and Science Proceedings.)