

Mechanical Properties of Ceramics and Composites
.pdf250 |
Chapter 4 |
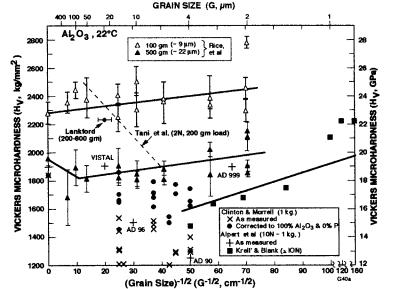
FIGURE 4.1 HK vs. G -1/2 for single crystal (sapphire) and polycrystalline (mainly hot pressed) Al2O3 of Rice et al. [7] (100 and 500 gm loads, giving typical indent diagonals respectively of 8 and 23 m) and Skrovanek and Bradt [21] (400 gm load, subor superscripts the number of tests) at 22°C. Vertical bars = standard deviation. Note (1) a probable HK minimum in the 100 gm data, at G 50 m, and a definite minimum in the 500 gm load data at G 50–100 m (depending upon the exact trend of the finer G data, e.g., per two alternatives shown by dashed lines), (2) good agreement between data sets for 400 and 500 gm loads which, when combined, favors a greater G dependence in the smaller G regime. (From Ref. 7, published with the permission of the Journal of the American Ceramic Society.)
Bradt [21] agrees well with that of Rice et al. (500 gm load) but shows a greater H decrease with increasing G for G > 5–8 m (Fig. 4.1).
Kollenberg’s [22] HV (200 and 400 gm) values, averaging 19 GPa for three different sapphire planes, are in reasonable agreement with the sapphire Hv of Rice et al. [7], which in turn is in reasonable agreement with Becher’s data [19] considering possible surface finish and orientation differences. Rice et al.’s substantial data versus G does not show a clear minimum for 100 gm load but could be consistent with one at G 20 m. Their data at 500 gm load indicates a minimum at G 60 m. Limited HV data of Lankford [23] for dense sintered Al2O3 (Lucalox, loads: 200–800 gm) agrees fairly well with Rice et al.’s data for
Grain Dependence of Indentation Hardness at 22°C |
251 |
the lower (200 gm) load, i.e. falling mainly between the 100 and 500 gm data, but is high for the higher loads. Tani et al.’s [10] HV (2 N, 200 gm) data, showing a substantial H decrease from their largest G ( 60 m) to their smallest G ( 6 m) and hence a probable H minimum, varies from being consistent in H values with those of Rice et al. to some substantial difference, but not total disagreement. In view of other data for alumina and other materials, their data implies a probable HV minimum, but with a shift to finer G relative to other data, which may well be due to other factors such as G measurement, e.g., if they used asmeasured linear intercept values, these would be less (e.g. 50%) than the average (surface) diameters used in the present study.
Alpert, et al.’s [24] HV (10 N, 1 kg) data for sapphire and dense sintered larger grain Al2O3 (Vistal) and finer grain but slightly less dense 99.9% Al2O3 agrees with that of Rice et al. [7], but their values for 96% and 90% alumina are progressively lower (Fig. 4.2). Their three data points for dense Al2O3, by themselves, would indicate no G dependence of HV, but they are consistent with the HV minimum of Rice et al. Similarly, Clinton and Morrell’s [25] earlier as-mea- sured HV (1 kg) sapphire values are also generally consistent with trends of the other data, but their values for various commercial sintered (95–99%) aluminas (with P to 0.05) are lower. However, approximate correction to dense, pure alumina values by extrapolation as a function of alumina content and the exponential porosity dependence with a b value of 6 [7,15,16] brings such data into much more reasonable absolute agreement with data for dense pure aluminas, e.g. at 500 gm. More recent data of Krell` and Blank extending from 4 m down to 0.4 m [26] generally agrees in trend and absolute values with the other data (recognizing the higher, ≥ 10 N, loads), clearly showing a substantial increase in H as G decreases.
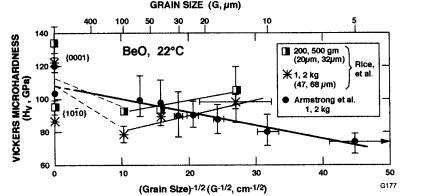
Turning to other single oxides, Rice et al.’s [7] HV data for the (0001) surface of BeO crystals was essentially identical to that of Armstrong, et al.’s [8], but the latter’s data on (1010) is somewhat higher than the former data (Fig. 4.3). Tests on {1120} and {1010} were essentially the same as for the {0001} plane [7]. While the HV values for both studies are also similar for polycrystalline values over the G range ( 15–100 m) in common and both studies show HV decreasing over the larger G, range, Rice et al. showed HV increasing with decreasing G at finer G in contrast to Armstrong et al.’s continuous H decrease. Whether this difference (at the finest two G’s) is due to differences in G or H measurements or the specific specimens cannot be determined, but H differences due to differences in porosity could be a factor.
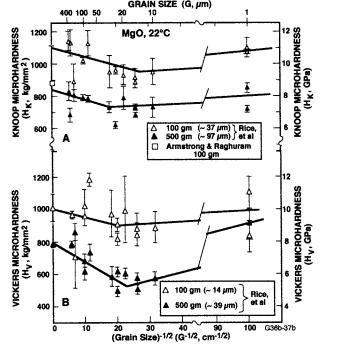
Armstrong and Raghuram’s [2] HK (100 gm) of 8 ± 3 GPa for {100} surfaces of MgO crystals averages below, but clearly overlaps with, the projection of the data of Rice et al. [7] at G = ∞ (Fig. 4.4A). Rice et al.’s polycrystalline data [7] clearly indicates similar, limited HK minimums for 100 and 500 gm loads at G 15 and 30 m respectively and an indicated limited HV minimum at
252 |
Chapter 4 |
Figure 4.2 HV vs. G -1/2 for single crystal (sapphire) and polycrystalline (mainly hot pressed) A12O3 of Rice et al. [7] (100 and 500 gm loads, vertical bars = standard deviation), giving typical indent diagonals respectively of 9 and 22 m) and other data [24–26] at 22°C. Note (1) no apparent HV minimum at 100 gm load, (2) a probable HV minimum at G = 50–100 m at 500 gm load, (3) reasonable agreement of data for experimental and commercial bodies [24,25] with general trends, and often absolute values (especially with correction for other constituents and porosity), and (4) Krel`l and Blank [26] higher load (≥ 10 N) data extending from 4 m down to 0.4 m generally agreeing with other data and showing a substantial increase in H as G decreases. (From Ref. 7, published with the permission of the Journal of the American Ceramic Society.)
G 30 m for the 100 gm load and show a definite and more substantial minimum at G 20 m at the 500 gm load (Fig. 4.4B).
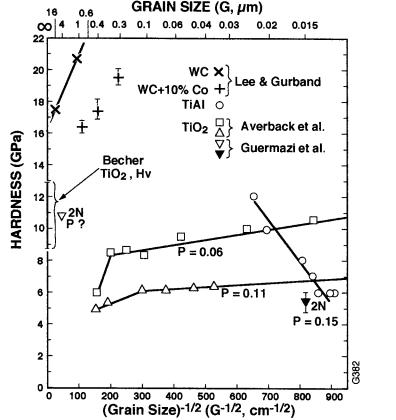
TiO2 data is restricted mainly to single crystals and submicron grain sizes (Fig. 4.5). Becher’s single crystal (rutile) data on {100} surfaces is one of the most comprehensive, reflecting HV indent loads of 300, 200, and 100 gm ( 3–1 N) and chemically polished, sanded, or diamond ground surfaces [19]. Hardness values increased (with coefficients of variation of < 5%) from averages of 8.7 to 12.9 GPa in the order of loads and surface finishes listed with the greatest increases occurring on going from 200 to 100 gm loads and from chemically polished, to sanded, to ground surfaces. His data is consistent with the other comprehensive study of Li and Bradt [27] as a function of load (50, 100, 200,
Grain Dependence of Indentation Hardness at 22°C |
253 |
Figure 4.3 HV vs. G -1/2 for single and polycrystal (sintered, P 0.05) BeO at 0.2, 0.5, 1, and 2 kg loads of Armstrong et al. [8] and (1 and 2 kg) loads of Rice et al. [7] at 22°C. Respectively vertical and horizontal bars are standard deviation, and the lower ends of vertical bars represent the average value for the lower load, and the upper end the higher load value (coefficient of variations varied for < 1% to 9%, averaging 3% for 4–6 measurements over all loads). Note the general agreement of both single and polycrystalline values between the two studies, except at finer G. (From Ref. 7, published with the permission of the Journal of the American Ceramic Society.)
and 300 gm) and orientation on {100}, {110}, and {111} surfaces of rutile crystals with mechanically polished surfaces giving Knoop hardnesses of 10.5 to 16 GPa, mostly ≤ 14 GPa. The estimated HV value of Mayo et al. [28] of 11 GPa from nanoindent tests on {100} mechanically polished rutile surface is also consistent with the above data. Data of Averback et al. [29] (see also Andrievski [30]) for HV (load unspecified) of two TiO2 (mainly rutile) bodies with P = 0.06 and 0.11 with G 0.15 to 0.5 m both show H decreasing with increasing G, with the rate of decrease clearly accelerating above G 0.35 m. While the actual hardness values are mostly below those for single crystals, correcting them for porosity would bring them at the minimum to about the mean of single crystal values, and more likely mostly somewhat above the upper range for single crystal values, i.e. very similar to other data (e.g. Figs. 4.1–4.4). (Thus the minimum b value of e-bP for correcting for porosity would move H values for G 0.04 m to 10–12 GPa. However, Averback et al.’s data indicates a more likely b value of 7.5, which appears more consistent with Mayo et al.’s [28] data. This b value would move the above H values up to 15 GPa.) The two HV data points (2 N load) of Guermazi et al. [31] at G 0.015 and 5 m (the former with P 0.15 and the latter from further sintering of the former and unspecified P, but
254 |
Chapter 4 |
Figure 4.4 Hardness vs. G -1/2 for hot pressed and single crystal MgO of mainly Rice et al. [7] at 22°C. (A) HK data (100 and 500 gm load) giving typical indent diagonals respectively of 37 and 97 m, showing probable HK minima at G15 and 30 m respectively for 100 and 500 gm loads. (B) HV (100 and 500 gm loads, giving typical indent diagonals respectively of 14 and 39 m) showing a probable HV minimum at G 30 m for 100 gm load, and (2) definite HV minimum at G 20 m at 500 gm load. Vertical bars = standard deviation. (From Ref. 7, published with the permission of the Journal of the American Ceramic Society.)
probably 0) appear to be fairly consistent with the other data, e.g. correction of the finer G body with P 0.15 with b = 4–7.5 gives H values of 10–17 GPa. Thus the TiO2 data, while having uncertainties of load and porosity character and correction, appears consistent with data for other materials over more typical G ranges with P 0. Whether the greater rate of decrease at G > 0.35 m is the decrease toward a minimum as found for most other materials is somewhat uncertain, but given the low load–small indent size of the nanoindentations, this may be a reasonable possibility.
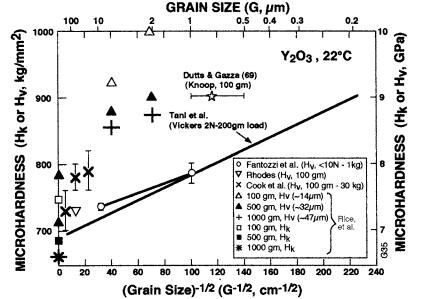
Tani et al.’s [10] HV (2 N 200 gm) data for dense hot pressed Y2O3 (Fig. 4.6) shows a substantial (> 20%) decrease in H from the finest ( 0.2 m) to the
Grain Dependence of Indentation Hardness at 22°C |
255 |
Figure 4.5 HV G -1/2 data for single and polycrystalline (rutile) TiO2 [19,29,31], WC [30,80,81], and TiAl [99] at 22°C, mostly for submicron grains.
largest (214 m) G (in contrast to the significant H increase with increasing G they observed for their dense Al2O3, Fig. 4.2) but is considerably below most of Rice et al.’s [7] data, and slightly below Fantozzi et al.’s [33] limited (≤ 10 N 1 kg, G = 1 and 10 m) data. Limited larger G ( 20–500 m, 100 gm-30 kg) data of Rhodes [34] and Cook [35] (which showed little or no load dependence) lies somewhat (e.g. 10%) above Tani et al.’s data, while the limited (100–1000 gm, G2–500 m) data of the present study lies 15–25% above Tani et al.’s data. However, some of the materials of these latter three studies contained 10% ThO2 or a La2O3 rich second phase (G = 500 m material) which could increase H values. Tani et al.’s 200 gm HK data questions any deviations from a simple
256 |
Chapter 4 |
Figure 4.6 Hardness–G -1/2 data for single and polycrystalline Y2O3. HK of Rice et al. [7] (100 and 500 gm loads), and one data point (100 gm load) of Dutta and Gazza [32] at 22°C. HV data of Rice et al. (100, 500, and 1000 gm loads, giving typical diagonals respectively of 14, 32, and 47 m), Tani et al. [10] ( 200 gm), Fantozzi et al. [33] ( 1 kg), Rhodes [34] (100 gm load, dense sintered, optical material), and Cook et al. [35] (100 gm–30 kg loads). Vertical bars = standard deviation. (From Ref. 7, published with the permission of the Journal of the American Ceramic Society.)
Hall–Petch relation. Heavier load data is too limited to be definitive but also questions deviations from a simple Hall–Petch relationship. This, combined with the significantly less cracking [and the earlier noted apparent avoidance of grain boundary fracture [7] (Chap. 2, Sec. II.D)], suggests there can be exceptions to the general deviations to a minimum below a Hall–Petch relation, especially for harder materials, based on material character, not just load and indent geometry.
Pajarec et al.’s [36] HK (100 gm 1 N) data for cubic (9.4 m/o Y2O3) ZrO2 crystals averaging 14.5 GPa for various orientations on {100} planes agrees with data of Rice et al. [7] for similar (but generally lower Y2O3 content) crystals (Fig. 4.7A). Cochran et al.’s [37] HK (100 gm) of 11.8–13.0 GPa for ZrO2 (+ 9.8 m/o Y2O3) crystals of unknown orientation is somewhat lower. The single crystal HK data shows no clear dependence on G, which may be due to limited differences of composition and porosity levels but also likely reflects greater plastic ac-

Grain Dependence of Indentation Hardness at 22°C |
257 |
Figure 4.7 Hardness vs. G -1/2 for ZrO2. at 22°C. (A) HK (100 and 500 gm loads, giving typical indent diagonals respectively of 32 and 74 m) of Rice et al. [7] indicate no apparent G dependence, (B) HV data of Rice et al. [7] (100 and 500 gm loads, giving typical indent diagonals of respectively 12 and 27 m) and others [40–46]. Some data, especially that of Duh and Wan [44], shows a clear G dependence. Vertical bars = standard deviation. (From Ref. 7, published with the permission of the Journal of the American Ceramic Society.)
commodation often feasible in (partially stabilized) ZrO2. Pajarec et al.’s [36] {100} HV of 16.0 ± 0.1 GPa (200 gm 2 N), independent of indenter orientation on the plane, is somewhat higher, but it is still in reasonable agreement with the present data (Fig. 4.7B). Watanabe and Komaki’s [38] HV (30 kg) data for ZrO2 (2–4 m/o Y2O3) crystals of unknown orientation of 12.0 ± 0.5 GPa is in excellent agreement with the present data and with earlier data of Wu and Rice [39]. Higuchi et al.’s [40] HV (1 kg) data for hot pressed ZrO2 (+ 8 m/o Y2O3 + 0.1–0.2 w/o C) is somewhat higher than, but in reasonable agreement with, Rice et al.’s [7] and Chiou et al.’s [41] (5 kg) data for sintered bodies (Fig. 4.7B). Data of Ramadas et al. [42] for sintered ZrO2 (0.5 to 7.5 mol%) Y2O3 bodies (at 10 kg load), corrected to zero porosity [16,43], also generally agreed with their data. Higuchi et al.’s [40] data suggests greater H dependence at fine G, which is probably more realistic, since their hot pressed samples had constant composition. Rice et al.’s samples generally increased in Y2O3 content with increasing G and were sintered,

258 |
Chapter 4 |
having some (e.g., a few %) porosity (except for the single crystals). Their data indicates a limited HV minimum at G 50 m, but no clear G dependence at finer G. However, this may be due to limited composition and porosity effects, since other data suggest HV increasing with decreasing G at finer G. Duh and Wan’s [44] data (for Y2O3 + CeO stabilizers and high loads) clearly shows the normal H–G-1/2 dependence and some, but limited, load dependence. Ruiz and Readeys’ data for 3 mol% Y-TZP (0.13–0.33% porosity) also showed a modest decrease from 12.7 GPa at the finest G (0.3 m) to 11.3 GPa at the largest G (5 m) [45]. Ahlborn et al.’s data for dense (transparent) fully stabilized ZrO2 (with 10 mol% TiO2 + 7 mol% Y2O3) suggested a slight decrease in HV (unspecified load) from 13.1–13.4 GPa for G = 25 and 90 m to 12.3 GPa at G = 130 m [46].
Akimune and Bradt’s [47] HK (100 gm) data for stoichiometric MgAl2O4 crystals, {100} planes, averaging 16.5 ± 1.5 GPa for various orientations and just over 15 GPa for the {111} plane, is quite consistent with data of Rice et al. [7], while manufactured HK (100 gm) data for commercially produced stoichiometric crystals, averaging 13.5 ± 1.5 GPa, is somewhat lower but not grossly inconsistent with other data (Fig. 4.8). Rhodes et al.’s [48] HK (100 gm) for polycrys-
Figure 4.8 HK vs. G -1/2 for single and polycrystalline MgAl2O4 at 22°C. Data of Rice et al. [7] (100 and 500 gm loads, giving typical indent diagonals respectively of 29 and 71 m) and of Rhodes et al. [48] (100 gm load). Rice et al.’s 100 gm data, taken by itself, would suggest a possible HK (probably anomalous) maximum at intermediate G, especially when effects of increasing (to several %) porosity with decreasing G are considered. Other data all indicates an HK minimum. Data of Rhodes et al. suggests a definite HK minimum between G 5 and 20 m. Vertical bars = standard deviation. (From Ref. 7, published with the permission of the Journal of the American Ceramic Society.)

Grain Dependence of Indentation Hardness at 22°C |
259 |
Figure 4.9 HV vs. G -1/2 data for MgA12O4 at 22°C of Rice et al. [7] (100, 500, and 1000 gm loads giving typical indent diagonals respectively of 10, 26, and 38 m). Note data for three principal planes for stoichiometric (Czochralski) and random planes of alumina rich (Vernulil) single crystals. Vertical bars = standard deviation. Horizontal bar = G range for Budnikov et al.’s [49] 90 gm data. (From Ref. 7, published with the permission of the Journal of the American Ceramic Society.)
talline MgAl2O4 specimens (press forged or hot pressed, typically with about 1% Li-based additions), is considerably below the present data (Fig. 4.8) but clearly suggests that hardness first decreases with increasing G and later increases with increasing G as one approaches single crystal values, i.e., a HK minimum at G 5–15 m at 100 gm load. While Rice at al.’s 100 gm data is uncertain, their 500 gm data showed a minimum at G 100 m, e.g., in view of some porosity in especially the finest G bodies. The more extensive single crystal HV, including lower HV of alumina rich versus stoichiometric crystals, and polycrystalline data of Rice et al. (Fig. 4.9), shows distinct HV minima at G 50–400, 50, and 20 m, respectively for loads of 100, 500, and 1000 gm. Budnikov et al.’s [49] MgAl2O4 HV ( 90 gm) data lies below the other data but is reasonably consistent with it. Note (1) that the greater uncertainty in the degree and extent of G dependence at finer G is probably due to the limited porosity in finer G specimens, and (2) that both sets of Rice et al.’s data involve some specimens of varying stoichiometry (e.g. some of the bodies in Fig. 3.10), which probably adds to the variations.
Okazaki and Nagata’s HV (unspecified load) data for PZT, though covering