

190 Project 1 CREATING A CUSTOMER MAINTENANCE PROJECT
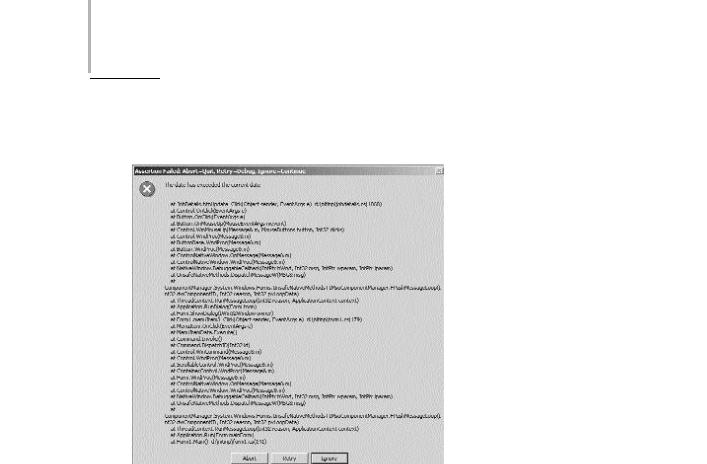
When the value in the dateTimePicker1 control exceeds the current date, a Debug Assertion Failure dialog box is displayed, as shown in Figure 9-8.
FIGURE 9-8 The Debug Assertion Failure dialog box
Debugging the Customer Management
Application
Visual Studio .NET provides a number of features that simplify the debugging of applications. In this section, you will learn to use the debugging windows and Task List features of Visual Studio .NET. Whereas the debugging windows help you find errors in the program, the Task List helps you maintain a list of pending tasks.
Using the Debugging Features of Visual Studio .NET
Visual Studio .NET provides 13 debugging windows. Of these, the important ones are listed here.

VALIDATIONS AND EXCEPTION HANDLING |
Chapter 9 |
|
191 |
|
|||
|
|
|
|
Autos. The Autos window shows the value of the variable in a code that is currently executing.
Watch. The Watch window can be used to monitor the value of variables. You can add variables to the Watch window and check their values when your application is executing.
Call Stack. The Call Stack window shows the functions and the sequence in which they have been called in an application.
Breakpoints. The Breakpoints window shows all the breakpoints that you have added to your application.
Command. The Command window can be used to check the output of a variable or an expression.
Output. The Output window shows the assemblies and modules that have been loaded by your application.
These windows are available only when you run your application in the Debug mode. When you are in the Debug mode, your application temporarily halts when it encounters a breakpoint. At that time, you can examine the data in each window to determine the state of your application and correct any anomalies.
I will now discuss how to create a breakpoint and then how to use debug windows at the breakpoint.
Adding Breakpoints to an Application
A breakpoint halts the execution of your application so that you can examine the state of the application, such as the data in variables and the functions that have been invoked in the application. To insert a breakpoint, follow these steps:
1.Click on the line in which you want to insert a breakpoint.
2.Click on the Debug menu and then click on New Breakpoint.
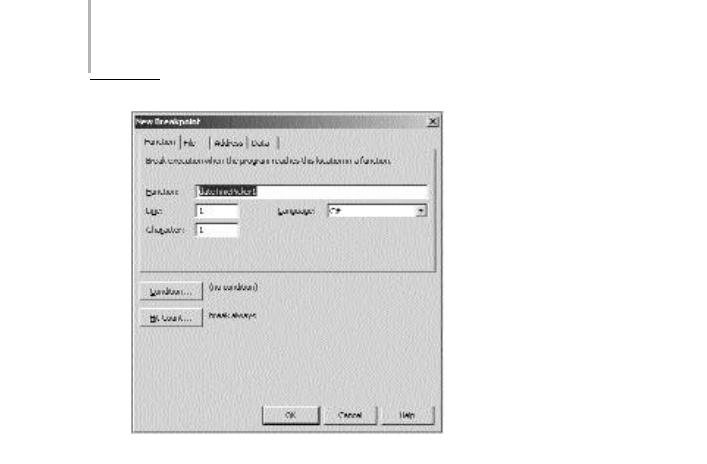
3.The New Breakpoint dialog box opens, which is shown in Figure 9-9. In this dialog box, click on the File tab.
4.The file name and number of the line that you selected in Step 1 are shown in the File tab of the New Breakpoint dialog box. Click on OK to create the new breakpoint.
192 Project 1 CREATING A CUSTOMER MAINTENANCE PROJECT
FIGURE 9-9 Adding a new breakpoint
Working with Debugging Windows
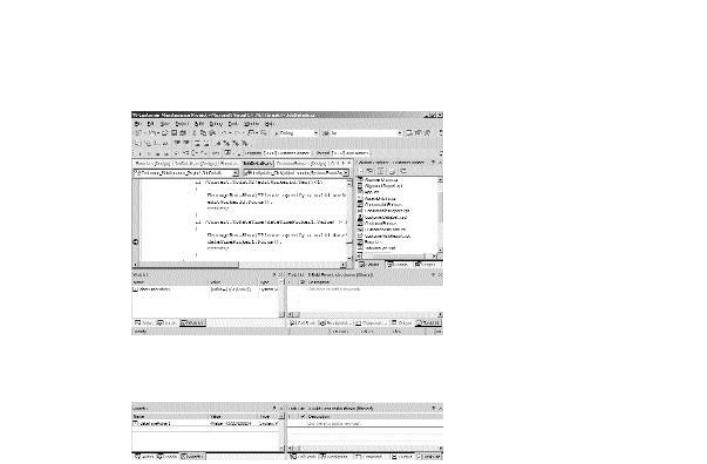
To use debugging windows, insert a breakpoint into your application by using the steps given in the preceding section and run your application. When the application encounters a breakpoint, it gets suspended temporarily. In the suspended mode, you can view all the debugging windows.The suspended view of the application is shown in Figure 9-10.
In the suspended view, as you can see in Figure 9-10, the Autos window shows the value stored in the dateTimePicker1 control and the Breakpoints window shows the breakpoints in the application. Similarly, the Watch and Call Stack windows are shown in Figure 9-11. I have added the dateTimePicker1 watch expression to the Watch window. The Call Stack window shows the calls to functions that have been already made in the application.
VALIDATIONS AND EXCEPTION HANDLING |
Chapter 9 |
|
193 |
|
|||
|
|
|
|
FIGURE 9-10 Suspending an application
FIGURE 9-11 Watch and Call Stack windows
Using the Task List
The Task List in Visual Studio .NET is a useful feature that enables you to view a summary of pending tasks in a project. You can use the Task List to view compilation errors, summarize a list of pending tasks, and view the status of pending tasks. To view Task List, follow these steps:
1.Click on the View menu.
2.On the View menu, click on Other Windows and then click on Task List.
3.In the Task List, right-click on the Description field.
4.Click on Show Tasks in the short-cut menu.
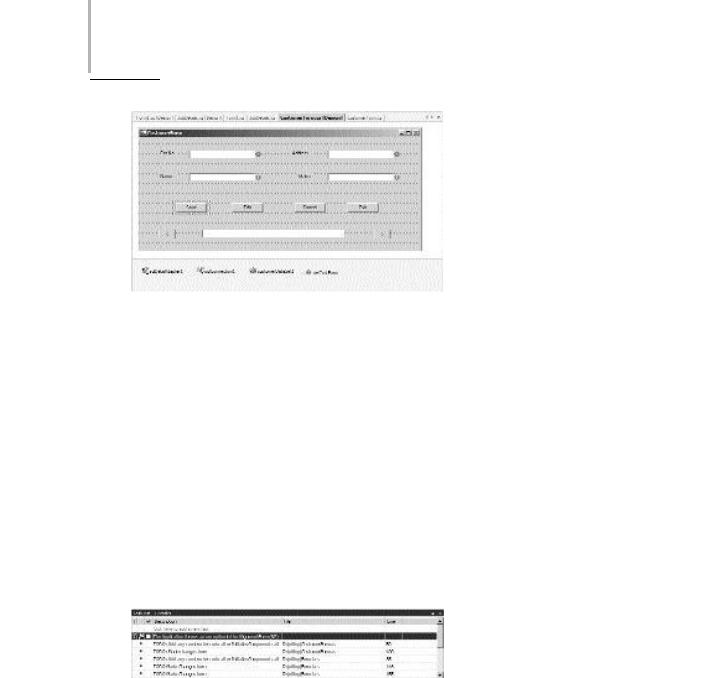
5.From the Show Tasks submenu, click on All. All tasks that are currently added to the Task List appear in the Task List, as shown in Figure 9-12.
194 Project 1 CREATING A CUSTOMER MAINTENANCE PROJECT
FIGURE 9-12 Viewing pending tasks in the Task List
By default, all compilation errors are added to the Task List. In addition, all comment entries that you create with the keywords TODO or HACK are also added to the Task List. Therefore, you can create a comment entry such as:
//TODO: Add data validation code here
This entry will automatically appear in the Task List. Double-clicking on the entry will take to you to the line of code where you made the comment.
You can also add tasks to the Task List directly in the Task List window. Such tasks are referred to as user-defined tasks. For user-defined tasks, you can assign a priority of High, Low, or Normal. Figure 9-13 shows a user-defined high-priority task in the Task List.
FIGURE 9-13 User-defined tasks in the Task List