
- •1 Introduction and outline
- •2 Review of literature
- •2.1 Structure of dextran
- •2.2 Microbial loading in sugar factories
- •2.3 The common methods of dextran fractions determination
- •2.4 Dextran content during the process of sugar production
- •2.5 Dextrans associated with processing problems
- •2.6 Crystallization process
- •2.6.1 Growth rate of sucrose crystals
- •2.6.2 Crystallization kinetics
- •2.6.3 Parameters influencing crystallization kinetics
- •2.6.4 Crystal morphology
- •2.7 The Economic gain
- •3 Material and methods
- •3.1 Material
- •3.2 Analytical methods
- •3.2.1 Determination of dextran
- •3.2.1.1 Robert method
- •3.2.1.2 Haze method
- •3.2.2 Microbiological experiments
- •3.2.2.1 Isolation
- •3.2.2.2 Identification
- •3.2.2.2.1 Gas and acid formation
- •3.2.2.2.2 Catalase test
- •3.2.2.2.3 Gram characteristics (KOH-Test)
- •3.2.2.2.4 Identification by API 50 CHL test
- •3.2.2.2.5 L/D-Lactic acid test
- •3.2.3 Crystallization experiments
- •3.2.3.1 Measurement of growth rate of sucrose crystals
- •3.2.3.1.1 Required amount of dextran and seed
- •3.2.3.1.2 Calculation of the growth rate of sucrose crystals:
- •3.2.3.2 Dynamic viscosity
- •3.2.3.3 Crystal morphology and surface topography
- •3.2.3.4 Image analysis
- •3.2.4 Statistical analysis
- •4 Results and discussion
- •4.1 Sensitivity and accuracy of different methods for the determination of dextrans of varying molecular mass
- •4.1.1 Robert’s Copper method sensitivity
- •4.1.2 Haze method sensitivity
- •4.2 Microbial sources of dextran an identification of relevant microorganisms in sugar factories
- •4.3 Levels of dextran contents in different sugar beet factories
- •4.4 Quality of factory final products and their relationship to the levels of dextran during different industrial periods
- •4.5 Influence of dextran concentrations and molecular fractions on the rate of sucrose crystallization in pure sucrose solutions
- •4.5.1 Influence of different temperatures on growth rate of sucrose crystals in the presence of dextran
- •4.6 Elucidation of crystallization kinetics in presence of dextran molecules
- •4.7 Influence of dextran molecule fractions on sucrose solution viscosity
- •4.8 Influence of dextran on the morphology and surface topography of sucrose crystals in presence of dextran
- •4.8.1 Crystal morphology
- •4.8.2 Surface topography
- •4.9 Technical and technological consequences and future perspectives
- •5 Summary
- •6 References
- •7 Appendix
- •8 C. V. and List of Publications

Results and discussion |
76 |
|
|
A fte r d ry in g |
A fte r |
|
|
c e n trifu g a tio n |
|
(u n s ta b le s ta te ) |
|
|
|
S a tu ra te d s o lu tio n
C ry s ta llin e p h a s e
G la s s y s ta te
S a tu ra te d s o lu tio n
Figure 50: The crystal surface of a sucrose crystal during the drying process (according to Bunert und Bruhns 1995)
It can be shown that the presence of dextran in the saturated solution on the crystal surface leads to an increase of solution viscosity. So, heat transfer and consequently water transport to the air is slow. Hence, an increase of the drying time contributes to an increase of micro-crystals (fine crystal) due to nucleation on the crystal surfaces.
4.8Influence of dextran on the morphology and surface topography of sucrose crystals in presence of dextran
4.8.1Crystal morphology
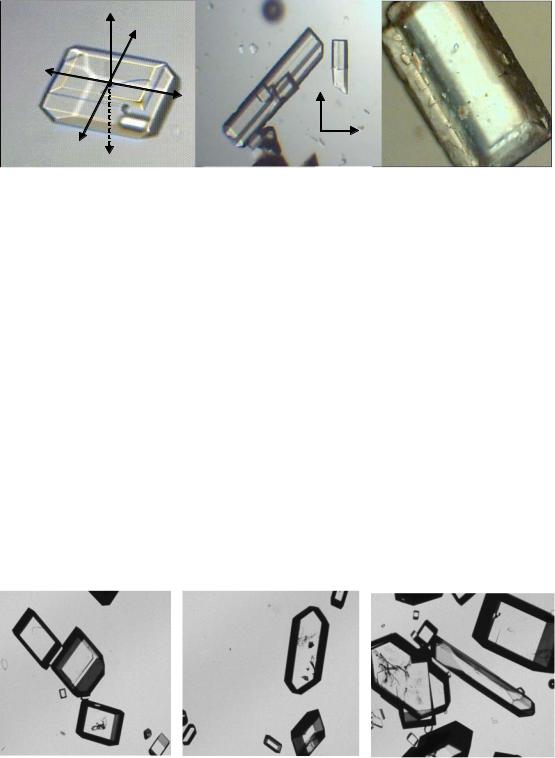
After the characterization of the influence of dextran on the crystal growth rate, in this chapter the influence on crystal shape and topography shall be illustrated in this chapter. In presence of dextran sucrose crystals are often elongated along the c axis (Figure 51-b). Dextran influences the growth rates of individual crystal faces (McGinnis, 1982) as described in chapter 2.6.4. In addition, the adsorption properties of dextran causes the deposition of impure materials on crystal surfaces (Figure 51- c), which reduces the sugar quality and increases the sugar loss to molasses.
Results and discussion |
77 |
+C +A
+B |
+C |
|
|
|
|
|
+B |
|
a |
b |
c |
Figure 51: Effect of dextran on morphology of sucrose crystals, a) Normal crystal, b) Crystal grown in presence of dextran (needle crystal) and c) Impure particles on crystal surface (crystal grown in technical sucrose solution)
The relationship between the presence of dextran and elongation of crystals (c/b ratio) was elucidated by Bubnik and Kadlec, (1996). They noticed that the variation of the c/b ratio is a function of increasing concentration of dextran (s. chapter 2.6.4.).
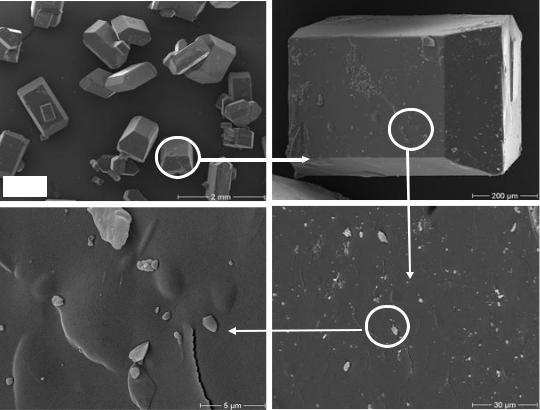
Results of own experiments showed that the low molecular weight dextran caused an elongation of crystals, despite the use of stirring during the crystallization process (see Figure 52). This result is in good agreement with Singleton, (2002). He reported that dextrans are responsible for crystal elongation along the c axis and that the smaller molecular weight dextrans are especially involved in this effect. However in own experiments a stirred crystallizer device and seeding crystals were applied. Therefore, crystals are only slightly elongated and no pure needle crystal formation took place.
Without dextran |
T40-1000ppm |
T40-2000ppm |
|
|
Figure 52: An example of influences of dextran T40 on sucrose crystal shape during the crystallization process
4.8.2Surface topography
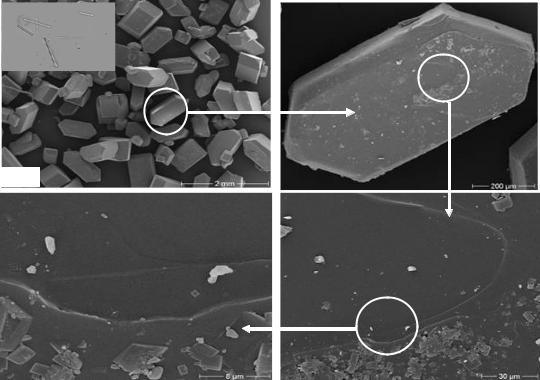
Microscopic examinations of the different faces of sucrose crystals were performed by scanning electron microscopy (SEM). Figure 53 shows the surface topography of
Results and discussion |
78 |
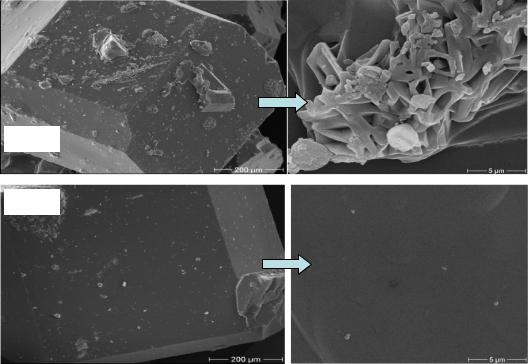
a sucrose crystal which was grown in pure sucrose solution at 60°C. It was observed that the crystal shapes has taken a normal form of a sucrose crystal. On the other hand, the microscopic examination of a crystal surface shows the fine sugar crystal on the crystal surface, which developed after the centrifugation process and during the drying operation (comp. chapter 4.7).
20x |
|
150x |
6000x |
|
1000x |
Figure 53: Surface topography of a laboratory sucrose crystal grown in absence of dextran at 60°C
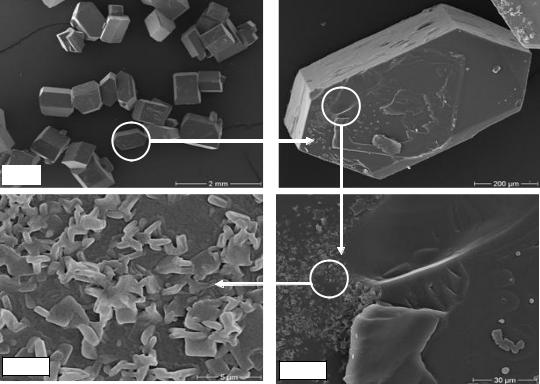
Figure 54 shows the effect of the low molecular dextran fraction (T40) on sucrose crystal shape and the surface adsorption. The crystals shown are formed from 200 µm seed crystals and therefore no needle crystals are formed. In contrast, crystals nucleated in the crystallizer in the presence of dextran (top left Figure 54) were small needle crystals, which get lost to molasses easily during centrifugation and washing, consequently, increasing the molasses purity. Also, an increase of micro-crystals on the crystal surfaces took place compared with control was observed. So, rough surfaces and gaps developed on the crystals. In this case, the main affect of low molecular dextran is changing of crystal form to needle crystal. Consequently, there is an increase in sugar loss to molasses.
Results and discussion |
79 |
20x |
|
150x |
6000x |
|
1000x |
Figure 54: Surface topography of sucrose crystal grown in the presence of 1500 mg dextran T40 per kg DS at 60 °C
Figure 55 shows the influence of the high molecular fraction dextran molecules T2000 on sucrose crystal morphology and adsorption surface. It was observed that in presence of this high molecular fraction of dextran the number of conglomerated crystals (multiple crystals where two or more crystals have grown together) increased. A scanning electron micrograph of a sugar crystal shows micro-particles (sucrose crystals) strongly adsorbed on the crystal surface, which cause a rough crystal surface with a number of gaps (comp. chapter 4.7). Consequently, non-sugar and colorant particles can be adsorbed with dextran on the surface during the technical crystallization process in the sugar factories. Also in this case, the removal of impurities (non-sugars) is difficult during the washing of the crystals.
Results and discussion |
80 |
|
|
150x |
20x |
|
|
|
|
|
6000x |
1000x |
|
Figure 55: Surface topography of a sucrose crystal grown in the presence of 5000 mg dextran T2000 per kg DS at 60°C
These results confirmed those reported by Cuddihy et al., (2000); Jimenez, (2005); Karagodin, (1998); Rauh et al., (1999). They found that the increase of sugar crystallization time causes the massecuites to become cooler than normal which increases the already abnormally high viscosity of the fluid. An increase in washing time of the centrifugals is needed to get the required quality of sugar, increasing total centrifuging and purging time. Also, the needle-shaped crystal reduces the purging efficiency of the massecuites in the centrifugals resulting in a poor separation of crystal and molasses, hence reducing the refined quality of the sugar. Additionally, dust production was mainly due to the breaking and crushing of conglomerates and needle crystals near to the screens of centrifugals. Consequently, sugar fine corn in the final product is increased. Such micro-particles may be seen on the surface of a sugar crystal in Figure 55. The conglomerates contain higher ash than unconglomerated sugar. The higher ash is contained in trapped mother liquor, either partially dried in the re-entrant angles, or in the inclusions in those angles (Madsen, 1980; van der Poel, 1980). In addition, our results (not view) elucidated increase of the turbidity in sugar solution, which was produced from deteriorated beet syrup.
Results and discussion |
81 |
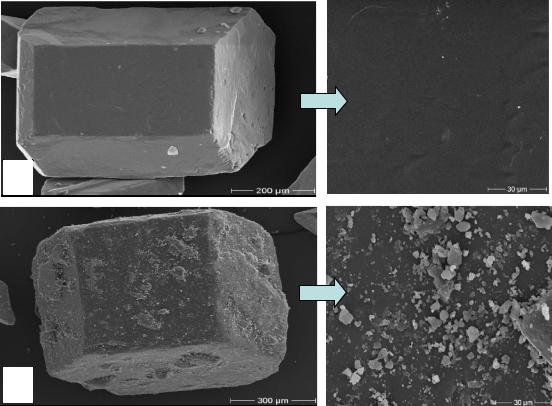
Figure 56 shows the effect of crystallization temperature on the surface topography in presence of dextran at different temperatures. It is obvious that at a crystallization temperature of 70°C more perfect crystal surfaces are built than at 55°C. As a possible reason, the increase of viscosity caused by dextran and the effects of temperature on the viscosity of (dextran-) sucrose solutions decribed in chapter 4.7 can be suggested. Also in crystal topography, the influence of dextran seems to be diminished by the application of higher temperatures as it could be observed for crystal growth rates.
This effect can also be correlated to the increase of colorant and turbidity components of sugar produced at low temperatures (after product). Additionally, the presence of dextran can assist the adsorption of these particles on the crystal surface.
55°C
70°C
Figure 56: Effect of crystallization temperature on the surface topography in the presence of dextran
Rogé et al., (2007) reported that there is a good correlation between white sugar turbidity and calcium ion concentration in stored syrups. As well they reported that macromolecular organic substances (as for example dextran) may act a carrier for components causing turbidity.
Results and discussion |
82 |
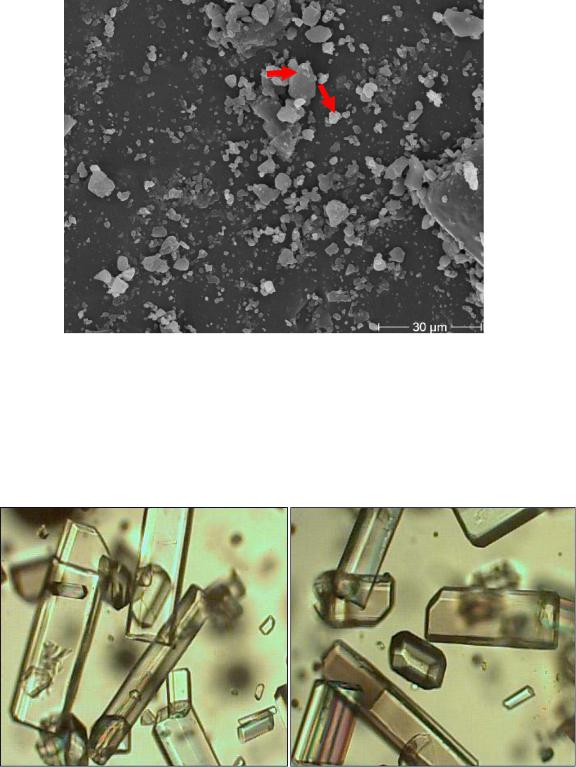
In many factories, despite the use of ion exchange to reduce calcium ion, turbidity phenomena in the produced sugar were observed. Figure 57 shows the comparison between a single sugar crystal without turbidity and a sample of a crystal with the highest amount of turbidity. Figure 58 is the magnification image of Figure 57, which shows the non-sugar particles on the crystal surface. Hence, the biggest particles (> 5µm) were calcium carbonate while the small particles (<5µm) were calcium oxalate. These particles were formed during the storage of syrup under adverse conditions.
a
b
Figure 57: Turbidity phenomena in many European sugar beet factories (a, b) during the thick juice campaign
Results and discussion |
83 |
Figure 58: The magnification image of Figure 57
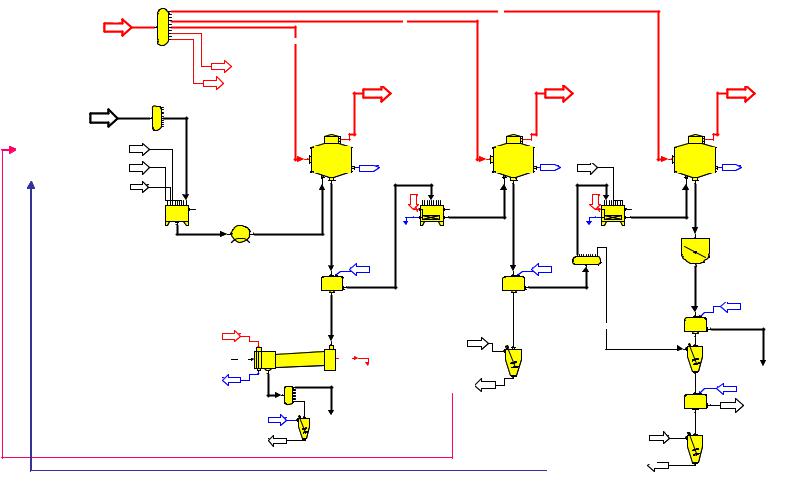
In addition, an increase of elongated crystals in the after product crystallization step as shown in Figure 59 was observed. These results are in good agreement with Rogé et al., (2007), they reported that the elongation of face c is significant and such a phenomenon increases with syrup turbidity.
Figure 59: After product sugar crystal in one of European sugar beet factory during the thick juice campaign
From the technical sucrose crystallization point of view, the three stage crystallization scheme is regarded as the standard scheme. The process of producing sugar is through several stages, because the high concentration of non-sugar and the
Results and discussion |
84 |
increase of solution viscosity hinder the sugar separation from the mother liquor. Generally, in the most systems of beet sugar crystallization, the after product sugars (C- sugar) are dissolved and recycled to the first crystallization stage, where they are added to the thick juice (Figure 60). In addition, in other systems, the C-sugar is sent to the second stage. This means, if sugar syrup contains a considerable amount of dextran, the dextran levels in after product sugar will be increased, consequently, the dextran levels in the previous crystallization stage increase continuously.
From the abovementioned results (comp. chapter 4.4, Figure 33 and Figure 34), 1720 % of the dextran remains in the after product. So, in this case, the amount of the dextran, which is recycled to the first crystallization stage, can be calculated. This is important as this dextran increases the original dextran level in thick juice (syrup). For example, if dextran level in syrup is 1000 mg/kg DS, the dextran level in the after product will be about 170 to 200 mg/kg DS. Consequently, the dextran level in syrup becomes about 1170-1200 mg/kg DS. However, this increase can only be characterized qualitatively in this work, as the remaining dextran depends for example on the number of crystallization stages and on the industrial period. Also, the relation between dextran in syrup and dextran in sugar (comp. Figure 33) depends on parameters of centrifugation process.
Results and discussion |
85 |
VaporBrüden5 |
5 |
|
|
|
|
|
|
|
|
|
|
|
|
R |
|
|
|
|
|
|
|
|
|
|
|
|
|
|
|
R |
3630 |
|
|
|
|
|
R |
|
|
|
|
|
|
|
|
4,42 t/h |
|
|
|
|
|
|
|||
52,05 t/h 3620-9 |
|
|
|
|
|
|
|
10,49 t/h |
|
|
|
|
|
|
|
|
|
|
|||||||||
87,77 kPa |
9 |
|
35,24 t/h R |
|
|
|
|
|
|
|
|
|
|
|
|
|
|
|
|
|
|
||||||
|
|
|
|
|
|
|
|
|
|
|
|
|
|
|
|
|
|
|
|
|
|
||||||
96,4 °C |
|
|
R |
|
|
|
|
|
|
|
|
|
|
|
|
|
|
|
|
|
|
|
|
|
|
||
|
|
|
|
|
|
|
|
|
|
|
|
|
|
|
|
|
|
|
|
|
|
|
|
|
|
|
|
|
|
|
|
|
4284 -1 0 |
|
|
|
|
|
|
|
|
|
|
|
|
|
|
|
|
|
|
|
|
|
|
|
|
|
|
|
R |
|
|
CKondensation |
|
|
|
|
|
CondensationKondensation |
|
|
|
|
|
|
|
CondensationKondensation |
|||||
|
|
|
|
|
42 64 -10 |
|
|
|
|
|
|
|
|
|
|
|
|
|
|
|
|
|
|
|
|
|
|
|
|
|
|
|
|
|
|
3770-0 |
|
|
|
|
|
|
|
4334-0 |
|
|
|
|
|
|
|
|
|
4344-0 |
|
Dicksaft |
|
3910-0 |
3000 |
|
|
|
|
|
|
|
|
|
|
|
|
|
|
|
|
|
|
|
|
|
|
|
|
Thick juice |
|
|
9 |
|
|
|
|
|
|
|
|
|
|
|
|
|
Affinatio |
|
|
|
|
|
|
|
|
|
|
Dissolved Raw |
|
|
|
|
|
|
|
|
|
|
|
|
|
|
|
|
|
|
|
|
|
|
|
||||
|
|
|
|
|
|
|
|
|
|
|
|
|
|
run-off |
|
|
|
|
|
After3070 |
|
|
|||||
Rohzucker Kläre |
41 84-0 |
|
|
|
3010 |
|
|
|
|
|
|
|
3040 |
|
Affination |
|
|
|
|
|
|
|
|||||
sugar |
|
|
|
|
|
1 |
W hite |
|
|
|
|
|
|
1 |
Raw |
|
Ablauf |
|
|
|
1 |
productNach- |
|
|
|||
|
|
|
|
|
|
|
Weiß- |
|
|
|
|
|
|
|
Roh- |
|
|
|
|
|
|
|
|||||
NachproduktDissolved AfterKläre 41 74-0 |
|
|
|
sugar |
|
|
|
|
|
|
|
sugar |
|
|
|
|
|
|
produkt |
|
|
||||||
|
|
|
zucker |
3740-3 |
|
|
|
|
|
|
zucker |
3740-1 |
4054-0 |
|
|
|
|
|
3740-5 |
|
|||||||
product |
Staub |
|
|
190,01 t/h |
0 |
|
|
|
|
|
|
|
0 |
|
|
|
|
|
|
|
|
0 |
|
|
|
||
|
43 14-0 |
|
151,94 t/h |
|
|
|
|
75,49 t/h |
|
63,94 t/h |
|
|
|
|
38,60 t/h |
|
|
33,75 t/h |
|
||||||||
|
Dust |
|
|
|
|
|
|
|
|
|
|
|
|
|
|
||||||||||||
|
|
|
0 |
3870 |
8 |
80,0 °C |
70,0 °C |
7-3630 |
R 0 |
4284 |
8 |
82,0 °C |
|
75,0 °C |
R 9-3630 |
0 |
|
8 |
87,0 °C |
|
|
|
80,1 °C |
|
|||
|
|
|
|
9 |
|
|
|
|
1 0 |
9 |
|
|
|
|
1 0 |
4264 |
9 |
|
|
|
|
|
|
|
|||
|
|
|
|
|
4194 |
|
|
|
|
|
|
|
|
|
|
|
|
|
|
|
|
|
|
|
|
|
|
|
|
|
|
|
|
|
|
|
|
|
|
|
|
|
|
Condensate |
|
|
|
|
|
|
3080 |
|
After product |
||
|
|
|
|
|
|
|
|
Condensate |
|
|
|
|
|
|
|
|
|
|
|
|
|
|
|
Nachprodukt |
|||
|
|
|
|
|
|
|
|
|
|
|
|
|
|
Kondensat |
9 |
|
|
|
|
|
|
|
|
Kristalisatorcrystallizer |
|||
|
|
|
|
|
|
|
Kondensat |
|
|
|
|
|
|
3055 |
|
|
|
|
|
|
|
|
|||||
|
|
|
|
|
Weißzucker |
|
R |
|
|
Rohzucker |
|
R |
|
|
|
|
|
|
|
|
|
|
|
||||
|
|
|
|
|
0 1 |
|
|
|
0 1 |
|
|
|
|
|
|
|
|
|
|
|
|
||||||
|
|
|
|
|
White sugar |
|
|
|
Raw sugar |
|
|
|
|
|
|
|
|
|
|
|
|
|
|
||||
|
|
|
|
|
Zentrifuge |
4294 |
|
|
|
Zentrifuge |
3050 |
|
|
|
|
|
|
|
|
|
C |
ate |
|
||||
|
|
|
|
|
centrifuge |
|
|
|
centrifuge |
|
|
|
|
|
|
|
|
|
|
|
|
||||||
|
|
|
|
|
|
|
|
|
|
|
|
|
|
|
|
|
|
|
|
|
|
|
|
|
Kondensat |
|
|
|
|
|
|
|
|
|
|
|
|
|
|
|
|
|
|
|
|
|
|
After |
|
|
|
|
R |
|
|
|
|
|
|
|
|
|
|
|
|
|
|
|
|
|
|
|
|
|
|
|
|
|
|
|
|
||
|
|
|
|
|
|
|
|
|
|
|
|
|
|
|
|
|
|
Nachprodukt |
0 |
1 |
|
|
|||||
|
|
|
|
|
|
|
|
|
|
|
|
|
|
|
|
|
|
|
|
product |
|
|
|
|
|
||
|
|
|
|
|
R |
|
|
|
|
Thin juice |
|
|
|
|
R |
Zentrifuge |
|
3090 |
|
|
|
||||||
|
|
|
|
|
|
|
|
|
|
|
|
|
|
|
centrifuge |
|
|
|
|
|
|||||||
|
|
|
|
|
4074-0 |
|
|
|
|
|
Dünnsaft |
|
0 |
|
|
|
|
|
|
|
|
0 |
|
|
Molasse |
||
|
|
|
|
|
|
|
|
|
|
|
|
|
2 28 -9 |
|
|
|
|
|
|
|
|
|
|
||||
|
|
|
|
|
|
|
|
|
|
|
|
|
R |
|
|
|
|
|
|
|
|
|
|
|
|
|
Melasse |
|
|
|
|
|
1 |
|
0 |
|
|
|
|
|
|
|
1 |
|
|
|
|
|
|
|
|
1 |
|
|
|
|
|
|
|
|
AIR |
3100 |
AIR/ |
|
|
|
|
|
|
4184 |
|
|
|
|
|
|
|
|
4064 |
|
|
18,99 t/h |
|
|
|
|
|
|
|
|
|
|
|
|
|
|
|
|
|
|
|
|
|
|
|
|
|
||||
|
|
|
|
|
|
|
VA POR |
|
|
Rohzucker |
|
|
|
|
|
|
|
|
|
|
|
|
|
||||
|
|
|
|
|
|
|
|
|
|
|
|
|
|
|
|
|
|
|
|
|
Condensate |
60,00% Pur |
|||||
|
|
|
|
|
3740-7 |
|
|
|
Dissolved |
|
|
|
|
|
|
|
|
|
|
|
|
Kondensat |
|||||
|
|
|
|
|
|
|
|
|
|
|
Kläre |
|
38 70 -6 |
|
|
|
|
|
|
|
|
|
|
|
R |
|
|
|
|
|
|
|
|
|
|
|
Raw sugar |
|
|
|
|
|
|
|
|
|
|
0 |
1 |
|
|
||||
|
|
|
|
|
|
4304 |
|
White sugar |
|
|
|
|
|
|
|
|
|
|
|
|
|
|
|
|
|
|
|
|
|
|
|
|
|
Weißzucker |
|
|
|
|
|
|
|
|
|
|
|
|
|
|
4054 |
|
|
|
|||
|
|
|
|
|
R |
9 |
|
77,37 t/h |
|
|
|
|
|
|
|
|
|
|
|
|
|
|
|
|
4264 -8 |
|
|
|
|
|
|
|
0 |
|
|
|
|
|
|
|
|
|
|
|
|
|
|
|
|
|
|
|
|||
|
|
|
|
|
|
4314 |
99,99% Purity |
|
|
|
|
|
|
|
|
|
|
|
|
|
|
|
|
|
|
||
|
|
|
|
|
|
1 |
|
|
|
|
|
|
|
|
|
|
Dünnsaft |
|
|
|
|
|
|
||||
|
|
|
|
|
|
|
|
|
|
|
|
|
|
|
|
|
R |
|
0 |
|
|
|
|||||
|
|
|
|
|
3870-5 |
|
|
|
|
|
|
|
|
|
|
Thin juice |
|
228-7 |
1 |
|
|
|
|
||||
|
|
|
|
|
|
|
|
|
|
|
|
|
|
|
|
|
|
|
|
|
|
|
|
4174 |
|
|
|
|
|
|
|
|
|
|
|
|
|
|
|
|
|
|
|
|
Nachprodukt |
|
|
|
|
|
|
||||
|
|
|
|
|
|
|
|
|
|
|
|
|
|
|
|
Dissolved |
|
|
|
387 0-3 |
|
|
|
|
|
||
|
|
|
|
|
|
|
|
|
|
|
|
|
|
|
|
|
Kläre |
|
|
|
|
|
|
|
|
|
|
|
|
|
|
|
|
|
|
|
|
|
|
|
|
|
|
After product |
|
|
|
|
|
|
|
||||
Figure 60: 3-product scheme of crystallisation
