- •1 Introduction and outline
- •2 Review of literature
- •2.1 Structure of dextran
- •2.2 Microbial loading in sugar factories
- •2.3 The common methods of dextran fractions determination
- •2.4 Dextran content during the process of sugar production
- •2.5 Dextrans associated with processing problems
- •2.6 Crystallization process
- •2.6.1 Growth rate of sucrose crystals
- •2.6.2 Crystallization kinetics
- •2.6.3 Parameters influencing crystallization kinetics
- •2.6.4 Crystal morphology
- •2.7 The Economic gain
- •3 Material and methods
- •3.1 Material
- •3.2 Analytical methods
- •3.2.1 Determination of dextran
- •3.2.1.1 Robert method
- •3.2.1.2 Haze method
- •3.2.2 Microbiological experiments
- •3.2.2.1 Isolation
- •3.2.2.2 Identification
- •3.2.2.2.1 Gas and acid formation
- •3.2.2.2.2 Catalase test
- •3.2.2.2.3 Gram characteristics (KOH-Test)
- •3.2.2.2.4 Identification by API 50 CHL test
- •3.2.2.2.5 L/D-Lactic acid test
- •3.2.3 Crystallization experiments
- •3.2.3.1 Measurement of growth rate of sucrose crystals
- •3.2.3.1.1 Required amount of dextran and seed
- •3.2.3.1.2 Calculation of the growth rate of sucrose crystals:
- •3.2.3.2 Dynamic viscosity
- •3.2.3.3 Crystal morphology and surface topography
- •3.2.3.4 Image analysis
- •3.2.4 Statistical analysis
- •4 Results and discussion
- •4.1 Sensitivity and accuracy of different methods for the determination of dextrans of varying molecular mass
- •4.1.1 Robert’s Copper method sensitivity
- •4.1.2 Haze method sensitivity
- •4.2 Microbial sources of dextran an identification of relevant microorganisms in sugar factories
- •4.3 Levels of dextran contents in different sugar beet factories
- •4.4 Quality of factory final products and their relationship to the levels of dextran during different industrial periods
- •4.5 Influence of dextran concentrations and molecular fractions on the rate of sucrose crystallization in pure sucrose solutions
- •4.5.1 Influence of different temperatures on growth rate of sucrose crystals in the presence of dextran
- •4.6 Elucidation of crystallization kinetics in presence of dextran molecules
- •4.7 Influence of dextran molecule fractions on sucrose solution viscosity
- •4.8 Influence of dextran on the morphology and surface topography of sucrose crystals in presence of dextran
- •4.8.1 Crystal morphology
- •4.8.2 Surface topography
- •4.9 Technical and technological consequences and future perspectives
- •5 Summary
- •6 References
- •7 Appendix
- •8 C. V. and List of Publications

Results and discussion |
51 |
Table 7: Conclusion of evaluation of Roberts and Haze methods to determine different dextran molecules
Dextran levels |
|
|
|
Dextran molecules |
|
|
|
||
|
|
|
|
|
|
|
|
|
|
|
|
T40 |
|
T500 |
|
T2000 |
|||
|
|
|
|
|
|
|
|
|
|
|
Haze |
|
Copper |
Haze |
|
Copper |
Haze |
|
Copper |
|
|
|
complex |
|
|
complex |
|
|
complex |
|
|
|
|
|
|
|
|
|
|
≤ 500 mg/kg DS |
- |
|
+ |
+ |
|
+++ |
+ |
|
+++ |
1000-2000 mg/kg DS |
+ |
|
++ |
++ |
|
+ |
++ |
|
+++ |
≥ 2000 mg/kg DS |
- |
|
+++ |
++ |
|
+ |
++ |
|
+++ |
|
|
|
|
|
|
|
|
|
|
-not sensitive, + low sensitive, ++ sensitive, +++ high sensitive
4.2Microbial sources of dextran an identification of relevant microorganisms in sugar factories
In this chapter, the isolation and identification of Leuconostoc mesenteroides from sugar beet factories is described. In contrast to other lactic acid bacteria, Leuconostoc sp. can tolerate fairly high concentrations of salt and sugar (up to 50% sugar) and initiates growth in vegetables more rapidly over a range of temperatures than any other lactic acid bacteria. It produces carbon dioxide and acids which rapidly lower the pH (Battcock and Ali, 1998). Furthermore, it produces high molecular mass polysaccharides such as dextran, which causes many problems during the industrial process in sugar factories.
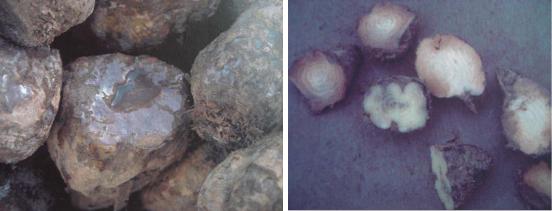
Climatic conditions and harvesting method as well as storage place in sugar factories are important factors influencing the deterioration of sugar beet by microorganisms. The raw materials are vulnerable to enzymatic deterioration or microbial action (Figure 24). Usually, in this regard hand-harvested sugar beet has a lower deterioration rate after harvest than machine-harvested, whereas, the machine causes a cutting of sugar beets through the harvesting. This means, they are vulnerable to attack rapidly from the microorganisms.

Results and discussion |
52 |
Figure 24: Deteriorated sugar beet after harvesting
The enumeration of microorganisms in the collected samples (sugar beet, cossettes and raw juice from beet sugar factory) after incubation on MRS-Agar at 30°C for 48 hours was performed. The mean counts of colonies were 2.5*103 cfu/g of the good sugar beet sample. On the other hand, they were 34*103 cfu/g in the deteriorated sugar beet.
Also, the results indicate that the count of microorganisms was reduced in cossettes samples. Due to the more efficient washing procedure and lower initial soil loading in beet processing there is less extraneous material brought into the factory. The mean of total microorganism colonies in these beet sugar cossettes were almost 6*102 cfu/g and they were found only in the dilutions 10-1 and 10-2.
It was observed that the number of microorganisms increased in raw juice after extraction process. In the first day of the sugar beet manufacture, the number of colonies in raw juice was 23*104 cfu/g. On the other hand, in the second and third days, the microbial count increased to 4*106 and 3.5*105 cfu/g, respectively. This increase was may be due to starting microbial contamination and an underdosed usage of antimicrobial agents.
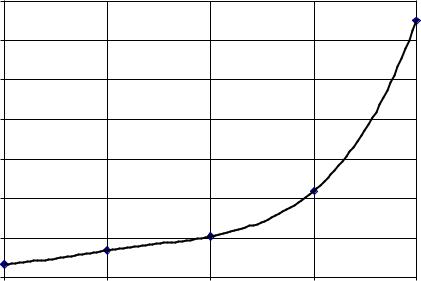
Figure 25 shows the relationship between growth of microorganisms and storage time of sugar beet raw juice at room temperature. The counting of microorganisms in the first time was 3.35*103 cfu/g, but after 1, 2, 3 and 4 hours it was 3.35*103, 6.9*103, 2.2*104 and 6.5*104 cfu/g, respectively. The suitable sugar concentration, pH and temperature of raw juice apparent in an industrial surrounding contribute greatly to the increase in the rate of growth of microorganisms. Day, (1992) reported similar

Results and discussion |
53 |
results. Also he described that during raw juice extraction in the diffuser a decrease of the cossettes temperatures can occur, if a large percentage of damaged beets are processed or the usual capacity of the extraction device is exceeded. Consequently, the bacterial loading increases.
|
|
70000 |
|
|
|
|
|
|
60000 |
|
|
|
|
Number of microorganisms |
colonies in (cfu/g) |
50000 |
|
|
|
|
40000 |
|
|
|
|
||
30000 |
|
|
|
|
||
20000 |
|
|
|
|
||
|
|
|
|
|
|
|
|
|
10000 |
|
|
|
|
|
|
0 |
|
|
|
|
|
|
0 |
1 |
2 |
3 |
4 |
Time (hours)
Figure 25: Microorganisms growth in sugar beet raw juice at room temperature
The colonies morphology of isolated strains and cultural conditions are shown in Appendix 1. The results show that 14 microorganism strains were isolated from the collected samples Classical identification revealed the presence of seven bacteria strains. The other colonies were yeasts and fungi. In this study, the identification of
Leuconostoc mesenteroides subsp. mesenteroides, which produces the dextrans, was in the focus of interest.
On the basis of classical phenotypic analysis, all of isolated bacteria strains were Gram-positive and gas forming (except S3 no gas formation). However, S1, S5, S12, S13 and S14 were catalase negative while S2, S4 were catalase positive. In addition, all strains produced acid from glucose (See Appendix 2).
The fermentation pattern of carbohydrates gives other keys for strain identification. Fermentation patterns or profiles and biochemical characteristics were determined
Results and discussion |
54 |
using API 50 CHL (BioMérieux) for Leuconostoc ssp. The fermentation pattern allows the isolate to be identified comparing the pattern to the characteristics of the type strains. Even in optimized conditions, the change of color may sometimes take so long for a given strain that it is difficult to conclude whether there is a positive or negative reaction. Therefore, in this work, follow-up the color changing has taken several days (five days). Identification results were obtained with the aid of the API identification table (Bio Merieux) (see Appendix 3). From the five isolated bacteria strain, the strain S1 belonged to the species Leuconostoc mesenteroides subspecies mesenteroides/dextranicum. Another isolated strain could not be identified.
Another key to confirm the isolated Leuconostoc m. is the determination of produced D-/L-lactate. The optical isomer of lactic acid was determined by using a D-/L- lactate dehydrogenase kit. Our results indicated that the amount of D-Lactic acid which produced by strain 1 (S1) was 7.367 g/L. whereas the amount of L-Lactic acid was 0.387 g/L. In this case, the L & D – Lactic acid test confirms that the tested strain was Leuconostoc m.
The morphology of strain 1 (S1) was examined by using scanning electron microscopy (S-4200; Hitachi). Figure 26 shows that the strain 1 cells are spherical and resemble very short bacilli with rounded ends. The size of cells is approximately 0.6 to 1.0 µm. Cells are arranged in single or pairs.
These results are in agreement with Lonvaud-Funel, (1999). He reported that the Leuconostoc cells are often in short chains in nutrient media during the active growth phase, whereas in their natural environment and more stressful conditions the chains zone. From the abovementioned our results can be confirm the strain 1 (S1) is
Leuconostoc mesenteroides subsp mesenteroides which produced dextran molecules in sugar industries.
