- •1 Introduction and outline
- •2 Review of literature
- •2.1 Structure of dextran
- •2.2 Microbial loading in sugar factories
- •2.3 The common methods of dextran fractions determination
- •2.4 Dextran content during the process of sugar production
- •2.5 Dextrans associated with processing problems
- •2.6 Crystallization process
- •2.6.1 Growth rate of sucrose crystals
- •2.6.2 Crystallization kinetics
- •2.6.3 Parameters influencing crystallization kinetics
- •2.6.4 Crystal morphology
- •2.7 The Economic gain
- •3 Material and methods
- •3.1 Material
- •3.2 Analytical methods
- •3.2.1 Determination of dextran
- •3.2.1.1 Robert method
- •3.2.1.2 Haze method
- •3.2.2 Microbiological experiments
- •3.2.2.1 Isolation
- •3.2.2.2 Identification
- •3.2.2.2.1 Gas and acid formation
- •3.2.2.2.2 Catalase test
- •3.2.2.2.3 Gram characteristics (KOH-Test)
- •3.2.2.2.4 Identification by API 50 CHL test
- •3.2.2.2.5 L/D-Lactic acid test
- •3.2.3 Crystallization experiments
- •3.2.3.1 Measurement of growth rate of sucrose crystals
- •3.2.3.1.1 Required amount of dextran and seed
- •3.2.3.1.2 Calculation of the growth rate of sucrose crystals:
- •3.2.3.2 Dynamic viscosity
- •3.2.3.3 Crystal morphology and surface topography
- •3.2.3.4 Image analysis
- •3.2.4 Statistical analysis
- •4 Results and discussion
- •4.1 Sensitivity and accuracy of different methods for the determination of dextrans of varying molecular mass
- •4.1.1 Robert’s Copper method sensitivity
- •4.1.2 Haze method sensitivity
- •4.2 Microbial sources of dextran an identification of relevant microorganisms in sugar factories
- •4.3 Levels of dextran contents in different sugar beet factories
- •4.4 Quality of factory final products and their relationship to the levels of dextran during different industrial periods
- •4.5 Influence of dextran concentrations and molecular fractions on the rate of sucrose crystallization in pure sucrose solutions
- •4.5.1 Influence of different temperatures on growth rate of sucrose crystals in the presence of dextran
- •4.6 Elucidation of crystallization kinetics in presence of dextran molecules
- •4.7 Influence of dextran molecule fractions on sucrose solution viscosity
- •4.8 Influence of dextran on the morphology and surface topography of sucrose crystals in presence of dextran
- •4.8.1 Crystal morphology
- •4.8.2 Surface topography
- •4.9 Technical and technological consequences and future perspectives
- •5 Summary
- •6 References
- •7 Appendix
- •8 C. V. and List of Publications
Results and discussion |
72 |
4.6Elucidation of crystallization kinetics in presence of dextran molecules
From the last chapter it could be seen that dextran has a strong influence on the growth rate of sucrose crystals, especially considering high molecular fractions of dextran. In this chapter, reasons for the influence of dextran on sugar crystallization are discussed and illustrated with additional measurement results.
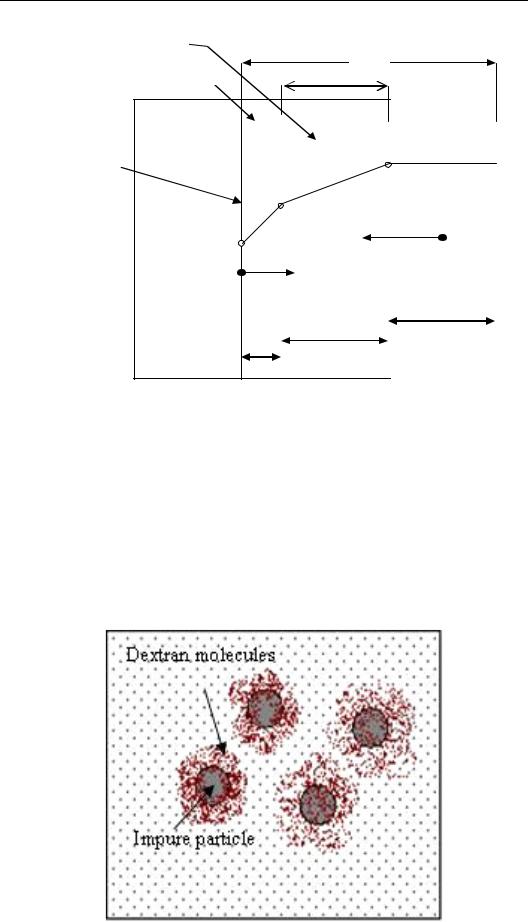
Figure 46 shows a model of sucrose crystallization adapted from Ekelhof, (1997) and Thelwall, (2002). Around the crystal surface a boundary layer exists which consists of three parts. The first boundary layer at the crystal surface is the reaction layer, which has the least supersaturation (CG) as sugar had been removed from the solution and deposited on the crystal. The second boundary layer is the main diffusion layer. Here, there are two different flows in opposite directions. The first one is non-sugar material and water from the exhausted reaction layer moving away from the surface and back to the main mother liquor. The other flow is fresh syrup, which is moving towards the crystal surface. The third and final layer, bulk of solution, is the main body of the mother liquor and is the source of the sucrose molecules for further deposition.
The movement of sucrose molecules through the diffusion layer (d2) depends on the viscosity, which does have an important influence on the crystallization rate, especially in the second boundary layer, as the higher viscosity will reduce the speed of the molecular movement to and from the crystal surfaces (compare results in chapter 4.7).

Results and discussion
Diffusion layer
Reaction layer
Crystal
Surface area
73
λ
|
|
|
|
δ |
|
|
|
|
|
|
|
|
|
|
|
|
|
|
kR |
|
|
kD |
|
|
||
|
|
|
|
|
||||
|
|
|
|
cG |
cL |
|
||
|
|
|
|
|
solution |
|||
|
cSat |
|
|
|
|
|
|
|
|
|
NS & |
|
|
Sucrose |
|||
|
|
|
|
|
||||
|
|
|
|
|
|
|||
|
|
|
Water |
|
|
|
||
|
|
|
|
|
|
|
d3 |
|
|
d1 |
|
d2 |
|
||||
|
|
|
|
|||||
|
|
|
|
|
|
|
|
|
|
|
|
|
|
|
|
|
|
Figure 46: The scheme of the two processes of diffusion and surface reaction. 2λ = gap between crystals, λ = half distance between crystals,δ = thickness of the boundary layer, kD = diffusion coefficient, kR = surface reaction, NS = non-sugar, CL, CG, CSat are the sucrose concentrations of liquor, boundary layer and saturation at the crystal-solution interface.
Also, in impure sucrose solutions (sugar cane or beet syrup), dextran molecules are adsorbed on the impure particles, consequently, the solution viscosity increases and, additionally, the movement of sucrose molecules destined to crystal surfaces is impeded (s. Figure 47). Hence the high molecular weight and the adsorption of dextran affect the growth rate and the quality of sucrose crystals negatively.
Figure 47: Dextran adsorption on impure particles

Results and discussion |
74 |
These model suggestions are in accordance to Cossairt, (1982). He demonstrated that some impurities are physically adsorbed on the different faces of the crystals in varying and selective amounts. A portion of lattice sites becomes blocked; thereby it comes to reduction or retardation of crystal growth.
4.7Influence of dextran molecule fractions on sucrose solution viscosity
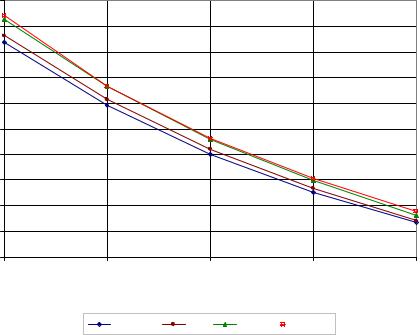
In this work, the solution viscosity is a determining parameter for diffusion phenomena during crystallization of sucrose. Figure 48 demonstrates the influence of dextran molecular weight fractions T40, T500 and T2000 on the dynamic viscosity (η) of sucrose solutions (WDS = 60 %) at different temperatures (50-70°C). At 50°C the dynamic viscosity of sucrose syrup was 14.35 mPa.s for control. On the other hand, it was 14.63, 15.26 and 15.39 mPa.s with 1500 mg/kg DS dextran T40, T500 and T2000 additions, respectively. In addition, an increase of solution temperature to 70°C reduced the solution viscosity by 50 %.
|
16 |
|
|
|
|
|
15 |
|
|
|
|
|
14 |
|
|
|
|
|
13 |
|
|
|
|
η mPa.s |
12 |
|
|
|
|
11 |
|
|
|
|
|
10 |
|
|
|
|
|
|
|
|
|
|
|
|
9 |
|
|
|
|
|
8 |
|
|
|
|
|
7 |
|
|
|
|
|
6 |
|
|
|
|
|
50 |
55 |
60 |
65 |
70 |
Temperature (°C)
Control |
T40 |
T500 |
T2000 |
Figure 48: Influence of addition of 1500 mg/kg DS of T40, T500 and T2000 dextran on the dynamic viscosity of a 60% sucrose solution between 50 and 70 °C
The results elucidate that at low temperatures dextran fractions T2000 and T500 have more effect on solution viscosity than T40. However, the differences are reduced at

Results and discussion |
75 |
high temperatures. That illustrates the decrease of the diffusion rate in the mother liquor during crystallization process in presence of high molecular weight fractions of dextran (Figure 46).
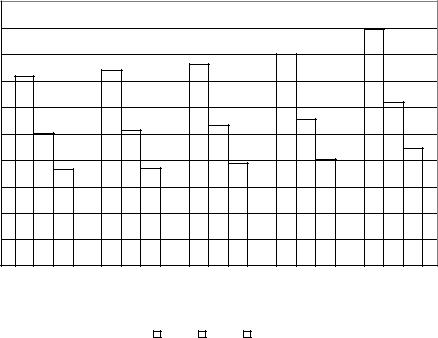
Figure 49 shows the relationship between dextran addition and solution viscosity at different temperatures. At 50 °C the solution viscosities increased after addition of 500, 1500, 2500 and 5000 mg/kg DS of dextran T2000 by 2.9 %, 6.45 %, 11.70 % and 24.73 %, respectively. An increase of temperature from 50 to 70°C reduced the solution viscosity to almost 50 % for all additions.
η (mPa.s)
20
18
16
14
12
10
8
6
4
2
0
Control |
500 |
|
1500 |
2500 |
5000 |
|
|
Dextran contents (mg/kg DS) |
|
||||
|
|
|
|
|
|
|
|
|
50°C |
60°C |
70°C |
|
|
|
|
|
|
|
|
|
Figure 49: Influence of different dextran concentrations (500, 1500, 2500, 5000 ppm) on the dynamic viscosity at different temperatures (50-70°C)
The effects of dextran are not only of importance during the crystallization process, but also after the centrifugation process and during the drying operation of the sucrose crystals. These steps as well determine the quality of the resulting sucrose crystals. Figure 50 shows the crystal surface during the drying process.
