- •1 Introduction and outline
- •2 Review of literature
- •2.1 Structure of dextran
- •2.2 Microbial loading in sugar factories
- •2.3 The common methods of dextran fractions determination
- •2.4 Dextran content during the process of sugar production
- •2.5 Dextrans associated with processing problems
- •2.6 Crystallization process
- •2.6.1 Growth rate of sucrose crystals
- •2.6.2 Crystallization kinetics
- •2.6.3 Parameters influencing crystallization kinetics
- •2.6.4 Crystal morphology
- •2.7 The Economic gain
- •3 Material and methods
- •3.1 Material
- •3.2 Analytical methods
- •3.2.1 Determination of dextran
- •3.2.1.1 Robert method
- •3.2.1.2 Haze method
- •3.2.2 Microbiological experiments
- •3.2.2.1 Isolation
- •3.2.2.2 Identification
- •3.2.2.2.1 Gas and acid formation
- •3.2.2.2.2 Catalase test
- •3.2.2.2.3 Gram characteristics (KOH-Test)
- •3.2.2.2.4 Identification by API 50 CHL test
- •3.2.2.2.5 L/D-Lactic acid test
- •3.2.3 Crystallization experiments
- •3.2.3.1 Measurement of growth rate of sucrose crystals
- •3.2.3.1.1 Required amount of dextran and seed
- •3.2.3.1.2 Calculation of the growth rate of sucrose crystals:
- •3.2.3.2 Dynamic viscosity
- •3.2.3.3 Crystal morphology and surface topography
- •3.2.3.4 Image analysis
- •3.2.4 Statistical analysis
- •4 Results and discussion
- •4.1 Sensitivity and accuracy of different methods for the determination of dextrans of varying molecular mass
- •4.1.1 Robert’s Copper method sensitivity
- •4.1.2 Haze method sensitivity
- •4.2 Microbial sources of dextran an identification of relevant microorganisms in sugar factories
- •4.3 Levels of dextran contents in different sugar beet factories
- •4.4 Quality of factory final products and their relationship to the levels of dextran during different industrial periods
- •4.5 Influence of dextran concentrations and molecular fractions on the rate of sucrose crystallization in pure sucrose solutions
- •4.5.1 Influence of different temperatures on growth rate of sucrose crystals in the presence of dextran
- •4.6 Elucidation of crystallization kinetics in presence of dextran molecules
- •4.7 Influence of dextran molecule fractions on sucrose solution viscosity
- •4.8 Influence of dextran on the morphology and surface topography of sucrose crystals in presence of dextran
- •4.8.1 Crystal morphology
- •4.8.2 Surface topography
- •4.9 Technical and technological consequences and future perspectives
- •5 Summary
- •6 References
- •7 Appendix
- •8 C. V. and List of Publications
Results and discussion |
44 |
4 Results and discussion
4.1Sensitivity and accuracy of different methods for the determination of dextrans of varying molecular mass
In this work the sensitivity and accuracy of some common dextran determination methods is examined in order to select the most appropriate for application in sugar factories. In this context it must be mentioned that some important considerations are required to be used in any method used in routine analysis of the sugar factories according to (Singleton, 2002):
¾Accurate: The test needs to be as accurate and reproducible as possible within the constraints of time and simplicity.
¾Specific: It must quantitatively detect total dextran and must not be biased towards different molecular weights
¾Rapid: The test must be able to cope with the high throughput of samples arriving at factories and allow process decisions to be made quickly.
¾Simple: To circumvent special training and employment of skilled staff for repetitive testing the test must be easy to perform. To reduce sample time sample preparation should also be straightforward and quick.
4.1.1Robert’s Copper method sensitivity
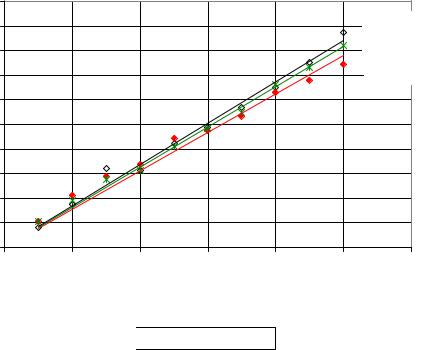
It is very important to determine the amount of dextran in solution, performing a standard curve with pure dextran solutions. Figure 17 shows the standard curves of different dextran molecular fractions: T40, T500 and T2000. The results indicate that the difference between low and high dextran molecular mass fractions increased beginning at a dextran concentration ≥ 0.09 mg/ml. However, no significant differences between all dextran standards were observed except at high dextran concentrations.

Results and discussion |
45 |
|
1 |
|
|
|
|
|
|
|
0.9 |
|
|
|
|
|
R2 = 0.9863 |
|
0.8 |
|
|
|
|
|
R2 = 0.9933 |
Abs.(485nm) |
0.7 |
|
|
|
|
|
R2 = 0.9687 |
0.6 |
|
|
|
|
|
|
|
0.5 |
|
|
|
|
|
|
|
0.4 |
|
|
|
|
|
|
|
|
|
|
|
|
|
|
|
|
0.3 |
|
|
|
|
|
|
|
0.2 |
|
|
|
|
|
|
|
0.1 |
|
|
|
|
|
|
|
0 |
|
|
|
|
|
|
|
0 |
0.02 |
0.04 |
0.06 |
0.08 |
0.1 |
0.12 |
|
|
|
Dex. conc. (mg/ml) |
|
|
||

 T40
T40  T500
T500  T2000
T2000
Figure 17: Standard Curves of dextran T40, T500 and T2000 by copper complex method.
From the mean of dextran standard curves, the dextran concentrations can be calculated as follows:
|
mDE |
= |
a −0.033 |
|
(4-1) |
|
|
||||
|
|
7.6663 |
|
|
|
where |
|
|
|
|
|
mDE |
Concentration of dextran (mg/ml) |
|
|||
a = Sample extinction at 485nm.
From the present results, it can be indicated that the standard curve of dextran T2000 matched the measurement data for all molecular mass fractions better than other curves, whereas R2 for T40 and T500 standard curves were 0.9863 and 0.9687, respectively, while for T2000 was 0.9933. Consequently, in practical applications the standard curve for T2000 was applied for all measurements to simplify the calibration of measurement process, since it is an average of the other molecular weight curves.
Results and discussion |
46 |
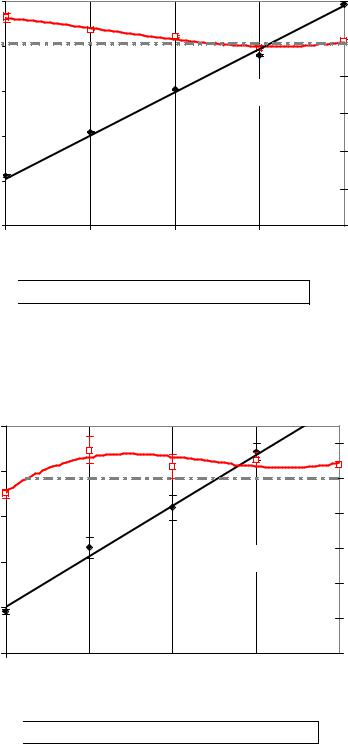
Figure 18 to Figure 20 show the patterns of dextran measured by the Robert’s method and its recovery percentages in relation to the actual dextran added to sucrose solutions for three different molecular mass fractions of dextran (T40, T500 and T2000). The results indicated that the measured dextran was highly correlated with actual ones (R2 > 0.993) whereas the recovery percentage exhibited variable correlations (-0.891, 0.483 and 0.95 for T40, T500 and T2000, respectively). The values of recovery percentage were testified against 100 % using least sum of square referring to T2000 treatment to be the most accurate since its least sum of squares was the lowest (109.64).
The patterns of variations in the recovery percentages under the effects of dextran concentrations and dextran molecular weights were considered. The latter factor and interaction with the concentration were significant (P < 0.01). The concentrations as a factor have an insignificant effect on the recovery percentages (P = 0.062). Regarding the measured dextran another pattern of variation was recorded since the concentration and molecular weight main effects were significant (P<0.0001) with insignificant interaction (P = 0.053) referring to their independence.
The results indicated that, at especially at low concentrations of the low molecular dextran fraction T40 Robert’s method overestimated the dextran concentration. At medium and high concentration recovery was satisfying for all dextran fractions.

Results and discussion |
47 |
|
2500 |
|
|
|
120 |
|
DS) |
2000 |
|
|
|
100 |
|
|
|
|
|
|
||
|
|
|
|
|
Dext.recovery (%) |
|
Dex.measured (mg/kg |
1500 |
|
|
R2 = 0.9974 |
80 |
|
|
|
|
||||
|
|
|
|
60 |
||
1000 |
|
|
|
40 |
||
|
|
|
|
|||
500 |
|
|
|
20 |
||
|
|
|
|
|
|
|
|
0 |
|
|
|
0 |
|
|
500 |
1000 |
1500 |
2000 |
2500 |
|
|
|
Dextran present (mg/kg DS) |
|
|
||

 Dex.measured (mg/kg DS)
 Dex.recovery (%)
Figure 18: Sensitivity of copper complex method to determine dextran T40 in sucrose solutions
|
2500 |
|
|
|
|
|
|
|
|
|
|
120 |
|
DS) |
2000 |
|
|
|
100 |
|
Dext. measured (mg/kg |
|
|
|
|
Dex. recovery (%) |
|
1500 |
|
|
|
80 |
||
1000 |
|
R2 |
= 0.9952 |
60 |
||
|
|
|||||
500 |
|
|
|
40 |
||
|
|
|
20 |
|||
|
|
|
|
|||
|
|
|
|
|
|
|
|
0 |
|
|
|
0 |
|
|
500 |
1000 |
1500 |
2000 |
2500 |
|
|
|
Dextran present (mg/kg DS) |
|
|
||

 Dex.measured (mg/kg DS)
 Dex. recovery (%)
Figure 19: Sensitivity of copper complex method to determine dextran T500 in sucrose solutions
