

brechignac_f_desmet_g_eds_equidosimetry_ecological_standardi
.pdf391
Table 1. Biological indices used for an estimation of ionizing radiation and cadmium influence on organism
1 |
Enterocyte height |
|
|
|
|
Duodenum |
|
|
|
||
27 |
Content of malondialdehyde |
||||
2 |
Jejunum |
|
|
(small intestine) |
|
|
Enterocyte nuclear area |
|
28 |
||
|
|
Rate of MDA accumulation in |
|||
3 |
Duodenum |
|
|||
|
|
small intestine |
|||
4 |
Jejunum |
|
|
||
|
|
Lipid content (liver) |
|||
5 |
Hepatocyte nuclear diameter |
|
29 |
||
|
Triacylglyceroles |
||||
|
Mitotic index |
|
|||
6 |
|
30 |
Phospholipids |
||
Duodenum |
|
||||
7 |
Jejunum |
|
31 |
Cholesterol |
|
|
Cell quantity in kripta |
|
|
|
|
8 |
|
|
Lipid content (small |
||
Duodenum |
|
|
intestine) |
||
9 |
Jejunum |
|
|
|
|
|
32 |
Triacylglyceroles |
|||
|
Enzyme activity in liver |
|
|||
|
|
33 |
Phospholipids |
||
10 |
Alkaline phosphatase |
|
|||
|
34 |
Cholesterol |
|||
11 |
ϑ-Glutamyltransferase |
|
|||
12 |
Alanine aminotransferase |
|
|
Lipid content (enterocyte |
|
|
Enzyme activity in blood serum |
|
|
plasma membrane) |
|
13 |
Alkaline phosphatase |
|
|
|
|
35 |
Triacylglyceroles |
||||
14 |
ϑ-Glutamyltransferase |
|
|
|
|
36 |
Phospholipids |
||||
15 |
Alanine aminotransferase |
|
|
|
|
|
37 |
Cholesterol |
|||
|
Enzyme activity in small |
|
|||
|
|
|
Lipid content (blood serum) |
||
|
intestine |
|
|
||
|
|
|
38 |
Triacylglyceroles |
|
16 |
Alkaline phosphatase |
||||
17 |
ϑ-Glutamyltransferase |
|
39 |
Phospholipids |
|
18 |
Alanine aminotransferase |
|
40 |
Cholesterol |
|
|
Content of sulfhydryl groups |
|
|
|
|
|
41 |
High density lipoproteins |
|||
19 |
Liver |
||||
|
42 |
Low density lipoproteins |
|||
20 |
Small intestine |
|
|||
|
43 |
Very low density lipoproteins |
|||
|
Content of lipid peroxidation |
|
|||
|
|
|
Antioxidative activity |
||
|
products |
|
44 |
||
21 |
Diene conjugates (liver) |
|
Liver |
||
22 |
Diene conjugates (small |
|
45 |
Small intestine |
|
|
intestine) |
|
|
|
|
|
|
|
Na+,K+–ATPase activity : |
||
23 |
Schiff bases (liver) |
|
46 |
||
|
Liver |
||||
24 |
Schiff bases (small intestine) |
|
|||
|
47 |
Small intestine |
|||
25 |
Content of malondialdehyde |
|
|||
|
|
Mg2+–ATPase activity: |
|||
26 |
(liver) |
|
|
||
|
48 |
Liver |
|||
|
Rate of MDA accumulation in |
|
|||
|
|
49 |
Small intestine |
||
|
liver |
|
|||
|
|
|
|

392
Technically, the problem of PCA consists in the following. In an early stage of investigation, wherever possible, the researcher has to collect all available data
x k x k `N |
1 |
, which are presumably reflect the effects of external influence on the system |
n n |
|
(k). Furthermore, the linear transformation of primary data U ukj ` can be found, started
from the assumption of more concise description of this multivariate sample by means of a few informative secondary quantities. Strictly speaking, such condition does not provide the only choice of transformation U, because any reasonable objective function is allowed. However, in many instances the optimal criterion consists in the requirement of mutual non-correlatedness of transformed variables. This case is an equivalent to the primary condition of maximum exhaustion of observed correlation by minimum set of used variables zi, and it directly leads to the PCA. The desired transformation U can be found uniquely: it is a discreet analogue of decorrelating Karhunen-Loeve transform of random processes [12]. This unitary transformation
U |
z |
n |
`N |
isdefined by eigenvalue equation for correlation matrix G |
> x |
i |
x |
j |
N |
: |
||||
|
|
n 1 |
|
|
|
|
|
|
|
i,j |
1 |
|||
|
|
|
|
|
|
|
|
Gzn Οnzn |
|
|
|
|
|
(1) |
In |
principal |
component |
|
representation matrix G becomes |
|
|
diagonal, |
|||||||
~ |
U GU |
diag >Ο |
|
N |
|
`, and the average contribution of every component zn |
||||||||
G |
n |
|
1 |
|||||||||||
|
|
|
|
|
n |
|
|
|
|
|
|
|
||
into the whole data set x k ` is determined by the correspondent eigenvalue Οn. This
permits |
to select the bounded subset of the most significant components |
||
z |
n |
`M |
, M N , so that the projection on them of the whole sample x k ` ensures |
|
n 1 |
|
|
the required level of accountable correlations.
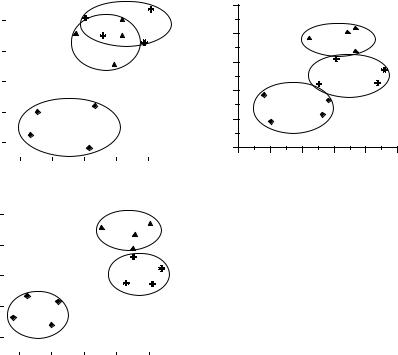
It is convenient to treat the results of the analysis in geometrical representation. For this purpose every data vector is represented in the M-dimensional sample subspace (usually Mδ3). In this subspace the vector coordinates an , are the coefficients of its expansion in the eigenvectors zn:
N |
|
x ¦anzn |
(2) |
n 1 |
|
A point, the totality of which forms the scatter diagram of objects under consideration, represents every object vector x in this sign space. By this means certain compact regions of scatter diagram may join together the representatives of the population, which have the same or closely related characteristics. On this interpretation the adequate diagnostics of object state consists in proper classification (space decomposition) of point pattern in sign space.
4. General approach to the quantitative analysis of LDE under combined exposure
Basically, the quantitative estimation of the response of biological objects on the external influence is determined by “dose-response relationship” [1]. Conventional approach to this problem is based on dose-dependent survival value,
393
that is, on the probability PA DA of the event, when given biological object
survives under the dose DA of the external agent A. Based on the information criterion, the information capacity of this event is chosen as its quantitative estimation:
E A lnPA DA |
(3) |
With this definition, combined influence of the agents A and B can be determined as follows. If agents A and B act independently, the total effect of their joint action is equal to the sum of their individual effects, as it follows from the additive property of information:
Padd A; B |
PA DA PB DB |
(4) |
|
Eadd A; B |
E A E B |
||
|
In such a way, the combined action of the agents A and B one can characterize by the
coefficient of synergy Ks [2]: |
E A; B |
|
E A; B |
|
|
|
Ks A; B |
(5) |
|||||
Eadd A; B |
E A E B |
|||||
|
|
|||||
Basically, three situations are possible if the ionizing radiation R and any other external agent A are acting simultaneously:
1. Ks R, A 1. Agent A reduces the biological action of radiation, so that the inhibition, biological antagonism occurs in this case.
2. Ks R, A 1. Agent A does not modify survival value of radiation, – the result of combined action is equal to the direct sum of their independent effects. This is the case of additive action.
3. Ks R, A ! 1. Agent A increases the radiation influence. Combined effect is greater than the sum of independent effects. This situation is known as the synergistic effect, synergy.
It should be pointed out that the assessments based on the coefficient Ks are unusable in LDE study, first of all because of the fact, that the survival probability PA DA in Eq.3 is estimated as the experimental survival rate:
|
P D |
A |
~ 1 |
N A DA |
, |
(6) |
|
|
|
||||||
|
A |
|
|
N |
|
||
where N is |
|
|
|
|
|
||
the total number of |
objects in finite sample of |
laboratory animals, |
|||||
N A DA |
is the number of objects, which have been lost under the influence of the |
||||||
absorbed dose DA. As usually under the small absorbed dose |
N A DA | 0 , the |
||||||
information content of the effect is close to zero. |
|
||||||
Nevertheless, in practice |
there are techniques found, which are directed to |
||||||
quantitative indices different from that of Eq.3. In fact, according to Eq.5 the coefficient Ks basically can be defined by every biological index (effect), if it satisfies
394
two main conditions: 1) effect is dose-dependent, and 2) when external agents act independently, the total effect is additive. Such approach was used, as an example, in Ref. [2], where mutual synergy interaction was estimated for combined action of radiation and hyperthermia in terms other than survival value (such as enzyme activity). However, this criterion is not wholly satisfactory in LDE study, as it operates with any individual biological index, which could not be an effective statistical estimator of object state under these conditions.
Now that we have presented the features of qualitative classification of complex systems by a PCA-based model, we can use it for correct quantitative estimation of combined influence of external agents, as well.
The general concept of quantitative analysis in non-additive interaction of small-dose influences is as follows. Let us assume that the influence of some external
agents A, B, …, presumably consists in the variations of any index of object state xi in |
|||
reference to their values in control group x 0 |
, which can be defined experimentally. In |
||
~ |
i |
|
|
other words, the sample value xi can be represented as: |
|
||
~ |
0 |
Γxi DA ,DB ,... |
(7) |
xi DA ,DB ,... |
xi |
||
Here Γxi DA ,DB ,... is an increment of index xi for the object (object group) under consideration, and DA, DB, …, are the absorbed doses of corresponding agents. Hence, Γxi determines object’s reaction on the influence, and it can be accepted as an effect of action:
|
~ |
E xi A,B,... { Γxi DA ,DB ,... . |
(8) |
||||
Furthermore, if value |
under combined influence of some agents (say, A and B) will |
||||||
xi |
|||||||
be a direct sum of xi 0 |
and increments Γxi DA , Γxi DB : |
|
|||||
|
~ |
|
0 |
|
Γxi DA Γxi DB , |
(9) |
|
|
xi DA ,DB |
xi |
|
||||
it may be concluded that these agents have an additive nature in relation to parameter xi over a range DA, DB of absorbed doses . To the contrary, if the combined action leads to interrelated responses:
Γxi DA ,DB ζ Γxi DA Γxi DB , |
(10) |
we can conclude that the interaction is non-additive (synergistic, antagonistic) in relation to xi. Corresponding quantitative estimation of the combined action of the agents A and B is determined by the coefficient of synergy:
Ks xi A; B |
E xi A; B |
|
Γx |
D |
A |
,D |
B |
|
|
|
||
|
|
{ |
i |
|
|
|
|
(11) |
||||
E xi A E xi B |
Γxi DA Γxi DB |
|||||||||||
|
|
|
||||||||||
Unfortunately, such estimations are usually ineffective in LDE-analysis because of their statistical ambiguity. Moreover, a variety of individual parameters (indices) do not reflect influence effectively and univalently (unically): for the most part quantitative and qualitative changes of system attributes are determined by their totality only.
As a consequence of these features, one can construct an integral analog of the estimation (11) by means of PCA. As we shall see subsequently, in most cases such approach is correct and effective. More importantly, it is especially useful just in LDE study.

395
First of all, principal components maintain additivity under independent action of the agents. Actually, the transformation of data vector x into principal component z is carried out by linear unitary transform U, and if Eq.8 is valid for all observable
values xi, it is true for the coefficients a = >an nN=1 in expansion (2), as well:
a DA ,DB U x 0 Γx DA Γx DB a 0 Γa DA Γa DB (12)
Hence, in this case the influence of external agents is additive for every principal component. With this result, let the coefficient of synergy in relation to principal component zn be defined as:
Kszn A; B |
E zn A; B |
|
Γa |
n |
A,B |
|
(13) |
|
E zn A E zn B |
Γan A Γan B |
|||||||
|
|
|||||||
Contrary to the estimation by individual observable value (10), coefficient Kszn A; B is a certain generalized characteristic of combined action, because it
takes into consideration (with certain factor loads) all observable parameters. Hence, this criterion provides a way for establishment and estimation of such effects in LDE
study, as it reduces experimental statistical error (approximately by a factor of Neff ,
where Neff is the number of effective factor loads), as a result of statistical averaging over the ensemble of independent observable data. But yet, the coefficients
Kszn A; B determined for different components zn describe combined effects
relative to different groups of experimental parameters, because different components have different factor loads. In addition, different components can represent simultaneously both antagonistic and synergetic reaction, if such influence of external agents holds for different groups of object indices. Moreover, coefficient (13) (as for individual coefficient (11) too) may not be definitely positive, since the “effect” itself
may be both positive and negative, Γan! 0 . Logical interpretation of negative-valued
coefficient Ks is not complicated, but its system definition (the opposite tendency of agent action in individual and combined application) invites further investigations in every specific case.
Finally, global estimation of combined influence of external agents could be determined by data vector as follows. In sign space a total reaction of the object is
M
determine by M-dimensional vector δ aM = ¦δ anzn that is, the projection of vector Γa
n=1
on the M-dimensional sign subspace, spanned over the most effective principal components. The overall amount of observed influence could be estimated as a norm of this vector, in other words, as a distance between the points of the object under consideration and the object of control group:

396 |
|
|
|
|
|
|
|
|
396 |
|
|
|
|
|
|
|
|
M |
|
E int A |
|
|
|
ΓaM DA |
|
|
|
{ ¦Γa2j DA , M δ N . |
(14) |
|
|
|
|
||||||
|
|
|
|
|
|
|
|
j 1 |
|
If agents A and B acts independently, calculated additive effect is estimated similarly as the norm of vector sum ΓaM A ΓaM B :
|
|
|
|
|
|
|
|
|
|
|
Eaddint A,B |
|
|
|
ΓaM A ΓaM B |
|
|
|
{ ¦M >Γa j A Γa j B 2 |
(15) |
|
|
|
|
|
|||||||
|
|
|
|
|
|
|
|
|
j 1 |
|
Consequently, global quantitative estimation of combined influence of external agents in LDE study may be done by integral synergy coefficient Ksint :
|
|
|
|
|
|
|
|
|
|
M |
δ a2j |
(A, B) |
|
|
K s(int) = |
E |
(int) (A, B) |
= |
|
|
δ a M (A, B) |
|
|
≡ |
j =1 |
. (16) |
|||
|
|
|
|
|||||||||||
|
|
|
|
|
|
|||||||||
E |
(addint) (A, B) |
|
δ a M (A) + δ a M (B) |
|
M |
(A) |
+ δ a j (B) |
2 |
|
|||||
|
|
|
|
|
|
|||||||||
|
|
|
|
|
|
|
|
|
|
δ a j |
|
|
||
j =1
Coefficient Ksint (Eq.16) describes only the absolute value of the nonadditive effect, irrelative of increment signs. In addition, its numerical value increases monotonically with the dimensionality M. This property is useful in the study of asymptotic behavior of the system with respect to the number of experimental parameters under consideration. 5. Results and discussion.
5.Sign-space analysis of the influence of ionizing radiation and cadmium on organisms in PCA-representation
It should be remembered, that chronic influence of ionizing radiation and cadmium on organisms is characterized by a set of specific peculiarities, caused by data normalization procedure and principal component formation. The point is that object clasterization in sign space is due not only to the external influence of detrimental agents, but to time dynamics of principal components too. This fact may play an essential role in correct interpretation of the obtained results.
Usually data processing in PCA needs the pretreatment of primary experimental values, as they have essentially different magnitudes and are measured in different units. Any type of such normalization is ambiguous, as this procedure mathematically is equivalent to nonunitary transformation of correlation matrix.
Two special cases of data preprocessing are of main interest: 1) normalization in every time group to the magnitudes of indices for the control group of the same age; and 2) normalization of all data to the control of the very early time group. When used, normalization of the first type practically eliminates all qualitative age-related changes in laboratory animals. Hence, all regular

400
6. Quantitative estimation of combined influence of low-dose radiation and cadmium on rat's organism
To fully appreciate the significance of PCA in LDE study, we will now look at quantitative estimation of combined influence of low-dose radiation and cadmium on rat's organism using the approach, worked out in Section 4.
Figure 3 shows the result of Kszn R;Cd calculation performed by the
procedure given in Eq.13 for three first principal components. The results were obtained with data set normalized to their magnitudes in corresponding control group. Above all, it should be pointed out that all coefficients have non-monotone nature as a function of absorbed dose. This fact clearly demonstrates the role of adaptation mechanisms of the organism under chronic external influence. In addition, the diagrams show very specific feature of the considered effects of combined action: in every class of object status different groups of observed parameters may
simultaneously demonstrate both synergetic ( Kszn R;Cd ! 1 for z2, dose 0.6 Gy) and antagonistic ( Kszn R;Cd 1for z3, dose 0.6 Gy) reaction, and even opposite
tendency of agent action ( Kszn R;Cd 0 for z3, dose 1.0 Gy). As it was pointed out above, the last result may be caused by different direction of measured changes in individual and combined agent (in this case R and Cd) action, Γxi!0 , as well as by
the competition of factor loadings with different signs ukj!0 . It should be
particularly emphasized that both of these situations indicate non-additive effects in combined interaction. If, for example, a combined influence significantly affects the parameters with positive factor loadings, and an individual influence mostly affects
negatively loaded parameters, synergy coefficient Kszn R;Cd will be negative. A
more sophisticated treatment of our experimental data and factor loadings indicates, that both of these reasons may be the case. Further accumulation of experimental data will make possible to create effective mathematical models of such mechanisms of non-additive interaction in LDE study.