

vk.com/id446425943
Goldman Sachs
Data Monitor – Latam
EM Macro Navigator
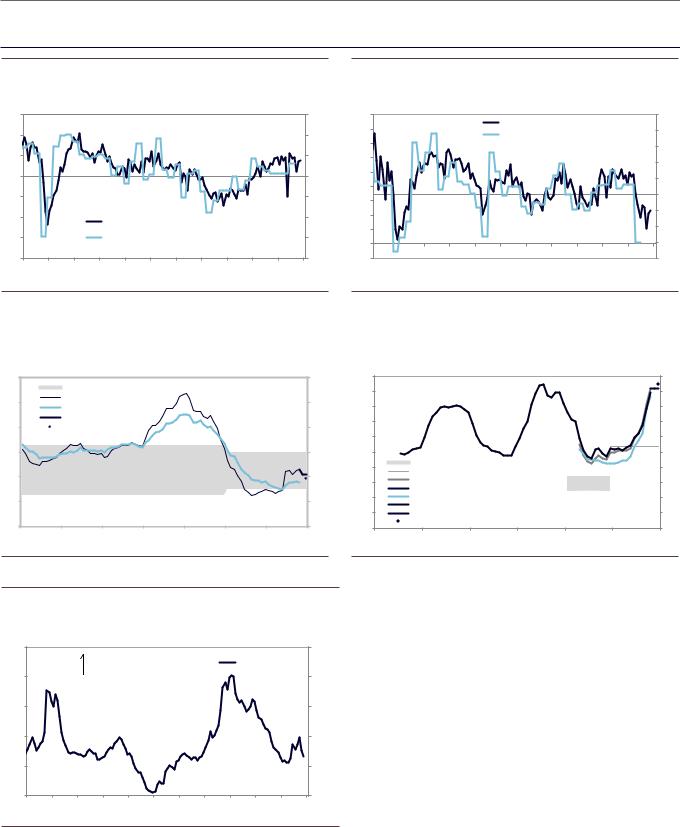
Exhibit 88: Brazil Activity Growth |
|
Exhibit 89: Argentina Activity Growth |
|
Percent change, annualized |
Percent change, annualized |
Percent change, annualized |
Percent change, annualized |
15 |
|
|
|
|
|
|
|
|
|
|
15 |
25 |
10 |
|
|
|
|
|
|
|
|
|
|
10 |
20 |
|
|
|
|
|
|
|
|
|
|
15 |
||
|
|
|
|
|
|
|
|
|
|
|
|
|
5 |
|
|
|
|
|
|
|
|
|
|
5 |
10 |
0 |
|
|
|
|
|
|
|
|
|
|
0 |
5 |
|
|
|
|
|
|
|
|
|
|
0 |
||
-5 |
|
|
|
|
|
|
|
|
|
|
-5 |
|
|
|
|
|
|
|
|
|
|
|
-5 |
||
|
|
|
|
|
|
|
|
|
|
|
|
|
-10 |
|
|
GS Current Activity Indicator (mom) |
|
|
-10 |
-10 |
|||||
|
|
|
|
|
|
-15 |
||||||
-15 |
|
|
Real GDP (qoq) |
|
|
|
|
|
-15 |
|||
|
|
|
|
|
|
|
-20 |
|||||
|
|
|
|
|
|
|
|
|
|
|
|
|
-20 |
|
|
|
|
|
|
|
|
|
|
-20 |
-25 |
08 |
09 |
10 |
11 |
12 |
13 |
14 |
15 |
16 |
17 |
18 |
19 |
|
|
|
|
|
|
GS Current Activity Indicator (mom) |
25 |
|||||
|
|
|
|
|
20 |
||||||
|
|
|
|
|
Real GDP (qoq) |
|
|
|
|||
|
|
|
|
|
|
|
|
|
|||
|
|
|
|
|
|
|
|
|
|
|
15 |
|
|
|
|
|
|
|
|
|
|
|
10 |
|
|
|
|
|
|
|
|
|
|
|
5 |
|
|
|
|
|
|
|
|
|
|
|
0 |
|
|
|
|
|
|
|
|
|
|
|
-5 |
|
|
|
|
|
|
|
|
|
|
|
-10 |
|
|
|
|
|
|
|
|
|
|
|
-15 |
|
|
|
|
|
|
|
|
|
|
|
-20 |
08 |
09 |
10 |
11 |
12 |
13 |
14 |
15 |
16 |
17 |
18 |
19 |
Source: Goldman Sachs Global Investment Research |
|
Source: Goldman Sachs Global Investment Research |
|
|
|
Exhibit 90: Brazil Inflation |
|
Exhibit 91: Argentina Inflation |
Percent change, yoy |
|
|
|
|
Percent change, yoy |
Percent change, yoy |
|
|
|
Percent change, yoy |
||
12 |
|
|
|
|
|
12 |
50 |
|
|
|
|
50 |
|
Central Bank Target Range |
|
|
|
45 |
|
|
|
|
45 |
||
|
Headline CPI Inflation |
|
|
|
|
|
|
|
|
|||
10 |
|
|
|
10 |
40 |
|
|
|
|
40 |
||
Core CPI Inflation |
|
|
|
|
|
|
|
|||||
|
|
|
|
|
|
|
|
|
||||
|
BBG Consensus Median |
|
|
|
|
35 |
|
|
|
|
35 |
|
8 |
GS Forecast - Headline |
|
|
|
8 |
|
|
|
|
|||
|
|
|
30 |
|
|
|
|
30 |
||||
|
|
|
|
|
|
|
|
|
|
|
||
6 |
|
|
|
|
|
6 |
25 |
|
|
|
|
25 |
|
|
|
|
|
|
|
20 |
2017 CB Target Range |
|
|
20 |
|
4 |
|
|
|
|
|
4 |
2018 CB Target |
|
|
|
||
|
|
|
|
|
15 |
National CPI (Headline) |
|
|
15 |
|||
|
|
|
|
|
|
|
GS Forecast: Buenos Aires CPI (Headline) |
|
||||
|
|
|
|
|
|
|
10 |
|
10 |
|||
2 |
|
|
|
|
|
2 |
National CPI (Core) |
|
|
|||
|
|
|
|
|
|
Buenos Aires CPI (Headline) |
|
|
|
|||
|
|
|
|
|
|
|
5 |
|
|
5 |
||
|
|
|
|
|
|
|
BBG Consensus Median |
|
|
|||
0 |
|
|
|
|
|
0 |
0 |
GS Forecast: National CPI (Headline) |
|
0 |
||
|
|
|
|
|
|
|
|
|
||||
12 |
13 |
14 |
15 |
16 |
17 |
18 |
13 |
14 |
15 |
16 |
17 |
18 |
Source: Bloomberg, Haver Analytics, Goldman Sachs Global Investment Research |
Source: Bloomberg, Goldman Sachs Global Investment Research |
Exhibit 92: Brazil Financial Conditions
Index |
|
|
|
|
|
|
|
|
|
|
Index |
102 |
|
|
|
|
|
|
|
|
|
|
102 |
|
|
|
tighter |
|
|
|
|
|
Nominal FCI |
|
|
101 |
|
|
|
|
|
|
|
|
|
101 |
|
|
|
|
|
|
|
|
|
|
|
||
100 |
|
|
|
|
|
|
|
|
|
|
100 |
99 |
|
|
|
|
|
|
|
|
|
|
99 |
98 |
|
|
|
|
|
|
|
|
|
|
98 |
97 |
|
|
|
|
|
|
|
|
|
|
97 |
08 |
09 |
10 |
11 |
12 |
13 |
14 |
15 |
16 |
17 |
18 |
19 |
Source: Goldman Sachs Global Investment Research
11 December 2018 |
38 |

vk.com/id446425943
Goldman Sachs
EM Macro Navigator
Exhibit 93: Chile Activity Growth |
Exhibit 94: Colombia Activity Growth |
Percent change, annualized |
|
|
|
|
Percent change, annualized |
Percent change, annualized |
|
|
|
|
|
Percent change, annualized |
|||||||||||
15 |
|
|
|
|
|
|
|
|
|
|
15 |
15 |
|
|
|
|
|
GS Current Activity Indicator (mom) |
15 |
||||
|
|
|
|
|
|
|
|
|
|
|
|
|
|
|
|
|
|
|
|||||
10 |
|
|
|
|
|
|
|
|
|
|
10 |
13 |
|
|
|
|
|
Real GDP (qoq) |
|
|
13 |
||
|
|
|
|
|
|
|
|
|
|
10 |
|
|
|
|
|
|
|
|
|
|
10 |
||
|
|
|
|
|
|
|
|
|
|
|
|
|
|
|
|
|
|
|
|
|
|
||
5 |
|
|
|
|
|
|
|
|
|
|
5 |
8 |
|
|
|
|
|
|
|
|
|
|
8 |
|
|
|
|
|
|
|
|
|
|
|
|
|
|
|
|
|
|
|
|
|
|
||
|
|
|
|
|
|
|
|
|
|
|
|
5 |
|
|
|
|
|
|
|
|
|
|
5 |
0 |
|
|
|
|
|
|
|
|
|
|
0 |
3 |
|
|
|
|
|
|
|
|
|
|
3 |
|
|
|
|
|
|
|
|
|
|
|
|
|
|
|
|
|
|
|
|
|
|
||
-5 |
|
|
|
|
GS Current Activity Indicator (mom) |
|
-5 |
0 |
|
|
|
|
|
|
|
|
|
|
0 |
||||
|
|
|
|
|
|
|
|
|
|
|
|
|
|
|
|
|
|||||||
|
|
|
|
|
|
|
|
|
|
|
|
|
|
|
|
|
|
|
|
|
|
||
|
|
|
|
|
Real GDP (qoq) |
|
|
|
|
|
-3 |
|
|
|
|
|
|
|
|
|
|
-3 |
|
-10 |
|
|
|
|
|
|
|
|
|
|
-10 |
-5 |
|
|
|
|
|
|
|
|
|
|
-5 |
08 |
09 |
10 |
11 |
12 |
13 |
14 |
15 |
16 |
17 |
18 |
19 |
08 |
09 |
10 |
11 |
12 |
13 |
14 |
15 |
16 |
17 |
18 |
19 |
Source: Goldman Sachs Global Investment Research |
|
Source: Goldman Sachs Global Investment Research |
|
|
|
Exhibit 95: Chile Inflation |
|
Exhibit 96: Colombia Inflation |
Percent change, yoy |
|
|
|
|
Percent change, yoy |
Percent change, yoy |
|
|
|
|
Percent change, yoy |
|||
7 |
|
|
|
|
Central Bank Target Range |
7 |
9 |
|
Central Bank Target Range |
|
|
9 |
||
|
|
|
|
|
|
|
|
|
|
|
||||
6 |
|
|
|
|
Headline CPI Inflation |
6 |
8 |
|
Headline CPI Inflation |
|
|
|
8 |
|
|
|
|
|
Core CPI Inflation |
|
|
Core CPI Inflation |
|
|
|
|
|||
|
|
|
|
|
|
7 |
|
|
|
|
7 |
|||
|
|
|
|
|
BBC Consensus Median |
|
|
|
|
|
||||
|
|
|
|
|
|
|
BBC Consensus Median |
|
|
|||||
5 |
|
|
|
|
GS Forecast - Headline |
5 |
|
|
|
|
|
|||
|
|
|
|
6 |
|
GS Forecast - Headline |
|
|
6 |
|||||
|
|
|
|
|
|
|
|
|
|
|
||||
4 |
|
|
|
|
|
|
4 |
5 |
|
|
|
|
|
5 |
|
|
|
|
|
|
|
|
|
|
|
|
|
||
3 |
|
|
|
|
|
|
3 |
4 |
|
|
|
|
|
4 |
2 |
|
|
|
|
|
|
2 |
3 |
|
|
|
|
|
3 |
|
|
|
|
|
|
|
|
|
|
|
|
|
||
|
|
|
|
|
|
|
|
2 |
|
|
|
|
|
2 |
1 |
|
|
|
|
|
|
1 |
1 |
|
|
|
|
|
1 |
|
|
|
|
|
|
|
|
|
|
|
|
|
||
0 |
|
|
|
|
|
|
0 |
0 |
|
|
|
|
|
0 |
12 |
13 |
14 |
15 |
16 |
17 |
18 |
|
12 |
13 |
14 |
15 |
16 |
17 |
18 |
Source: Haver Analytics, Goldman Sachs Global Investment Research |
|
Source: Haver Analytics, Goldman Sachs Global Investment Research |
|
|
|
Exhibit 97: Chile Financial Conditions |
|
Exhibit 98: Colombia Financial Conditions |
Index |
|
|
|
|
|
|
|
|
|
|
Index |
Index |
|
|
|
|
|
|
|
|
|
|
Index |
101 |
|
|
|
|
|
|
|
|
|
|
101 |
101 |
|
|
|
|
|
|
|
|
|
|
101 |
100 |
|
|
tighter |
|
|
|
|
Nominal FCI |
|
100 |
100 |
|
|
|
|
|
|
|
|
Nominal FCI |
100 |
||
|
|
|
|
|
|
|
|
|
|
|
|
|
|
|
tighter |
|
|
|
|
||||
|
|
|
|
|
|
|
|
|
|
|
|
|
|
|
|
|
|
|
|
|
|
|
|
99 |
|
|
|
|
|
|
|
|
|
|
99 |
99 |
|
|
|
|
|
|
|
|
|
|
99 |
98 |
|
|
|
|
|
|
|
|
|
|
98 |
98 |
|
|
|
|
|
|
|
|
|
|
98 |
97 |
|
|
|
|
|
|
|
|
|
|
97 |
97 |
|
|
|
|
|
|
|
|
|
|
97 |
96 |
|
|
|
|
|
|
|
|
|
|
96 |
96 |
|
|
|
|
|
|
|
|
|
|
96 |
08 |
09 |
10 |
11 |
12 |
13 |
14 |
15 |
16 |
17 |
18 |
19 |
08 |
09 |
10 |
11 |
12 |
13 |
14 |
15 |
16 |
17 |
18 |
19 |
Source: Goldman Sachs Global Investment Research |
Source: Goldman Sachs Global Investment Research |
11 December 2018 |
39 |

vk.com/id446425943
Goldman Sachs
EM Macro Navigator
Exhibit 99: Mexico Activity Growth |
Exhibit 100: Peru Activity Growth |
Percent change, annualized |
|
|
|
|
Percent change, annualized |
Percent change, annualized |
|
|
|
|
Percent change, annualized |
||||||||||||
15 |
|
|
|
|
|
|
|
|
|
|
15 |
20 |
|
|
|
|
|
|
|
|
|
|
20 |
10 |
|
|
|
|
|
|
|
|
|
|
10 |
15 |
|
|
|
|
|
|
|
|
|
|
15 |
|
|
|
|
|
|
|
|
|
|
|
|
|
|
|
|
|
|
|
|
|
|
||
5 |
|
|
|
|
|
|
|
|
|
|
5 |
10 |
|
|
|
|
|
|
|
|
|
|
10 |
|
|
|
|
|
|
|
|
|
|
|
|
|
|
|
|
|
|
|
|
|
|
||
0 |
|
|
|
|
|
|
|
|
|
|
0 |
|
|
|
|
|
|
|
|
|
|
|
|
|
|
|
|
|
|
|
|
|
|
|
|
5 |
|
|
|
|
|
|
|
|
|
|
5 |
-5 |
|
|
|
|
|
|
|
|
|
|
-5 |
|
|
|
|
|
|
|
|
|
|
|
|
-10 |
|
|
|
|
|
GS Current Activity Indicator (mom) |
-10 |
0 |
|
|
|
|
|
|
|
|
|
|
0 |
||||
|
|
|
|
|
|
|
|
|
|
|
|
|
|
|
|
|
|||||||
|
|
|
|
|
|
|
|
|
|
|
|
|
|
|
|
|
|
|
|
|
|
||
|
|
|
|
|
|
Real GDP (qoq) |
|
|
|
|
-5 |
|
|
|
|
|
GS Current Activity Indicator (mom) |
|
-5 |
||||
-15 |
|
|
|
|
|
|
|
|
|
|
-15 |
|
|
|
|
|
Real GDP (qoq) |
|
|
|
|||
|
|
|
|
|
|
|
|
|
|
|
|
|
|
|
|
|
|
|
|
||||
|
|
|
|
|
|
|
|
|
|
|
|
|
|
|
|
|
|
|
|
|
|
||
-20 |
|
|
|
|
|
|
|
|
|
|
-20 |
-10 |
|
|
|
|
|
|
|
|
|
|
-10 |
08 |
09 |
10 |
11 |
12 |
13 |
14 |
15 |
16 |
17 |
18 |
19 |
08 |
09 |
10 |
11 |
12 |
13 |
14 |
15 |
16 |
17 |
18 |
19 |
Source: Goldman Sachs Global Investment Research |
|
Source: Goldman Sachs Global Investment Research |
|
|
|
Exhibit 101: Mexico Inflation |
|
Exhibit 102: Peru Inflation |
Percent change, yoy |
|
|
|
|
Percent change, yoy |
Percent change, yoy |
|
|
|
|
Percent change, yoy |
||
9 |
|
|
|
|
|
9 |
6 |
|
Central Bank Target Range |
|
|
6 |
|
|
|
Central Bank Target Range |
|
|
|
|
|
|
|
|
|||
8 |
|
|
|
8 |
|
|
Headline CPI Inflation |
|
|
|
|||
|
Headline CPI Inflation |
|
|
5 |
|
Core CPI Inflation |
|
|
5 |
||||
|
|
|
|
|
|
|
|
||||||
7 |
|
Core CPI Inflation |
|
|
|
7 |
|
|
BBG Consensus Median |
|
|
|
|
|
|
|
|
|
|
GS Forecast - Headline |
|
|
|
||||
|
|
BBC Consensus Median |
|
|
|
|
|
|
|
|
|||
6 |
|
|
|
6 |
4 |
|
|
|
|
|
4 |
||
|
GS Forecast - Headline |
|
|
|
|
|
|
|
|||||
5 |
|
|
|
5 |
|
|
|
|
|
|
|
||
|
|
|
|
|
3 |
|
|
|
|
|
3 |
||
4 |
|
|
|
|
|
4 |
|
|
|
|
|
||
|
|
|
|
|
|
|
|
|
|
|
|
||
3 |
|
|
|
|
|
3 |
2 |
|
|
|
|
|
2 |
2 |
|
|
|
|
|
2 |
1 |
|
|
|
|
|
1 |
1 |
|
|
|
|
|
1 |
|
|
|
|
|
||
|
|
|
|
|
|
|
|
|
|
|
|
||
0 |
|
|
|
|
|
0 |
0 |
|
|
|
|
|
0 |
12 |
13 |
14 |
15 |
16 |
17 |
18 |
12 |
13 |
14 |
15 |
16 |
17 |
18 |
Source: Haver Analytics, Goldman Sachs Global Investment Research |
|
Source: Haver Analytics, Goldman Sachs Global Investment Research |
|
|
|
Exhibit 103: Mexico Financial Conditions |
|
Exhibit 104: Peru Financial Conditions |
Index |
|
|
|
|
|
|
|
|
|
|
Index |
Index |
|
|
|
|
|
|
|
|
|
|
Index |
102 |
|
|
|
|
|
|
|
|
|
|
102 |
102 |
|
|
|
|
|
|
|
|
|
|
102 |
|
|
|
|
|
|
|
|
|
|
|
|
|
|
|
|
|
|
|
|
|
|
||
101 |
|
|
|
|
|
|
|
Nominal FCI |
|
101 |
101 |
|
|
|
|
|
tighter |
|
|
Nominal FCI |
|
101 |
|
|
|
|
|
|
|
|
|
|
|
|
|
|
|
|
|
|
|
|
|
||||
|
|
|
|
|
|
|
|
|
|
|
|
|
|
|
|
|
|
|
|
|
|
|
|
100 |
|
|
|
|
|
|
|
|
|
|
100 |
100 |
|
|
|
|
|
|
|
|
|
|
100 |
|
|
|
|
|
|
tighter |
|
|
|
|
|
|
|
|
|
|
|
|
|
|
|
||
|
|
|
|
|
|
|
|
|
|
|
99 |
|
|
|
|
|
|
|
|
|
|
99 |
|
|
|
|
|
|
|
|
|
|
|
|
|
|
|
|
|
|
|
|
|
|
|
||
99 |
|
|
|
|
|
|
|
|
|
|
99 |
98 |
|
|
|
|
|
|
|
|
|
|
98 |
|
|
|
|
|
|
|
|
|
|
|
|
|
|
|
|
|
|
|
|
|
|
||
98 |
|
|
|
|
|
|
|
|
|
|
98 |
97 |
|
|
|
|
|
|
|
|
|
|
97 |
|
|
|
|
|
|
|
|
|
|
|
|
|
|
|
|
|
|
|
|
|
|
||
97 |
|
|
|
|
|
|
|
|
|
|
97 |
96 |
|
|
|
|
|
|
|
|
|
|
96 |
|
|
|
|
|
|
|
|
|
|
|
|
|
|
|
|
|
|
|
|
|
|
||
96 |
|
|
|
|
|
|
|
|
|
|
96 |
95 |
|
|
|
|
|
|
|
|
|
|
95 |
08 |
09 |
10 |
11 |
12 |
13 |
14 |
15 |
16 |
17 |
18 |
19 |
08 |
09 |
10 |
11 |
12 |
13 |
14 |
15 |
16 |
17 |
18 |
19 |
Source: Goldman Sachs Global Investment Research |
Source: Goldman Sachs Global Investment Research |
11 December 2018 |
40 |