

vk.com/id446425943
Goldman Sachs
EM Macro Navigator
Early evidence of US tariffs’ impact on China and Asia
*Link to full publication:
Early evidence of US
tariffs’ impact on China and
Asia
nUS President Trump’s imposition of tariffs on imports from China, alongside other economic measures and tougher rhetoric from US officials, has led to heightened uncertainty about the direction of the bilateral economic relationship.
nThe abrupt shift to more aggressive US tactics has affected not only China’s exports—via short-term “front-loading” to avoid tariffs, and potentially longer-term shifts in demand and sourcing—but also domestic demand. Heightened uncertainty is a challenge for export-related investment. Meanwhile, business and consumer confidence has been dented.
nTo gauge tariffs’ impact on China to date and in the future, we leveraged economic analysis from our GS colleagues and the IMF, reviewed surveys and financial reports of companies doing business in the region, and conducted a new survey of our Asia equity analysts.
nThe negative effects of tariffs and other trade uncertainties look set to increase in 2019 as firms draw down “front-loaded” inventories and higher tariffs encourage substitution to non-Chinese suppliers. Elsewhere in the region, growth spillovers are likely to be negative in coming months as trade growth and Chinese activity slow.
nA near-term “deal”—or at least a pause in the escalation of tariffs—is a possibility when Presidents Xi and Trump meet December 1st on the sidelines of the G20 summit in Argentina, although for now our base-case remains further escalation in early 2019. Regardless of the outcome, the past year has revealed the potential for US-China tensions to cause widespread supply chain disruption, and this realization will likely influence firms’ investment and sourcing decisions in the future even if a deal is eventually reached.
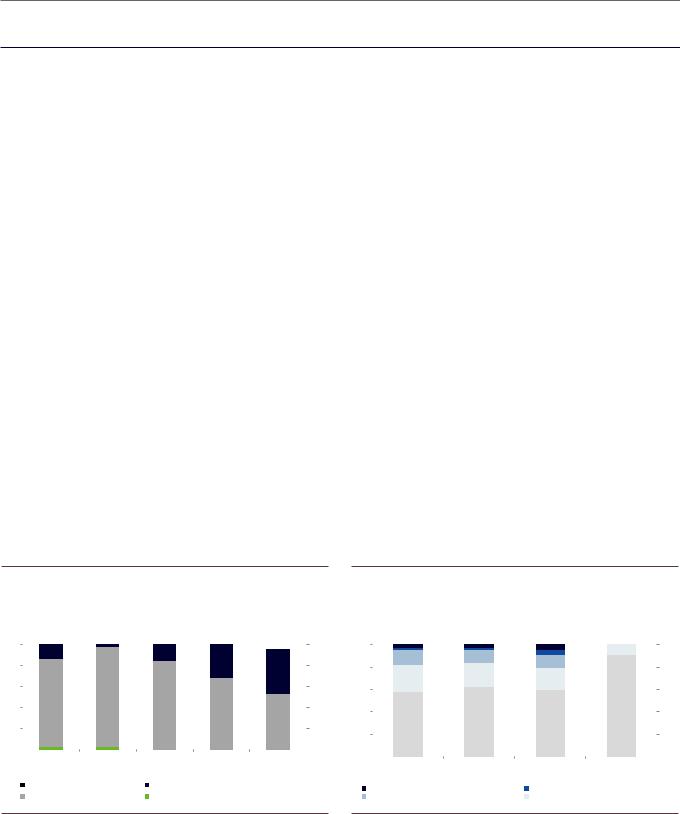
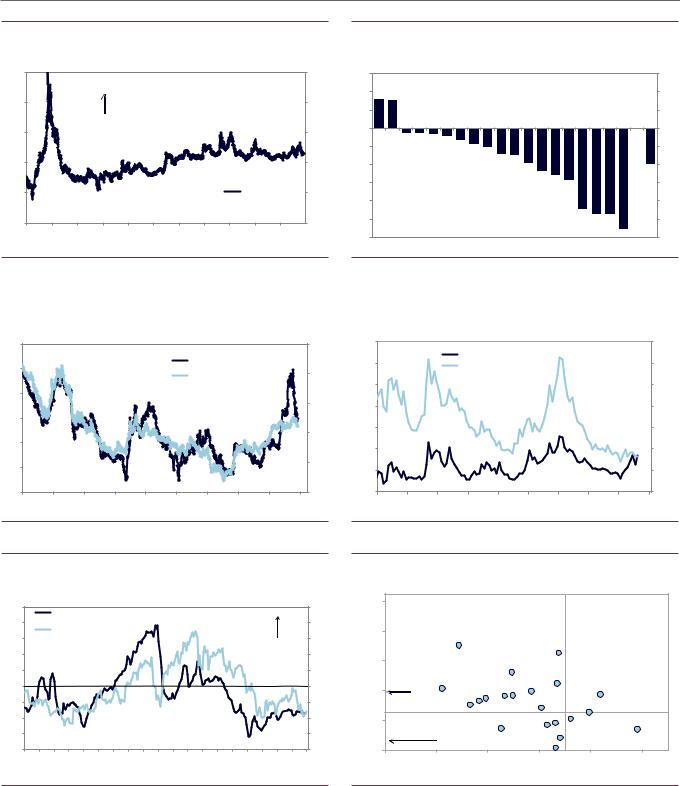
Exhibit 15: Roughly half of our EM Asia equity analysts expect trade tensions to weigh on profits
Percent |
|
|
|
|
Percent |
||||
100 |
|
Asia Analysts Citing Trade Tensions as Affecting 2018-19 Outlook |
100 |
||||||
|
|
|
|
|
|
|
|||
|
|
|
|
|
|
||||
80 |
|
|
|
|
|
|
|
80 |
|
60 |
|
|
|
|
|
|
|
60 |
|
40 |
|
|
|
|
|
|
|
40 |
|
20 |
|
|
|
|
|
|
|
20 |
|
0 |
|
|
|
|
|
|
|
|
0 |
|
|
Capex |
Headcount/ |
Cost of goods |
Sales |
Profits |
|||
|
|
|
Empl. Cost |
sold/ Input |
Volume |
|
|
|
|
|
|
|
|
Costs |
|
|
|
|
|
|
|
Worsened significantly |
Worsened somewhat |
|
|
|
|
||
|
|
Approximately no change |
Improved somewhat |
|
|
|
|
||
Exhibit 16: Analyst concerns center on loss of export markets and supply chain impact
Percent |
|
|
Percent |
||||
100 |
|
Asia Analysts Citing Trade Tensions as Risk to Business Conditions |
100 |
||||
|
|
|
|
|
|||
80 |
|
|
|
|
|
80 |
|
60 |
|
|
|
|
|
60 |
|
40 |
|
|
|
|
|
40 |
|
20 |
|
|
|
|
|
20 |
|
0 |
|
|
|
|
|
|
0 |
|
|
Loss of export |
Higher import prices |
Changing supply |
Difficulty in |
||
|
|
markets |
|
chains or sourcing |
accessing new |
||
The most important issue facing my sector |
strategies |
technologies |
|||||
Very Important |
|
|
|
||||
Important |
|
Somewhat important |
|||||
Source: Goldman Sachs Global Investment Research |
Source: Goldman Sachs Global Investment Research |
11 December 2018 |
24 |
vk.com/id446425943
Goldman Sachs
EM Macro Navigator
EM Chartpack
Exhibit 17: EM Current Activity Indicator |
Exhibit 18: EM Growth Surprises |
Percent change, annualized |
|
|
|
|
|
|
Percent change, annualized |
Index |
|
|
|
|
|
|
|
|
|
|
|
|
Index |
|||||||
10 |
|
|
|
|
|
|
|
|
|
|
|
|
10 |
8 |
|
|
|
|
|
|
|
|
|
|
|
|
8 |
|
|
|
|
|
|
|
|
|
|
|
|
|
|
|
|
|
|
|
|
EM MAP Score |
|
|
|
|
|||||
|
|
|
|
|
|
|
|
|
|
|
|
|
|
|
|
|
|
|
|
|
|
|
|
|
||||
|
|
|
|
|
|
|
|
|
|
|
|
|
|
6 |
|
|
|
|
|
|
|
|
|
|
|
|
6 |
|
5 |
|
|
|
|
|
|
|
|
|
|
|
|
5 |
4 |
|
|
|
|
|
|
|
|
|
|
|
|
4 |
|
|
|
|
|
|
|
|
|
|
|
|
|
|
|
|
|
|
|
|
|
|
|
|
|
|
|
|||
|
|
|
|
|
|
|
|
|
|
|
|
|
|
2 |
|
|
|
|
|
|
|
|
|
|
|
|
2 |
|
0 |
|
|
|
|
|
|
|
|
|
|
|
|
0 |
|
|
|
|
|
|
|
|
|
|
|
|
|
|
|
|
|
|
|
|
|
|
|
|
|
|
|
|
|
0 |
|
|
|
|
|
|
|
|
|
|
|
|
0 |
|
-5 |
|
|
|
|
|
|
|
EM CAI (Interquartile Range) |
|
-5 |
-2 |
|
|
|
|
|
|
|
|
|
|
|
|
-2 |
||||
|
|
|
|
|
|
|
|
|
|
|
|
|
|
|
|
|
|
|
|
|
|
|||||||
|
|
|
|
|
|
|
|
EM CAI (Median) |
|
|
|
-4 |
|
|
|
|
|
|
|
|
|
|
|
|
-4 |
|||
-10 |
|
|
|
|
|
|
|
|
|
|
|
|
-10 |
-6 |
|
|
|
|
|
|
|
|
|
|
|
|
-6 |
|
|
|
|
|
|
|
|
|
|
|
|
|
06 |
07 |
08 |
09 |
10 |
11 |
12 |
13 |
14 |
15 |
16 |
17 |
18 |
19 |
|||
06 |
07 |
08 |
09 |
10 |
11 |
12 |
13 |
14 |
15 |
16 |
17 |
18 |
19 |
|||||||||||||||
|
|
|
|
|
|
|
|
|
|
|
|
|
|
|||||||||||||||
Source: Goldman Sachs Global Investment Research |
|
Source: Goldman Sachs Global Investment Research |
|
|
|
Exhibit 19: EM Regional CAIs |
|
Exhibit 20: Global Trade Growth |
Percent Change, annualized |
|
|
|
|
|
Percent Change, annualized |
Percent yoy, 3mma |
|
|
|
|
|
|
|
|
Percent yoy, 3mma |
|||||||||
15 |
|
|
|
|
|
|
|
|
|
|
|
15 |
30 |
|
|
|
|
|
|
|
|
|
|
|
30 |
10 |
|
|
|
|
|
|
|
|
|
|
|
10 |
20 |
|
|
|
|
|
|
|
|
|
|
|
20 |
|
|
|
|
|
|
|
|
|
|
|
|
|
|
|
|
|
|
|
|
|
|
|
|
||
5 |
|
|
|
|
|
|
|
|
|
|
|
5 |
10 |
|
|
|
|
|
|
|
|
|
|
|
10 |
|
|
|
|
|
|
|
|
|
|
|
|
|
|
|
|
|
|
|
|
|
|
|
|
||
|
|
|
|
|
|
|
|
|
|
|
|
|
0 |
|
|
|
|
|
|
|
|
|
|
|
0 |
0 |
|
|
|
|
|
|
|
|
|
|
|
0 |
|
|
|
|
|
|
|
|
|
|
|
|
|
|
|
|
|
|
|
|
|
|
|
|
|
|
-10 |
|
|
|
|
Global Trade Growth |
|
|
|
|
-10 |
||
-5 |
|
|
|
|
|
|
|
CEEMEA CAI |
|
|
-5 |
|
|
|
|
|
|
value:USD |
|
|
|
|
|
||
|
|
|
|
|
|
|
|
|
-20 |
|
|
|
|
|
value index: TWI |
|
|
|
-20 |
||||||
|
|
|
|
|
|
|
|
LatAm CAI |
|
|
|
|
|
|
|
|
|
|
|
||||||
-10 |
|
|
|
|
|
|
|
|
|
-10 |
|
|
|
|
|
|
value index: local currency |
|
|
|
|||||
|
|
|
|
|
|
|
AeJ CAI |
|
|
|
-30 |
|
|
|
|
|
volume index ’direct’: seafright |
|
-30 |
||||||
|
|
|
|
|
|
|
|
|
|
|
|
|
|
|
|
|
volume index ’direct’: airfright |
|
|||||||
|
|
|
|
|
|
|
|
|
|
|
|
|
|
|
|
|
|
|
|
|
|||||
-15 |
|
|
|
|
|
|
|
|
|
|
|
-15 |
-40 |
|
|
|
|
|
volume index ’indirect’ |
|
|
-40 |
|||
|
|
|
|
|
|
|
|
|
|
|
|
|
|
|
|
|
|
|
|
|
|
||||
07 |
08 |
09 |
10 |
11 |
12 |
13 |
14 |
15 |
16 |
17 |
18 |
19 |
06 |
07 |
08 |
09 |
10 |
11 |
12 |
13 |
14 |
15 |
16 |
17 |
18 |
Source: Goldman Sachs Global Investment Research |
Source: CPB World Trade Monitor, Haver Analytics, Goldman Sachs Global Investment Research |
Exhibit 21: EM Government Debt/Deficits
General government fiscal balance (% of FY GDP, 2018)
4
2
0
-2
-4
-6
-8
-10
0
RUB |
|
CZK |
KRW |
|
|
|
SGD |
|
|
|
|
|
|
|
|
||
|
|
|
THB |
PLN |
|
|
|
|
|
|
TWD |
PHP |
|
|
|
|
|
|
CLP |
|
|
|
|
|
||
|
IDR |
|
MXN |
|
HUF |
|
|
|
|
|
COP |
|
|
|
|||
|
|
MYR |
|
|
|
|||
|
PEN |
RON |
ILS |
|
|
|
||
|
TRY |
|
|
|
|
|
||
|
|
|
|
|
|
|
|
|
|
|
|
CNY |
ZAR |
|
|
|
|
|
|
|
|
|
ARS |
|
|
|
|
|
|
|
|
|
INR |
|
|
|
|
|
|
|
|
|
BRL |
|
|
|
|
|
|
|
|
|
|
|
20 |
|
40 |
60 |
|
80 |
100 |
|
|
|
General government gross debt (% GDP, 2018) |
|
|
|
|||
Source: IMF, Goldman Sachs Global Investment Research
11 December 2018 |
25 |
vk.com/id446425943 |
|
|
|
|
|||
Goldman Sachs |
|
|
|
|
|||
Exhibit 22: EM Output gap vs Inflation gap |
|
|
|
||||
|
4 |
|
EM Asia |
|
|
|
|
|
|
|
|
|
|
||
|
3 |
|
|
HUF |
|
||
|
|
CEEMEA |
|
|
|||
|
|
|
|
|
|
|
|
GDP |
2 |
|
LatAm |
|
|
CZK |
|
1 |
|
|
|
|
|
RON |
|
|
|
|
|
|
|
||
% of |
|
|
|
PLN |
|
|
|
|
|
|
THB |
CNY |
|
|
|
as |
0 |
|
|
ILS |
CLP |
|
|
|
|
|
|
||||
Gap |
|
|
MYR |
|
SGD |
||
|
|
|
IDR |
|
|||
-1 |
|
|
|
TWD |
|
|
|
Output |
|
|
|
|
|
||
|
|
|
|
KRW |
PEN |
COP |
|
|
-2 |
|
|
|
|
BRL |
|
|
-3 |
|
|
|
|
ZAR |
|
|
|
|
|
|
|
|
|
|
-4 |
|
|
|
RUB |
|
|
|
|
|
|
|
|
|
|
|
-5 |
|
Low inflation and excess capacity |
|
|
|
|
|
|
|
|
|
|
|
|
|
-4 |
-3 |
-2 |
-1 |
0 |
1 |
|
|
|
|
|
|
Inflation gap (Core Inflation less inflation target, %) |
||
EM Macro Navigator
High inflation and upside domestic pressures
TRY 
PHP
 MXN
MXN
INR
ARS 
High inflation but excess capacity
2 |
3 |
4 |
Note: China inflation target of 3% more like a ceiling in practice; we use target of 2.25% here. Malaysia inflation target is the midpoint of inflation forecast band . Argentina inflation gap is relative to the indicative IMF target for 2018 at 27%.
Source: Haver Analytics, Goldman Sachs Global Investment Research
Exhibit 23: EM Fiscal vs External Balance
General government balance as % of FY GDP (2018)
2 |
|
|
|
|
|
|
|
|
|
|
EM Asia |
CEEMEA |
|
|
|
CZK |
RUB |
KRW |
|
|
|
|
|
|
|||||
|
|
|
|
|
|
||||
|
|
|
|
|
|
|
|
|
SGD |
|
|
LatAm |
|
|
|
|
|
|
|
0 |
|
|
|
|
|
|
|
|
|
|
|
|
|
|
PHP |
|
|
|
THB |
|
|
|
|
|
|
|
|
|
|
-2 |
|
|
|
|
CLP |
PLN |
|
HUF |
TWD |
|
|
|
|
IDR |
|
|
|
||
|
|
|
|
|
|
|
|
||
|
|
|
|
|
COP |
|
|
|
|
|
|
|
|
|
MXN |
|
ILS |
MYR |
|
|
|
|
|
|
|
|
|
||
-4 |
|
|
|
|
RON |
|
|
|
|
|
|
TRY |
|
|
|
CNY |
|
|
|
|
|
|
|
|
|
|
|
|
|
|
|
|
|
|
ZAF |
|
|
|
|
-6 |
|
|
ARS |
|
|
|
|
|
|
|
|
|
|
|
|
|
|
|
|
|
|
|
|
|
INR |
|
|
|
|
|
|
|
|
|
BRL |
|
|
|
|
-8 |
|
|
|
|
|
|
|
|
|
|
|
|
|
|
|
|
|
|
|
-8 |
-6 |
-4 |
-2 |
0 |
2 |
4 |
6 |
||
Current Account as % of GDP (4qma)
Notes: Fiscal year for Thailand ends in September.
Source: Haver Analytics, Goldman Sachs Global Investment Research
11 December 2018 |
26 |
vk.com/id446425943
Goldman Sachs
EM Macro Navigator
Exhibit 24: EM Inflation Overview |
Exhibit 25: Regional Inflation |
Percent change, yoy |
|
|
|
|
Percent change, yoy |
Percent change, yoy |
|
|
|
|
|
|
|
|
Percent change, yoy |
|||||
6 |
|
|
|
|
|
6 |
9 |
|
|
|
|
|
|
Median CPI Inflation |
|
|
9 |
|||
|
|
|
|
|
|
|
8 |
|
|
|
|
|
|
|
|
8 |
||||
5 |
|
|
|
|
|
5 |
|
|
|
|
|
|
|
CEEMEA |
|
|
|
|||
|
|
|
|
|
7 |
|
|
|
|
|
|
|
Latin America* |
|
|
7 |
||||
|
|
|
|
|
|
|
|
|
|
|
|
|
|
|
|
|||||
4 |
|
|
|
|
|
4 |
6 |
|
|
|
|
|
|
|
Asia ex-Japan |
|
|
6 |
||
3 |
|
|
|
|
|
3 |
5 |
|
|
|
|
|
|
|
|
|
|
|
5 |
|
|
|
|
|
|
4 |
|
|
|
|
|
|
|
|
|
|
|
4 |
|||
|
|
|
|
|
|
|
|
|
|
|
|
|
|
|
|
|
|
|||
2 |
|
|
|
|
|
2 |
3 |
|
|
|
|
|
|
|
|
|
|
|
3 |
|
1 |
EM inflation (Interquartile Range) |
|
|
1 |
2 |
|
|
|
|
|
|
|
|
|
|
|
2 |
|||
|
|
1 |
|
|
|
|
|
|
|
|
|
|
|
1 |
||||||
|
|
|
|
|
|
|
|
|
|
|
|
|
|
|
||||||
|
EM inflation (Median) |
|
|
|
|
|
|
|
|
|
|
|
|
|
|
|
||||
0 |
|
|
|
0 |
0 |
|
|
|
|
|
|
|
|
|
|
|
0 |
|||
|
|
|
|
|
|
|
|
|
|
|
|
|
|
|
|
|||||
|
|
|
|
|
|
|
|
|
|
|
|
|
|
|
|
|
|
|||
-1 |
|
|
|
|
|
-1 |
-1 |
|
|
|
|
|
|
|
|
|
|
|
-1 |
|
|
|
|
|
|
06 |
07 |
08 |
09 |
10 |
11 |
12 |
13 |
14 |
15 |
16 |
17 |
18 |
|||
2012 |
2013 |
2014 |
2015 |
2016 |
2017 |
2018 |
||||||||||||||
*Excluding Argentina |
|
|
|
|
|
|
|
|
|
|
||||||||||
|
|
|
|
|
|
|
|
|
|
|
|
|
|
|
|
|
||||
Source: Haver Analytics, Goldman Sachs Global Investment Research |
|
Source: Haver Analytics, Goldman Sachs Global Investment Research |
|
|
|
Exhibit 26: EM bank lending conditions survey |
|
Exhibit 27: Sovereign Bond Spread |
Index |
|
|
|
|
|
|
|
|
Index |
Basis point |
|
|
|
|
|
|
Basis point |
70 |
|
|
|
IIF Bank Lending Conditions Index |
|
70 |
400 |
|
|
|
|
|
|
400 |
|||
|
|
|
|
|
|
|
|
|
|
|
|
|
|
||||
65 |
|
|
|
|
EM Asia |
|
|
|
65 |
350 |
|
|
|
|
|
|
350 |
|
|
|
|
Latin America |
|
|
|
|
|
|
|
|
|||||
|
|
|
|
|
|
|
|
|
|
|
|
|
|
||||
60 |
|
Easing |
|
|
EM Europe |
|
|
|
60 |
|
|
|
|
|
|
|
|
|
|
|
|
EM |
|
|
|
300 |
|
|
|
|
|
|
300 |
||
|
|
|
|
|
|
|
|
|
|
|
|
|
|
|
|||
|
|
|
|
|
|
|
|
|
|
|
|
|
|
|
|
||
55 |
|
|
|
|
|
|
|
|
55 |
|
|
|
|
|
|
|
|
|
|
|
|
|
|
|
|
|
|
250 |
|
|
|
|
|
|
250 |
50 |
|
|
|
|
|
|
|
|
50 |
|
|
|
|
|
|
|
|
45 |
|
|
|
|
|
|
|
|
45 |
200 |
|
|
|
|
|
|
200 |
|
|
|
|
|
|
|
|
|
|
|
|
|
|
|
|
||
|
|
|
|
|
|
|
|
|
|
150 |
GS EMBI Global Div. Model-implied spread |
|
150 |
||||
40 |
|
|
|
|
|
|
|
|
40 |
|
|
|
|
|
|
||
|
|
|
|
|
|
|
|
|
EMBI Global Div. Sovereign-only spread |
|
|
|
|||||
|
|
|
|
|
|
|
|
|
|
|
|
|
|
||||
3510Q1 |
|
|
|
|
|
|
|
|
35 |
100 |
|
|
|
|
|
|
100 |
11Q1 |
12Q1 |
13Q1 |
14Q1 |
15Q1 |
16Q1 |
17Q1 |
18Q1 |
Jan-15 |
Jul-15 |
Jan-16 |
Jul-16 |
Jan-17 |
Jul-17 |
Jan-18 |
Jul-18 |
||
Source: IIF, Goldman Sachs Global Investment Research |
|
|
Source: Goldman Sachs Global Investment Research, Datastream |
|
|
|||||||
|
|
|
|
|
|
|
|
|
||||
Exhibit 28: Low yields and steep curves across much of EM |
|
|
|
|
|
|
||||||
5y Yield (%) |
|
|
|
|
|
|
|
|
|
|
||
14 |
|
|
|
|
|
|
|
|
|
|
|
|
|
|
|
|
|
|
Rates |
|
|
|
|
TRY |
|
|
|
|
|
|
|
Level vs Slope |
|
|
|
|
ARS |
|
12 |
|
|
|
|
|
|
|
|
|
|
|
|
|
|
|
|
|
|
|
|
|
|
|
|
|
10 |
|
|
|
MXN |
|
|
|
|
BRL |
|
|
|
|
|
|
|
|
RUB |
|
|
|
ZAR |
|
|
|
|
|
|
|
|
|
|
|
|
|
|
|
|
8 |
|
|
|
|
|
|
IDR |
|
|
|
|
|
|
|
|
|
INR |
|
|
|
|
|
|
|
|
|
|
|
|
|
COP |
|
|
|
|
|
|
|
6 |
|
|
|
PHP |
|
|
|
|
|
|
|
|
|
|
|
|
|
|
|
|
|
|
|
|
|
|
|
|
|
MYR |
|
RON |
|
|
|
|
|
|
|
|
|
|
|
CLP |
|
|
PEN |
|
|
|
|
4 |
|
|
|
|
|
|
|
|
|
|
||
|
|
|
|
CNY |
|
|
|
|
|
|
||
|
|
|
|
|
|
|
HUF |
|
|
|
|
|
|
|
|
|
|
THB |
PLN |
|
|
|
|
|
|
2 |
|
|
|
KRW |
|
|
|
|
Steeper |
|
||
|
|
|
|
|
|
|
|
|
||||
|
|
|
|
CZK |
|
|
|
|
|
|
|
|
0 |
|
|
|
|
|
|
|
|
|
|
|
|
|
|
|
|
|
|
|
|
|
|
|
|
|
-50 |
0 |
50 |
|
100 |
150 |
200 |
250 |
300 |
350 |
|||
Slope (5y-1y, bps)
Source: Goldman Sachs Global Investment Research
11 December 2018 |
27 |
vk.com/id446425943
Goldman Sachs
EM Macro Navigator
Exhibit 29: EM Financial Conditions |
Exhibit 30: EM Cross Asset Valuation |
Index |
|
|
|
|
|
|
|
|
|
Index |
Z-score |
|
Z-score |
||
106 |
|
|
|
|
|
|
|
|
|
106 |
0.6 |
|
|
0.6 |
|
104 |
|
|
|
tighter |
|
|
|
|
|
104 |
0.4 |
HUFPLN |
|
0.4 |
|
|
|
|
|
|
|
|
|
0.2 |
|
|
0.2 |
||||
|
|
|
|
|
|
|
|
|
|
|
|
|
|||
102 |
|
|
|
|
|
|
|
|
|
102 |
0.0 |
INR THBCZK |
|
0.0 |
|
|
|
|
|
|
|
|
|
|
|
|
|
||||
|
|
|
|
|
|
|
|
|
|
|
-0.2 |
|
-0.2 |
||
|
|
|
|
|
|
|
|
|
|
|
KRWPHP |
|
|||
|
|
|
|
|
|
|
|
|
|
|
|
BRL PEN |
|
|
|
100 |
|
|
|
|
|
|
|
|
|
100 |
-0.4 |
CLP IDR |
|
-0.4 |
|
|
|
|
|
|
|
|
|
|
CNY |
|
|||||
|
|
|
|
|
|
|
|
|
|
|
|
|
EM |
||
|
|
|
|
|
|
|
|
|
|
|
|
TWD TRY |
|
||
|
|
|
|
|
|
|
|
|
|
|
-0.6 |
|
-0.6 |
||
98 |
|
|
|
|
|
|
|
|
EM FCI |
98 |
COP |
|
|||
|
|
|
|
|
|
|
|
-0.8 |
|
|
-0.8 |
||||
|
|
|
|
|
|
|
|
|
|
|
+ive z-score = overvaluation, |
|
|||
|
|
|
|
|
|
|
|
|
|
|
-1.0 |
-ive z-score = undervaluation |
RUB |
-1.0 |
|
96 |
|
|
|
|
|
|
|
|
|
96 |
Equity valuation includes P/E, P/B, D/Y in z-score |
ZAR MYR |
|||
|
|
|
|
|
|
|
|
|
|
Real bond yields using forward inflation expectations |
|
|
|||
08 |
09 |
10 |
11 |
12 |
13 |
14 |
15 |
16 |
17 |
18 |
-1.2 |
MXN -1.6 |
-1.2 |
||
|
|||||||||||||||
|
|
|
|
|
|
|
|
|
|
|
|
|
|||
Source: Goldman Sachs Global Investment Research |
|
Source: FactSet, Datastream, Goldman Sachs Global Investment Research |
|
|
|
Exhibit 31: EM swap rate |
|
Exhibit 32: High-Yield Credit Spreads |
Percent |
|
|
|
|
|
|
|
|
Percent |
Basis point |
|
|
|
|
|
|
|
|
Basis point |
7.0 |
|
|
|
|
|
|
|
|
2.5 |
900 |
|
|
|
|
|
|
|
|
900 |
|
|
|
|
|
|
|
|
|
|
|
|
|
|
|
|
|
|
||
|
|
|
|
|
|
EM 5y Swap rate |
|
|
800 |
|
|
EMBI Global Diversified |
|
|
|
800 |
|||
6.5 |
|
|
|
|
|
|
|
|
|
US HY Market Index |
|
|
|
|
|||||
|
|
|
|
|
|
|
|
|
|
|
|
|
|
|
|||||
|
|
|
|
|
DM 5y Swap rate (rhs) |
|
2.0 |
|
|
|
|
|
|
|
|
||||
|
|
|
|
|
|
|
|
|
|
|
|
|
|
|
|
||||
|
|
|
|
|
|
|
700 |
|
|
|
|
|
|
|
|
700 |
|||
6.0 |
|
|
|
|
|
|
|
|
|
|
|
|
|
|
|
|
|
||
|
|
|
|
|
|
|
|
|
|
|
|
|
|
|
|
|
|
|
|
|
|
|
|
|
|
|
|
|
1.5 |
600 |
|
|
|
|
|
|
|
|
600 |
|
|
|
|
|
|
|
|
|
|
|
|
|
|
|
|
|
|
||
5.5 |
|
|
|
|
|
|
|
|
|
500 |
|
|
|
|
|
|
|
|
500 |
|
|
|
|
|
|
|
|
|
1.0 |
|
|
|
|
|
|
|
|
||
|
|
|
|
|
|
|
|
|
|
|
|
|
|
|
|
|
|
|
|
5.0 |
|
|
|
|
|
|
|
|
|
400 |
|
|
|
|
|
|
|
|
400 |
|
|
|
|
|
|
|
|
|
|
|
|
|
|
|
|
|
|
||
4.5 |
|
|
|
|
|
|
|
|
0.5 |
300 |
|
|
|
|
|
|
|
|
300 |
|
|
|
|
|
|
|
|
|
|
|
|
|
|
|
|
|
|||
|
|
|
|
|
|
|
|
|
|
|
|
|
|
|
|
|
|
||
4.0 |
|
|
|
|
|
|
|
|
0.0 |
200 |
|
|
|
|
|
|
|
|
200 |
10 |
11 |
12 |
13 |
14 |
15 |
16 |
17 |
18 |
19 |
10 |
11 |
12 |
13 |
14 |
15 |
16 |
17 |
18 |
19 |
Source: Goldman Sachs Global Investment Research |
Source: The Yield Book, Citi Index, Goldman Sachs Global Investment Research, Datastream |
Exhibit 33: EM FX Valuation
Percent |
|
|
|
|
|
|
|
|
|
|
|
|
|
|
|
|
|
Percent |
|
4.5 |
|
Year ahead expected EM-DM |
|
|
|
|
overvaluation of EM |
|
25 |
||||||||||
|
|
|
|
|
|
|
|
||||||||||||
4.0 |
|
growth differential |
|
|
|
|
|
|
|
|
20 |
||||||||
|
|
|
|
|
|
|
|
FX vs USD (CEEvs |
|
||||||||||
|
Average GSDEER |
|
|
|
|
|
|
|
|||||||||||
|
|
|
|
|
|
|
|
EUR), % |
|
|
|
|
|
||||||
3.5 |
|
overvaluation (rhs) |
|
|
|
|
|
|
|
|
|
|
15 |
||||||
3.0 |
|
|
|
|
|
|
|
|
|
|
|
|
|
|
|
|
|
|
10 |
2.5 |
|
|
|
|
|
|
|
|
|
|
|
|
|
|
|
|
|
|
5 |
2.0 |
|
|
|
|
|
|
|
|
|
|
|
|
|
|
|
|
|
|
0 |
1.5 |
|
|
|
|
|
|
|
|
|
|
|
|
|
|
|
|
|
|
-5 |
1.0 |
|
|
|
|
|
|
|
|
|
|
|
|
|
|
|
|
|
|
-10 |
0.5 |
|
|
|
|
|
|
|
|
|
|
|
|
|
|
|
|
|
|
-15 |
0.0 |
|
|
|
|
|
|
|
|
|
|
|
|
|
|
|
|
|
|
-20 |
00 |
01 |
02 |
03 |
04 |
05 |
06 |
07 |
08 |
09 |
10 |
11 |
12 |
13 |
14 |
15 |
16 |
17 |
18 |
19 |
TRY excluded from GSDEER and growth differential
Exhibit 34: EM FX Carry vs. Valuation
|
7.5 |
|
|
|
|
|
|
|
5.5 |
|
|
|
|
|
|
carry |
3.5 |
|
|
MXN |
|
IDR |
|
real |
|
|
|
|
|
||
1.5 |
|
ZAR |
MYR |
PLN |
INR |
|
|
year-1 |
|
|
|||||
|
|
|
|
|
RUB |
|
|
|
|
TRY |
|
|
|
CZK |
|
|
|
|
COP |
CNY |
BRLPEN PHP |
|
|
|
-0.5 |
|
|
|
HUF |
THB SGD |
|
|
Undervaluation |
|
|
HKD |
KRW |
||
|
|
|
|
|
CLP |
ILS |
|
|
|
|
|
|
TWD |
|
|
|
-2.5 |
|
|
|
|
|
|
|
|
|
|
|
|
|
|
|
-35 |
-25 |
|
-15 |
-5 |
5 |
15 |
|
|
|
|
GSDEER valuation |
|
|
|
Source: Consensus Economics, Goldman Sachs Global Investment Research |
Source: Consensus Economics, Goldman Sachs Global Investment Research |
11 December 2018 |
28 |