

vk.com/id446425943
EM Macro Navigator
Divergent EM prospects in 2019
nOur 2019 outlooks (published mid/late November) envision considerable divergence in EM growth and policy. The slight improvement in overall EM growth we forecast masks a large variation among individual countries. We forecast growth deceleration in a small majority of EMs we cover—notably in China—but materially better sequential growth in many of the hardest-hit economies this year, including Brazil, Argentina, Turkey, and South Africa.
nEven lower oil, more cautious Fed, trade pause. Since publication of our 2019 forecasts, oil prices have fallen further, the US and China have hit “pause” on further trade escalation, and the Fed has hinted at a possible slowing in the pace of rate hikes in 2019. These developments are potentially good news for EMs (excluding oil exporters) — but significant uncertainty surrounds each one, and our forecasts embody less dovish outcomes for each than currently priced.
nLess pressure on EM central bankers. With inflation low in most countries, current accounts generally in better shape, and the Fed hiking cycle in its later stages, central banks should be able to move at a deliberate pace. In general, we expect broader but shallower tightening next year; a handful of central banks that tightened aggressively should be able to partly unwind these hikes.
nA narrow path to better market performance. The slightly better EM ex-China growth outlook, the approaching end of the Fed cycle, and less demanding valuations create opportunities. We expect modest positive returns across the major EM indices next year, with the most absolute upside in equities, but the highest Sharpe ratios in local bonds (particularly high-yielders).
Recommended Trades and Conviction Views
nChina: Overweight A/H equities; long high-quality HY credit; bias to slightly lower rates, steady USDCNY for now
nEM Asia: Long IDR bonds, Long PHP vs. TWI, Long SGDTHB, Short KRW vs. TWI
nCEEMEA: Dovish on CEE-4, Russia and South Africa rates
nLatAm: Underweight Brazil equities, long CLPCNY
11 December 2018 | 2:12PM HKT
Andrew Tilton
+852-2978-1802 | andrew.tilton@gs.com Goldman Sachs (Asia) L.L.C.
Kamakshya Trivedi
+44(20)7051-4005 | kamakshya.trivedi@gs.com Goldman Sachs International
Kevin Daly
+44(20)7774-5908 | kevin.daly@gs.com Goldman Sachs International
Clemens Grafe
+7(495)645-4198 | clemens.grafe@gs.com Goldman Sachs International
Kenneth Ho
+852-2978-7468 | kenneth.ho@gs.com Goldman Sachs (Asia) L.L.C.
Goohoon Kwon, CFA
+852-2978-0048 | goohoon.kwon@gs.com Goldman Sachs (Asia) L.L.C.
Caesar Maasry
+1(212)902-8763 | caesar.maasry@gs.com Goldman Sachs & Co. LLC
Alberto Ramos
+1(212)357-5768 | alberto.ramos@gs.com Goldman Sachs & Co. LLC
MK Tang
+852-2978-6634 | mk.tang@gs.com Goldman Sachs (Asia) L.L.C.
Investors should consider this report as only a single factor in making their investment decision. For Reg AC certification and other important disclosures, see the Disclosure Appendix, or go to www.gs.com/research/hedge.html.

vk.com/id446425943
Goldman Sachs
Table of Contents
EM Macro Navigator
EM Outlook: Divergent growth and policy prospects in 2019 |
3 |
|
|
GS EM Forecasts and Market Views |
6 |
|
|
The EM Bookshelf: Recent GS EM Macro Research |
12 |
|
|
Thematic Spotlight: Our 2019 outlooks and their sensitivity to shocks |
15 |
|
|
EM Outlook 2019: A narrow path to performance |
16 |
|
|
LatAm 2019 Macro Outlook: An Underwhelming Uneven Recovery |
17 |
|
|
Brazil 2019 Macro Outlook: A New Administration to Deal with Old Challenges |
18 |
|
|
CEEMEA Outlook — Stabilisation at weaker levels |
19 |
|
|
China 2019 outlook: Testing resilience |
20 |
|
|
India 2019 Outlook: Striving for convergence |
21 |
|
|
2019 outlook for Asian exporters: Three potential global headwinds |
22 |
|
|
Oil Drop — The implications of lower oil prices for growth, inflation and monetary policy |
23 |
|
|
Early evidence of US tariffs’ impact on China and Asia |
24 |
|
|
EM Chartpack |
25 |
|
|
Data Monitor – EM Asia |
29 |
|
|
Data Monitor – CEEMEA |
34 |
|
|
Data Monitor – Latam |
38 |
|
|
Goldman Sachs EM Macro Research Team |
41 |
|
|
Disclosure Appendix |
42 |
|
|
11 December 2018 |
2 |
vk.com/id446425943
Goldman Sachs
EM Macro Navigator
EM Outlook: Divergent growth and policy prospects in 2019
After a strong 2017 and early 2018, EM economic and market performance has been decidedly challenged for much of the year. Growth has decelerated, with factors such as weaker demand growth from export destinations, surging oil prices, tightening global financial conditions, and (in the case of Russia in particular) US sanctions leading to rapid contractions in countries such as Argentina, South Africa, Turkey and Russia. China’s economy has also slowed materially in recent months. EM asset prices, particularly equities (down 15% in USD terms) and credit (down 5%), have performed poorly in 2018.
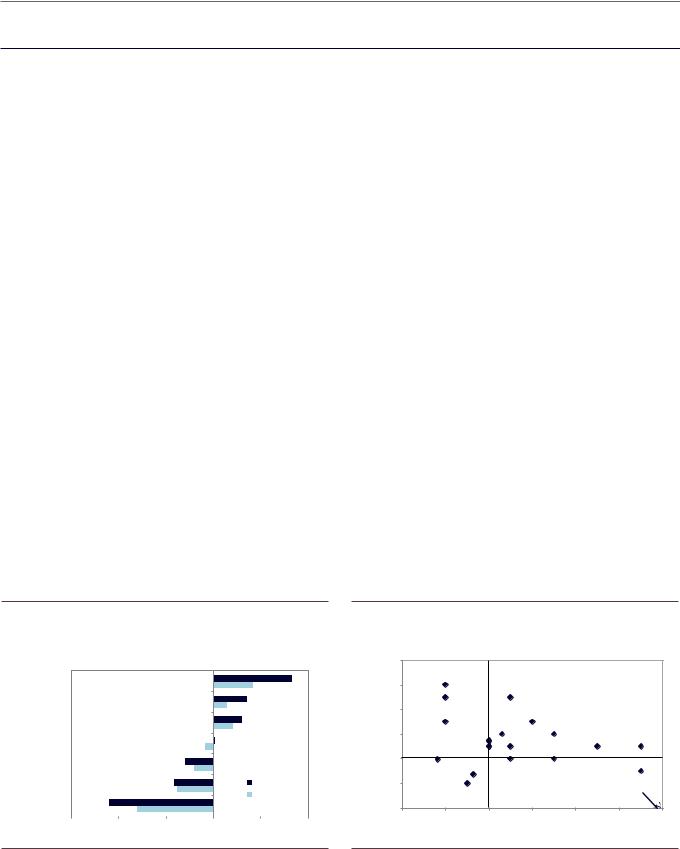
Despite obvious challenges, we anticipate a slightly better EM growth outlook in 2019 (Exhibit 1). This view is mostly driven by our expectation that the EMs hardest-hit in 2018 are in the process of bottoming out, with sequential growth likely to improve from here. At the global level, we expect Brazil and Russia to be the most important contributors to the EM growth improvement, but a number of other economies— particularly in Latam and CEEMEA—could also take part. Material improvements in this group should slightly more than offset moderate deceleration across a majority of EM economies, including China.
The overall state of EM inflation and current account imbalances looks manageable; median EM inflation remains below 3% yoy and current accounts have generally improved from a year ago. Still, as is often the case, averages conceal some notable outliers, most obviously the double-digit inflation rates and previously large current account imbalances in Argentina and Turkey (and of course hyperinflation in Venezuela). While less extreme, high inflation is arguably constraining policy in the Philippines (6.0% yoy CPI inflation as of November), Mexico (4.7% yoy), and Russia (3.8% yoy but set to increase) as well. Current account deficits are also a matter of concern for policymakers in Indonesia and South Africa (nearly 3% of GDP in both countries).
Exhibit 1: We expect better growth in EM in 2019, with China a notable exception
Forecasted change in yoy real GDP growth rate, 2018Q4 to 2019Q4
EM (ex. China)
EM |
|
|
|
|
|
|
|
|
Euro area |
|
|
|
|
|
|
|
|
Global |
|
|
|
|
|
|
|
|
China |
|
|
|
|
|
|
|
|
DM |
|
|
|
GS |
|
|
|
|
|
|
|
Consensus |
|
|
|
||
|
|
|
|
|
|
|
|
|
US |
|
|
|
|
|
|
|
|
|
|
|
|
|
|
|
|
|
-1.5% |
-1.0% |
-0.5% |
0.0% |
0.5% |
1.0% |
|||
Exhibit 2: We expect broader—but generally milder—monetary policy tightening in 2019
|
2.0 |
|
|
|
|
|
|
rate |
1.5 |
|
Brazil |
Chile |
|
|
|
policyin 2019- (%) |
|
|
|
|
|||
|
Colombia |
India |
|
|
|
||
|
|
Peru |
|
|
|
|
|
forforecastchange nowfromuntil end |
1.0 |
|
|
|
|
|
|
|
|
South Africa |
Romania |
Philippines |
|
||
|
0.5 |
|
Taiwan |
Israel |
Czech Rep. |
|
|
|
|
Hungary |
Korea |
|
|||
|
|
China |
Poland |
Mexico |
Indonesia |
||
|
0.0 |
|
Thailand |
|
|||
|
|
Malaysia |
|
|
|||
|
|
|
|
|
|
|
|
GS |
-0.5 |
|
Russia |
|
|
Turkey |
|
|
|
|
|
|
|||
|
-1.0 |
|
|
|
|
Argentina |
|
|
|
|
|
|
|
|
|
|
-1.0 |
-0.5 |
0.0 |
0.5 |
1.0 |
1.5 |
2.0 |
Change in policy rate in 2018 (%)
Source: Goldman Sachs Global Investment Research, Bloomberg |
Source: Haver Analytics, Goldman Sachs Global Investment Research |
Leaving aside these EM pressure points (where policy has already tightened materially and in a few cases could ease next year), we expect monetary policy tightening in 2019 to occur in a broader range of countries but to a milder extent (Exhibit 2). Fiscal policy
11 December 2018 |
3 |
vk.com/id446425943 |
EM Macro Navigator |
Goldman Sachs |
appears likely to loosen in a number of Asian economies, including China, Korea (where the just-passed budget implies meaningful fiscal stimulus in 2019), and several countries facing elections in early 2019.
Recent policy and market events add to the uncertainty around these forecasts:
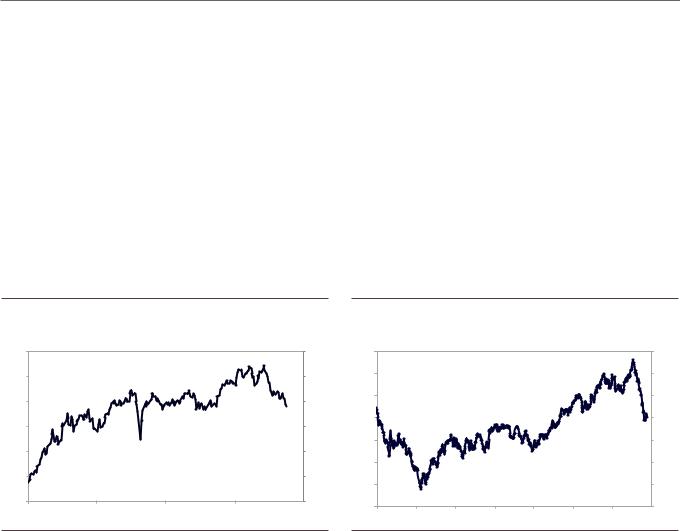
nFed officials have reacted to the tightening in financial conditions and mild deceleration in growth, hinting at a slowing in the pace of rate hikes going forward. Our US team now no longer expects a hike in March, although this remains a close call and we still see three Fed hikes next year, above market pricing (Exhibit 3).
nOil prices have fallen a bit further since our mid-November outlook rollout (Exhibit 4). The decision by OPEC to cut supply by 1.2mb/day should help support prices and our commodities team forecasts a gradual return of spot Brent prices to near $70/bbl.
Exhibit 3: Market has priced out some Fed tightening |
Exhibit 4: A plunge in oil price |
Percent |
|
|
|
Percent |
USD/bbl |
|
|
|
|
|
USD/bbl |
3.4 |
|
|
|
3.4 |
90 |
|
|
|
|
|
90 |
3.2 |
|
|
|
3.2 |
80 |
|
Brent crude oil price |
|
80 |
||
|
|
|
|
|
|
|
|
|
|
||
3.0 |
|
|
|
3.0 |
70 |
|
|
|
|
|
70 |
|
|
|
|
|
|
|
|
|
|
||
2.8 |
|
|
|
2.8 |
60 |
|
|
|
|
|
60 |
|
|
|
|
|
|
|
|
|
|
||
|
|
|
|
|
50 |
|
|
|
|
|
50 |
2.6 |
|
|
|
2.6 |
|
|
|
|
|
|
|
|
Market-implied fed funds rate in December 2019 |
|
40 |
|
|
|
|
|
40 |
||
2.4 |
|
|
|
2.4 |
30 |
|
|
|
|
|
30 |
|
|
|
|
|
|
|
|
|
|
||
2.2 |
|
|
|
2.2 |
20 |
|
|
|
|
|
20 |
Jan-18 |
Apr-18 |
Jul-18 |
Oct-18 |
|
|
|
|
|
|
||
|
Jul-15 |
Jan-16 |
Jul-16 |
Jan-17 |
Jul-17 |
Jan-18 |
Jul-18 |
||||
|
|
|
|
|
|||||||
Source: Goldman Sachs Global Investment Research |
Source: Bloomberg, Goldman Sachs Global Investment Research |
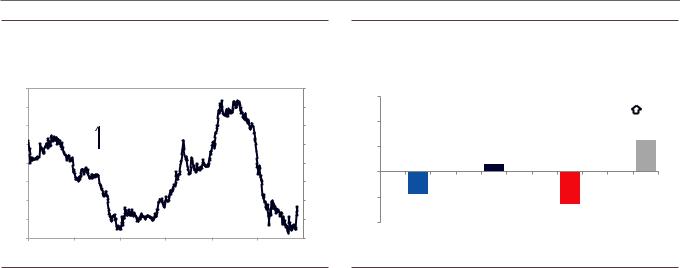
nUS-China trade tensions continue to buffet the markets. A positive tone out of the recent “highly successful” Xi-Trump meeting on the sidelines of the G20, where the US agreed to “pause” escalation of tariffs until March 1 in return for unspecified Chinese purchases of US agricultural goods, among other minor concessions, boosted equity markets. But the positive sentiment was brief, with subsequently more hawkish tones from US officials and the arrest of Huawei’s CFO in Canada reviving doubts about the likelihood of successful negotiations. We still think finding a mutually agreeable compromise that leads to a comprehensive rollback of tariffs will be challenging. We expect USDCNY to remain range-bound below 7 as long as further escalation is avoided (Exhibit 5).
11 December 2018 |
4 |
vk.com/id446425943
Goldman Sachs
EM Macro Navigator
Exhibit 5: CNY likely to remain rangebound if trade escalation is |
Exhibit 6: EM asset valuations much less challenging than a year |
avoided |
|
ago |
|
|
USD/CNY |
USDCNY |
z-score |
EM valuations vs End-2017 |
More Expensive |
6.2 |
6.2 |
1.50since 2003 |
||
|
|
|
vs. History |
|
6.3 |
6.3 |
End-2017 |
|
|
6.4 |
6.4 |
1.00 |
|
|
|
|
|
||
|
Stronger CNY |
|
|
|
6.5 |
6.5 |
0.50 |
|
|
6.6 |
6.6 |
Current |
|
|
6.7 |
6.7 |
0.00 |
|
|
|
|
|
||
6.8 |
6.8 |
-0.50 |
|
|
|
|
|
6.9 |
|
|
|
|
6.9 |
EQUITY |
FX |
CREDIT |
Local Bonds |
|
|
|
|
|
|
-1.00MSCI EM NTM PE (2/3 GSDEER + 1/3 |
EMBI Spread Level GBI-EM Real Rates |
||
7.0 |
|
|
|
|
7.0 |
|
GSFEER) |
|
|
Jan-16 |
Jul-16 |
Jan-17 |
Jul-17 |
Jan-18 |
Jul-18 |
|
|
|
|
Source: Goldman Sachs Global Investment Research Source: Goldman Sachs Global Investment Research
In our view, this uncertain macro environment warrants an incrementally cautious EM outlook that emphasizes idiosyncratic stories and relative value ideas more than ‘global beta’ trades. That said, we see three arguments—growth, valuation, and Fed pricing— that taken together could provide a path to modest positive EM returns in the year ahead. First, as noted previously, we expect a modest improvement in EM ex-China growth in the year ahead (as the US expansion continues, albeit at a slower pace, and as China cushions its bumpy deceleration with calibrated stimulus). Second, we see the Fed hiking cycle as in the home stretch; a year ago, the market was pricing roughly seven 25bp hikes priced versus ten now (and our expectation of 12 cumulatively for the cycle). Third, asset valuations have reverted from ‘expensive’ territory at the start of 2018, and now appear (modestly) inexpensive relative to our models and to history (Exhibit 6).
By asset class, our forecast for EM equities shows the most upside, particularly given the significant premium built into Chinese equities recently, though we do not see strong Sharpe ratios in this asset class going forward. We expect EM FX to appreciate by 2.5% on average by end 2019, reflective both of the improvement in EM economies as well as modest depreciation of the USD. In EM local rates, we see the potential for lower rates in a number of high-yielding EMs and higher rates in most low yielders. EM sovereign spreads appear relatively “fair” compared with our fundamentally driven model—we see room for modest tightening in the index, mostly due to the inclusion of additional GCC economies.
11 December 2018 |
5 |

vk.com/id446425943
Goldman Sachs
GS EM Forecasts and Market Views
EM Macro Navigator
Our economic forecasts reflect slightly better EM growth in 2019; despite mild slowdowns in many countries, others that experienced sharp contractions this year should show meaningful rebounds to positive growth. The EM inflation outlook is generally benign and monetary policy tightening should be broader but shallower. The next two pages summarize our forecasts and market views. The tables at the end of this section review our key economic forecasts, FX forecasts, and conviction views by region and asset class. Links are to the latest detailed research on a particular topic.
Growth in China has slowed substantially in recent months, with our China CAI down to 5.7% in the November preliminary reading from over 7% in the first half. Softer growth reflects a combination of policy tightening in 2017 and early 2018 (regulatory tightening on shadow banking, housing restrictions, etc.) and external pressures (slowing global growth and US tariffs). Policymakers have been easing for several months, working to stabilize credit growth, bolster infrastructure spending, and reassure private businesses—alongside a modest reduction in interest rates and nearly 10% CNY depreciation vs. the USD year-to-date. Going forward, the renminbi will be highly sensitive to US-China trade negotiations, although we expect USD-CNY to remain below 7 as long as further escalation is avoided. Chinese economic growth is likely to slow further as uncertainty persists and export ‘front-loading’ fades, but we expect a bottom at some point in early 2019 and gradual reacceleration thereafter.
Elsewhere in EM Asia, market pressures and policy choices have diverged. In the countries with current account deficits – India, Indonesia, and the Philippines – a combination of internal inflation pressures and capital outflows prompted policy tightening, especially in the latter two countries, and will weigh modestly on growth in 2019. Notably, all these countries face elections in Q2 (a midterm in the Philippines). We think rising food inflation will prompt 75bp of rate hikes by the RBI in 2019, though the just-announced resignation of the central bank governor heightens policy uncertainty. In the Philippines, the decisive shift to monetary tightening and a bill to ease rice imports should bring inflation down significantly. In the small open economies of the region, inflation is low and current accounts strong so central banks have more
flexibility (ex-Hong Kong, where local rates have been pushed higher on capital outflows in the currency board regime) though we see incremental tightening in a few countries for idiosyncratic reasons (e.g. high household debt in Korea and Thailand).
Hopes for a firmer and broader cyclical recovery in Latin America faded as the year progressed, despite the low inflation environment and initially accommodative financial conditions. A sharp downward correction in EM asset prices and a number of idiosyncratic negative developments in some of the largest economies (e.g., Argentina and Brazil) contributed to the disappointing 2018 growth performance. The silver lining to an otherwise-undistinguished 2018 was the manifestly better performance of the small open Andean economies. Overall, LatAm is projected to grow even less in 2018 (1.5%) than the already lackluster performance in 2017 (1.7%). We expect the macroeconomic environment to improve in 2019, but only slightly. A modest acceleration of real GDP
11 December 2018 |
6 |

vk.com/id446425943
Goldman Sachs
EM Macro Navigator
growth, to 2.2%, is expected to be driven by just a handful of economies (those that underperformed expectations the most in 2018—Argentina and Brazil). In Mexico, we expect real GDP growth to dip below 2%, driven by tighter monetary and financial conditions and the impact of policy uncertainty on consumption and investment spending.
For the LA-IT6 economies (Argentina, Brazil, Chile, Colombia, Mexico and Peru) we expect inflation to moderate from 8.6% in 2018, to 6.6% in 2019, and further down to 4.9% in 2020. Inflation should decelerate where it has been high and above the target (Argentina and Mexico), remain moderate and broadly stable in Brazil (around 4%) and be low/stable in the Andean economies (3%-handle).
Where policy rates are currently below neutral (Brazil, Chile, Colombia, and Peru), central banks are likely to gradually remove some of the current monetary accommodation, but in general financial conditions are expected to remain supportive of growth. In Argentina and Mexico real rates are expected to remain above neutral for a while (and financial conditions to remain in restrictive territory) given the need to disinflate the economy, re-anchor inflation expectations, and protect the capital account.
Against a tougher backdrop for EM this year, the deterioration in the performance of the
CEEMEA region has been especially marked. In addition to the headwinds affecting the global economy as a whole, there have also been important idiosyncratic shocks to CEEMEA’s two largest economies (Russia and Turkey). In Turkey, high frequency data point to a sharp contraction in output and inflation is running in excess of 20% yoy. In Russia, growth has been damaged by the escalation in sanctions against certain Russian entities. In South Africa, GDP data suggest that the economy fell into recession in the first half of the year. In the CEE-4, activity has remained relatively unscathed so far, but we expect it to moderate on a sequential basis.
While growth in CEEMEA has slowed significantly, our impulse analysis suggests that the worst of the downturn is now behind us and the latest data point to some stabilisation in activity. We expect the sharp fall in oil prices since mid-October to boost growth and lower inflation, supporting our relatively dovish views on monetary policy in 2019. Though Turkish growth appears likely to remain weak, we expect that the bulk of the downturn will have occurred in 2018H2. Similarly, we expect Russian growth to recover once the impact of the VAT increase in 2019Q1 is absorbed and South Africa to benefit from faster reform momentum following the national elections (which we expect in May). In our view, the risks to future growth and to asset prices for the region as a whole are broadly balanced.
Looking beyond the current cyclical weakness, our medium-term forecasts imply a relatively optimistic view of potential growth across most of CEEMEA and, reflecting the long-term convergence in CEEMEA inflation rates, our terminal rate forecasts are typically below the forwards. In Russia, we believe that growth is likely to be increasingly driven by fiscal and quasi-fiscal policies and geared towards higher investment rates. In Turkey, our modal forecast is for a recovery that will be slower and shallower than previous recoveries, reflecting ongoing stress to balance sheets.
11 December 2018 |
7 |

vk.com/id446425943
Goldman Sachs
EM Macro Navigator
|
|
|
|
Growth (Real GDP)* |
|
|
|
Inflation (CPI)* |
|
|
|
Policy Interest Rate^ |
|
|||||
|
|
|
Latest |
|
GS |
|
Cons |
|
Latest |
GS |
|
Cons |
|
Latest |
|
GS |
|
Cons |
|
|
|
|
2019 |
|
2019 |
|
|
2019 |
|
2019 |
|
|
|
End-19 |
End-19 |
||
|
Mexico |
|
2.5 |
1.9 |
6 |
2.0 |
4.9 |
4.3 |
5 |
4.1 |
8.00 |
|
8.00 |
5 |
7.70 |
|||
|
Colombia |
|
2.7 |
3.2 |
6 |
3.2 |
3.3 |
3.4 |
5 |
3.4 |
4.25 |
|
5.00 |
|
4.80 |
|||
Latam |
|
|
|
|
|
|
|
|
|
|
|
|
|
|
|
|
|
|
Peru |
|
2.3 |
|
4.1 |
5 |
3.9 |
2.2 |
2.8 |
6 |
2.5 |
2.75 |
|
4.00 |
|
3.55 |
|||
|
|
|
|
|
|
|
|
|
|
|
|
|
|
|
|
|
|
|
Chile |
|
2.8 |
3.6 |
6 |
3.5 |
2.9 |
3.3 |
5 |
3.0 |
2.75 |
|
4.00 |
|
3.65 |
||||
|
Brazil |
|
1.3 |
2.6 |
|
|
|
|
|
|
|
|
|
|
|
|
|
|
|
|
5 |
2.4 |
4.6 |
3.7 |
6 |
4.2 |
6.50 |
8.00 |
6 |
7.90 |
|||||||
|
Argentina |
|
-4.2 |
-0.6 |
|
|
|
|
|
|
|
|
|
|
|
|
||
|
|
6 |
-0.6 |
45.9 |
41.2 |
5 |
34.7 |
60.0 |
|
- |
|
36.10 |
||||||
|
Poland |
|
5.7 |
3.8 |
5 |
3.6 |
2.2 |
1.6 |
6 |
2.3 |
1.50 |
1.75 |
|
1.60 |
||||
|
Czech Rep. |
|
2.5 |
2.8 |
|
|
|
|
|
|
|
|
|
|
|
|
||
|
|
6 |
3.0 |
2.2 |
1.8 |
6 |
2.3 |
1.75 |
|
2.00 |
5 |
2.30 |
||||||
|
Hungary |
|
4.9 |
3.5 |
|
|
|
|
|
|
|
|
|
|
|
|
|
|
|
|
5 |
3.3 |
3.8 |
2.6 |
6 |
3.3 |
0.90 |
|
1.25 |
5 |
1.05 |
||||||
|
Romania |
|
4.3 |
3.5 |
|
|
|
|
|
|
|
|
|
|
|
|
|
|
CEEMEA |
|
6 |
3.5 |
4.2 |
2.7 |
6 |
3.4 |
2.50 |
3.00 |
6 |
3.15 |
|||||||
Russia |
|
1.3 |
1.8 |
|
|
|
|
|
|
|
|
|
|
|
|
|||
|
6 |
1.5 |
3.8 |
4.3 |
5 |
4.8 |
7.50 |
|
7.00 |
5 |
7.50 |
|||||||
Ukraine |
|
2.8 |
3.0 |
|
3.1 |
9.5 |
8.0 |
|
8.4 |
18.00 |
|
12.00 |
|
14.80 |
||||
|
|
5 |
|
|
5 |
|||||||||||||
|
|
|
|
|
|
|
|
|
|
|
|
|
|
|
|
|
|
|
|
Turkey |
|
5.2 |
|
-1.5 |
6 |
0.5 |
21.6 |
19.4 |
5 |
19.6 |
24.00 |
|
18.00 |
5 |
21.80 |
||
|
|
|
|
|
|
|
|
|
|
|
|
|
|
|
|
|
|
|
|
South Africa |
|
1.1 |
|
2.2 |
6 |
1.7 |
5.1 |
4.4 |
5 |
5.5 |
6.57 |
|
6.25 |
5 |
6.85 |
||
|
|
|
|
|
|
|
|
|
|
|
|
|
|
|
|
|
|
|
|
Israel |
|
3.1 |
3.3 |
5 |
3.3 |
5.1 |
1.2 |
5 |
1.2 |
0.25 |
0.75 |
5 |
0.65 |
||||
|
|
|
|
|
|
|
|
|
|
|
|
|
|
|
||||
|
China |
|
6.5 |
6.2 |
5 |
6.2 |
2.7 |
2.5 |
5 |
2.4 |
2.51 |
2.50 |
|
- |
||||
|
Hong Kong |
|
2.9 |
2.6 |
5 |
2.5 |
2.7 |
2.3 |
6 |
2.3 |
- |
- |
|
- |
||||
|
Korea |
|
2.0 |
2.5 |
6 |
2.5 |
2.0 |
1.8 |
6 |
1.8 |
1.75 |
2.00 |
|
1.90 |
||||
|
Taiwan |
|
2.3 |
2.3 |
|
|
|
|
|
|
|
|
|
|
|
|
||
ex-Japan |
|
6 |
2.3 |
0.3 |
1.1 |
5 |
1.3 |
1.38 |
|
1.75 |
6 |
1.55 |
||||||
Thailand |
|
3.3 |
3.7 |
|
|
|
|
|
|
|
|
|
|
|
|
|
||
|
5 |
3.9 |
0.9 |
1.4 |
5 |
1.4 |
1.50 |
|
1.75 |
|
1.95 |
|||||||
Malaysia |
|
4.4 |
4.6 |
|
|
|
|
|
|
|
|
|
|
|
|
|
||
|
|
4.6 |
0.6 |
2.3 |
|
2.2 |
3.25 |
3.25 |
|
3.30 |
||||||||
Asia |
|
6 |
6 |
6 |
||||||||||||||
Singapore |
|
2.2 |
2.6 |
|
2.7 |
0.7 |
1.4 |
|
1.4 |
- |
- |
|
- |
|||||
|
|
5 |
5 |
|
||||||||||||||
|
India** |
|
7.1 |
7.6 |
|
|
|
|
|
|
|
|
|
|
|
|
||
|
|
6 |
7.5 |
3.3 |
5.1 |
5 |
4.7 |
6.50 |
|
7.25 |
|
6.85 |
||||||
|
Indonesia |
|
5.2 |
5.0 |
|
|
|
|
|
|
|
|
|
|
|
|
|
|
|
|
6 |
5.1 |
3.2 |
3.3 |
5 |
3.8 |
6.00 |
6.25 |
|
6.40 |
|||||||
|
|
|
|
|
|
|
|
|
|
|
|
|
|
|
|
|
||
|
Philippines |
|
6.1 |
|
6.0 |
6 |
6.4 |
3.2 |
3.9 |
6 |
4.4 |
4.75 |
|
4.50 |
|
5.00 |
||
|
US |
|
3.0 |
2.5 |
6 |
2.6 |
2.5 |
1.8 |
6 |
2.3 |
2.13 |
3.13 |
6 |
3.15 |
||||
G3 |
Euro Area |
|
1.6 |
1.6 |
6 |
1.6 |
2.2 |
1.3 |
5 |
1.7 |
0.00 |
0.00 |
|
0.10 |
||||
|
Japan |
|
0.1 |
0.9 |
6 |
1.0 |
1.4 |
1.0 |
6 |
1.1 |
-0.07 |
-0.05 |
|
0.00 |
||||
|
|
|
|
|
|
|
|
|
|
|
|
|
|
|
|
|
|
|
*The latest growth/inflation figures refer to the yoy growth of the latest quarter/month available; Annual average data are used for GS forecasts and consensus **Fiscal year forecasts for India. 2018 is India FY19 (April 2018-Mar 2019)
^ End of year forecasts and consensus for policy rates:
LATAM: Mexico: TdF bancario; Colombia:Overnight target rate; Peru: Central bank reference rate; Chile: Overnight target rate; Brazil: SELIC target rate; CEEMA: Poland: 7-day intervention rate; Czech Re.: 2-week limit repo rate; Hungary: 2-week repo rate; Romania: one week repo rate;
Russia: CBR 1-week repo rate; Ukraine: Discount rate; Turkey: one week repo rate; South Africa: Repo avg rate; Israel: discount rate;
AEJ: China: 7-day repo (intraday; 5d moving average used for actual); Korea: 7-day repo;Taiwan: rediscount rate; Thailand: 1-day repo;
Malaysia: overnight policy rate; India: repo rate; Indonesia: 7-day reverse repo rate; Philippines: repo rate. G3: US: Federal Funds Target Rate; Euro Area: Main refinancing operations (fixed rate); Japan: Overnight call rate.
Red shading indicates GS forecast meaningfully above consensus, blue shading indicates below. Up triangles indicate upward adjustments in GS forecasts since the last publication and vice versa.
Source: Goldman Sachs Global Investment Research, Bloomberg
11 December 2018 |
8 |

vk.com/id446425943
Goldman Sachs
EM Macro Navigator
|
|
|
|
|
|
|
FX (against USD*) |
|
|
|
|
GSDEER |
|
GSFEER |
||||
|
|
|
Spot |
GS |
|
Forward |
GS |
|
Forward |
GS |
|
Forward |
|
|
|
|
||
|
|
|
11-Dec |
3-month |
3-month 6-month |
6-month |
12-month |
12-month |
2018 |
2018 |
||||||||
|
Mexico |
|
20.3 |
19.8 |
|
5 |
20.7 |
19.5 |
|
5 |
21.0 |
19.3 |
5 |
21.7 |
16.2 |
18.8 |
||
|
Colombia |
|
3190 |
3050 |
|
5 |
3202 |
3000 |
|
5 |
3214 |
2950 |
5 |
3242 |
2620 |
3324 |
||
Latam |
Peru |
|
3.37 |
3.30 |
|
5 |
3.39 |
3.27 |
|
5 |
3.40 |
3.25 |
5 |
3.42 |
3.07 |
3.47 |
||
Chile |
|
680 |
650 |
|
5 |
675 |
640 |
|
5 |
675 |
630 |
5 |
675 |
583 |
748 |
|||
|
Brazil |
|
3.92 |
3.70 |
|
6 |
3.91 |
3.60 |
|
|
3.94 |
3.60 |
5 |
4.01 |
3.39 |
3.85 |
||
|
|
|
|
|
|
|
|
|
|
|
|
|
|
|
|
|
|
|
|
Argentina |
|
37.7 |
38.0 |
|
|
42.0 |
45.0 |
|
5 |
45.9 |
48.0 |
5 |
52.8 |
33.7 |
- |
||
|
|
|
|
|
|
|
|
|
|
|
|
|
|
|
|
|
|
|
|
Poland (v EUR) |
|
3.78 |
4.25 |
|
|
4.30 |
4.20 |
|
|
4.32 |
4.15 |
|
4.37 |
4.15 |
4.30 |
||
|
|
|
|
|
|
|
|
|
|
|
|
|
|
|
|
|
|
|
|
Czech Rep. (v EUR) |
|
22.8 |
25.5 |
|
|
25.9 |
25.4 |
|
|
26.1 |
25.3 |
5 |
26.3 |
27.7 |
25.6 |
||
|
|
|
|
|
|
|
|
|
|
|
|
|
|
|
|
|
|
|
|
Hungary (v EUR) |
|
285 |
318 |
|
|
323 |
318 |
|
|
324 |
315 |
|
325 |
312 |
307 |
||
|
|
|
|
|
|
|
|
|
|
|
|
|
|
|
|
|
|
|
CEEMEA |
Romania (v EUR) |
|
4.09 |
4.70 |
|
5 |
4.69 |
4.75 |
|
5 |
4.73 |
4.80 |
5 |
4.83 |
- |
- |
||
|
|
|
|
|
|
|
|
|
|
|
|
|
|
|
|
|
|
|
Russia |
|
66.7 |
70.0 |
|
5 |
67.6 |
68.0 |
|
5 |
68.4 |
65.0 |
5 |
70.2 |
60.7 |
75.8 |
|||
|
|
|
|
|||||||||||||||
|
|
|
|
|
|
|
|
|
|
|
|
|
|
|
|
|
|
|
|
Ukraine |
|
27.72 |
27.5 |
|
5 |
29.4 |
27.0 |
|
5 |
30.8 |
26.5 |
5 |
33.6 |
- |
- |
||
|
Turkey |
|
5.33 |
5.50 |
|
|
|
|
|
|
|
|
|
|
|
|
|
|
|
|
|
6 |
5.63 |
6.00 |
|
6 |
5.90 |
6.50 |
6 |
6.39 |
3.23 |
5.02 |
|||||
|
|
|
|
|
|
|
|
|
|
|
|
|
|
|
|
|
|
|
|
South Africa |
|
14.4 |
14.3 |
|
5 |
14.2 |
13.8 |
|
5 |
14.4 |
13.5 |
5 |
14.7 |
10.5 |
15.7 |
||
|
|
|
|
|
|
|
|
|
|
|
|
|
|
|
|
|
|
|
|
Israel |
|
3.75 |
3.60 |
|
6 |
3.71 |
3.50 |
|
6 |
3.68 |
3.45 |
|
3.63 |
3.71 |
3.82 |
||
|
|
|
|
|
|
|
|
|
|
|
|
|
|
|
|
|
|
|
|
China |
|
6.91 |
6.95 |
|
5 |
6.90 |
7.10 |
|
|
6.91 |
6.90 |
5 |
6.93 |
5.75 |
7.4 |
||
|
|
|
|
|
|
|
|
|
|
|
|
|
|
|
|
|
|
|
|
Hong Kong |
|
7.81 |
7.85 |
|
|
7.80 |
7.85 |
|
|
7.78 |
7.85 |
|
7.77 |
7.63 |
8.7 |
||
|
|
|
|
|
|
|
|
|
|
|
|
|
|
|
|
|
|
|
|
Korea |
|
1129 |
1140 |
|
5 |
1115 |
1160 |
|
5 |
1110 |
1170 |
5 |
1099 |
1259 |
1202 |
||
|
Taiwan |
|
30.9 |
31.5 |
|
|
|
|
|
|
|
|
|
|
|
|
|
|
Japan-ex |
|
|
5 |
30.6 |
31.5 |
|
6 |
30.4 |
31.0 |
5 |
29.9 |
30.2 |
31.3 |
|||||
Thailand |
|
32.8 |
34.0 |
|
|
32.7 |
34.5 |
|
5 |
32.6 |
33.5 |
5 |
32.4 |
33.3 |
34.0 |
|||
|
|
|
|
|
||||||||||||||
|
|
|
|
|
|
|
|
|
|
|
|
|
|
|
|
|
|
|
Asia |
Malaysia |
|
4.18 |
4.20 |
|
5 |
4.16 |
4.25 |
|
|
4.17 |
4.20 |
5 |
4.19 |
3.53 |
4.36 |
||
Singapore |
|
1.37 |
1.38 |
|
|
1.37 |
1.37 |
|
|
1.36 |
1.34 |
|
1.36 |
1.44 |
1.50 |
|||
|
|
|
5 |
|
5 |
|
||||||||||||
|
|
|
|
|
|
|
|
|
|
|
|
|
|
|
|
|
|
|
|
India |
|
71.3 |
74.0 |
|
5 |
71.4 |
74.0 |
|
5 |
72.2 |
71.0 |
5 |
73.7 |
69.7 |
78.4 |
||
|
|
|
|
|
|
|
|
|
|
|
|
|
|
|
|
|
|
|
|
Indonesia |
|
14613 |
15000 |
|
5 |
14768 |
14800 |
|
5 |
14966 |
14400 |
5 |
15361 |
14159 |
16129 |
||
|
|
|
|
|
|
|
|
|
|
|
|
|
|
|
|
|
|
|
|
Philippines |
|
52.9 |
53.0 |
|
|
53.1 |
52.0 |
|
6 |
53.4 |
50.0 |
6 |
54.0 |
50.6 |
56.2 |
||
|
|
|
|
|
|
|
|
|
|
|
|
|
|
|
|
|
|
|
G3 |
Euro Area |
|
1.14 |
1.12 |
|
6 |
1.15 |
1.17 |
|
6 |
1.16 |
1.20 |
6 |
1.18 |
1.29 |
1.12 |
||
|
|
|
|
|
|
112 |
110 |
|
|
111 |
108 |
|
109 |
96.0 |
102 |
|||
Japan |
|
113.1 |
112 |
|
5 |
|
6 |
6 |
||||||||||
|
|
|
|
|||||||||||||||
|
|
|
|
|
|
|
|
|
|
|
|
|
|
|
|
|
|
|
*Poland, Czech Republic, Hungary, and Romania are expressed vs EUR.
Source: Goldman Sachs Global Investment Research, Bloomberg
11 December 2018 |
9 |

vk.com/id446425943
Goldman Sachs
EM Macro Navigator
GS Conviction Views in EM
LATAM
RATES |
FX |
EQUITIES |
CREDIT |
|
Long CLP funded out |
Underweight Brazil |
|
|
of CNY |
|
|
|
Dovish on CEE-4, |
Cautious TRY |
|
Prefer Qatar credit |
|
Russia, South Africa |
|
|
on index inclusion, |
CEEMEA |
|
|
cautious Turkey, |
|
rates |
|
|
||
|
|
Prefer Kenya over |
||
|
|
|
|
Lebanon credit |
|
|
|
|
Ghana |
|
|
|
|
|
|
|
|
|
|
|
Bias still to lower rates |
USDCNY remains |
Overweight A Share |
Prefer high quality |
CHINA |
(7-day repo bottoms |
slightly below 7 as |
|
China HY, single-A, |
around 2.25% in early |
long as trade |
|
IG LGFVs, senior |
|
2019) |
escalation avoided |
|
corporate perpetuals; |
|
|
|
|
|
avoid BBB and |
|
|
|
|
riskiest HY |
|
|
|
|
|
EX-CHINA |
Long IDR 10-year |
Long PHP vs. top-7 |
Overweight China, |
Prefer Indonesia |
bonds |
currencies TWI basket |
Philippines, |
IG, neutral towards |
|
|
|
Singapore. |
India IG |
|
|
Short KRW vs. top-6 |
Underweight |
||
|
|
|||
|
currencies TWI basket |
Korea, Taiwan, HK |
|
|
- |
|
|
|
|
ASIAEM |
|
Long SGD/THB |
|
|
|
|
|
|
|
|
|
|
|
|
G3/GLOBAL
Pay 2y1y SONIA vs. receive 2y1y EONIA
Enter 2s30s UST flattener
Long 5-year US inflation swaps
Short USD/CAD
Short EUR/SEK
Long AUD & NZD vs. EUR
Receive a basket of high-yielders 5-yr swaps (ZAR, MXN, COP) vs. 10-year swaps in low-yielders (PLN, HUF, THB, KRW)
Long MSCI EM |
Long agency MBS |
|
hedged with |
vs. IG credit |
|
MSCI EAFE |
Short IG |
|
Underweight US |
||
idiosyncratic risk |
||
equities and |
funded with AAA |
|
shift to higher |
CMBX |
|
quality stocks |
|
Source: Goldman Sachs Global Investment Research
11 December 2018 |
10 |
vk.com/id446425943
Goldman Sachs
Key upcoming events for EM investors
EM Macro Navigator
CEE-4
European parliamentary election (May)
US
Possible tariffs on imported
autos (ongoing) |
ISRAEL |
Possible escalation of tariffs 4Q GDP Release
on $200bn of imports from |
Sun, Mar 11 |
China (March 1) |
|
NIGERIA
General election (Feb)
BRAZIL
Jair Bolsonaro sworn in as
Brazil's president (Jan 1)
RUSSIA
US sanctions bill (likely 2019H1)
UKRAINE
Presidential elections (1st round Mar, 2nd round Apr)
TURKEY
Local elections (March)
ASIA
CHINA
Central Economic Work Conference (Dec 18)
XL ERRMZIVWEV] SJ ŰSTIRMRK YTű (IG
2EXMSREP 4ISTPIŭW
Congress/CPPCC meetings (March)
NORTH KOREA
US-North Korea 2nd summit (2019Q1)
INDIA |
|
PHILIPPINES |
|
Midterm elections |
|
State elections in |
THAILAND |
(May 13) |
Madhya Pradesh, |
General elections |
|
Rajasthan and |
(Feb 24) |
|
Chhattisgarh (Dec)General elections
(Apr/May)
INDONESIA
General elections (Apr)
SOUTH AFRICA
General election (likely May)
Source: Goldman Sachs Global Investment Research
11 December 2018 |
11 |