

vk.com/id446425943
Goldman Sachs
Credit Outlook
Chemicals: Karl Blunden
Sector view
We have a Neutral coverage view on HY Chemicals. Broadly, we expect earnings to be challenged by weakening supply/demand across several major chemical chains (most notably, ethylene) and believe cost inflation (freight, labor, raw materials) is likely to weigh on all parts of the supply chain. This sets up a volatile and negatively skewed risk/reward outlook for a sector whose constituents have reduced business diversification in recent years.
However, following the sector’s underperformance in 4Q18, valuations have become
more attractive and we see opportunity in select credits with idiosyncratic spread
drivers. In the context of cost inflation, we expect vertically integrated credits (TROX,
OLN) to deliver superior earnings performance. We also see the potential for credit rating upgrades to drive spread tightening (HUN). While pockets of positive earnings momentum exist in the space (e.g. nitrogen), we believe these tailwinds are largely priced in for credits such as CF, where unfavorable capital allocation policies (similar to
POL) will likely drive below-sector returns.
Our top trade idea in the space is to Buy TROX 5.75% 2025s (on the HY CL) as we think the company’s feedstock integration positions it to preserve margins in an environment of inflating costs and peaking TiO2 prices. We expect Tronox’s favorable cost structure to generate cash flow for debt reduction (regardless of its pending M&A outcomes), driving a reassessment of its credit risk. OLN (OP) is another commodity credit with an advantaged cost structure (with producer economics in ethylene sourcing and precursor capacity in the epoxy chain). We expect higher epoxy volumes at OLN and a gradual improvement in its chlor-alkali segment (despite recent weakness) to support deleveraging and credit rating momentum over the long-term. We think HUN (OP) is the most likely IG upgrade candidate in the space and would expect bonds to compress toward low-quality IG peers (EMN, SHW, MOS, WLK).
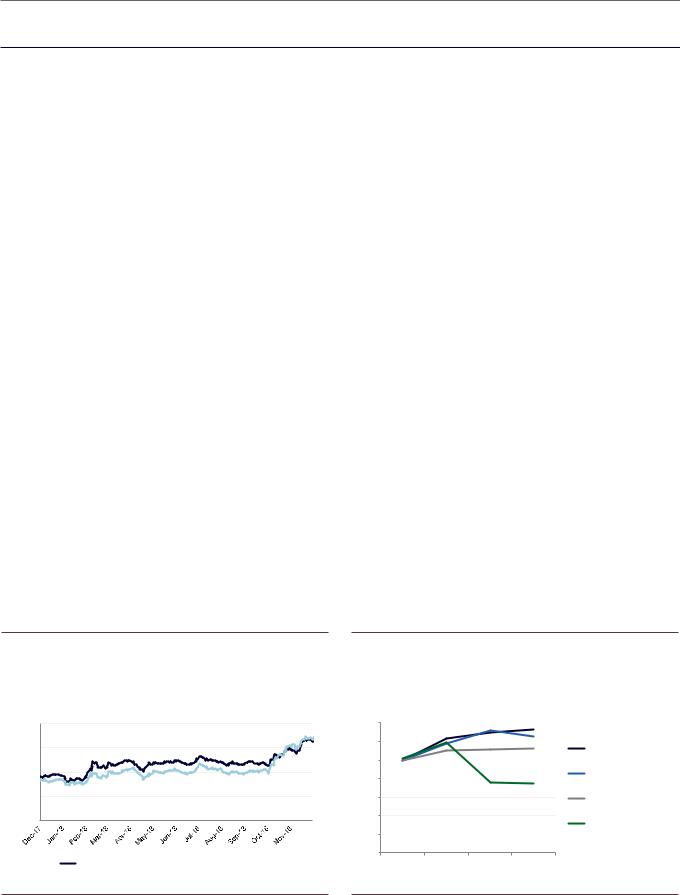
Exhibit 33: HY Chemicals has returned 110bp less than the HY Market in 4Q-to-date
YTW (%)
|
8.0 |
|
% |
7.0 |
|
Worst |
6.0 |
|
Yield to |
||
5.0 |
||
|
4.0 |
High Yield Market Index |
|
HY Chemicals |
|
Exhibit 34: We expect margin pressures and softening chemical chain fundamentals to limit spread compression at HY Chemical producers in 2019...
Chemical chain outlook, indexed to 100 (2017 to 2020)
140 |
|
|
|
|
|
120 |
|
|
|
|
|
100 |
|
|
|
|
|
80 |
|
|
Nitrogen and chlor- |
|
|
60 |
|
|
alkali improvement is |
...and TiO2/PE |
|
|
slowing... |
|
|
pricing looks to be |
|
40 |
|
challenged in 2019 |
20 |
|
|
|
|
0
2017 2018E 2019E 2020E
Urea NOLA
OLN chlor-alkali margin
TIO2
NCX polyethylene margin
Source: The Yield Book.; FTSE Index, Goldman Sachs Global Investment Research |
Source: TZMI, Goldman Sachs Global Investment Research, CRU |
4 December 2018 |
15 |

vk.com/id446425943
Goldman Sachs
Credit Outlook
Exhibit 35: ...driving our preference for integrated chemical producers (e.g. TROX/OLN) that we expect will preserve margins amidst cost inflation and peaking commodity prices
Relative value summary with level of integration and cost curve position for commodity chemical producers
|
|
|
Commodity... |
|
|
|
|
|
|
...Specialty |
|
|
|
|
CF |
NCX |
TROX |
CC |
OLN |
HXN |
HUN |
PAH |
POL |
ASH |
|
|
|
CF |
Nova |
Tronox |
Chemours |
Olin |
Hexion |
Huntsman |
Platform |
Polyone |
Ashland |
|
|
|
Industries |
Chemicals |
|
||||||||
|
|
|
|
|
|
|
|
|
|
|
||
|
GS Rating |
U |
IL |
OP |
IL |
OP |
NC |
OP |
NC |
IL |
IL |
|
|
Level of integration |
medium |
medium |
high |
low |
high |
- |
- |
- |
- |
- |
|
|
Cost curve position (1=best 4=worst) |
1 |
2 |
2 |
1 |
2 |
- |
- |
- |
- |
- |
|
|
Revenue |
4,396 |
4,481 |
1,854 |
6,748 |
6,931 |
3,788 |
9,346 |
3,544 |
3,500 |
3,743 |
|
|
EBITDA |
1,324 |
1,439 |
523 |
1,794 |
1,242 |
469 |
1,554 |
845 |
381 |
683 |
|
|
Free Cash Flow |
802 |
457 |
81 |
675 |
288 |
(90) |
228 |
(16) |
130 |
99 |
|
|
Net Leverage (LTM) |
2.8x |
1.5x |
2.7x |
1.5x |
2.6x |
7.8x |
1.3x |
6.0x |
3.0x |
3.3x |
|
|
Net Leverage (FY19E) |
1.8x |
3.1x |
2.7x |
1.3x |
2.1x |
- |
0.9x |
- |
2.4x |
2.7x |
|
|
Net Leverage (FY20E) |
1.4x |
3.0x |
2.3x |
1.0x |
1.6x |
- |
0.5x |
- |
2.0x |
2.2x |
|
|
|
|
|
|
|
|
|
|
|
|
|
|
|
Coupon |
3.450% |
4.875% |
5.750% |
7.000% |
5.125% |
9.000% |
5.125% |
5.875% |
5.250% |
4.750% |
|
|
Maturity |
6/1/2023 |
6/1/2024 |
10/1/2025 |
5/15/2025 |
9/15/2027 |
11/15/2020 |
11/15/2022 |
12/1/2025 |
3/15/2023 |
8/15/2022 |
|
|
Outstanding (mn) |
750 |
1050 |
450 |
750 |
500 |
574 |
400 |
800 |
600 |
1086 |
|
|
S&P/Moodys |
BB+/Ba3 |
BB+/Ba2 |
B-/B3 |
BB-/Ba3 |
BB+/Ba1 |
CCC/Ca |
BB+/Ba1 |
B+/Caa1 *+ |
BB-/Ba3 |
BB-/Ba3 |
|
|
Bid Price |
93.750 |
93.750 |
84.750 |
101.750 |
94.250 |
47.000 |
101.875 |
97.750 |
99.625 |
99.250 |
|
|
YTW (%) |
5.0% |
6.2% |
8.8% |
6.5% |
6.0% |
57.8% |
4.6% |
6.3% |
5.3% |
5.0% |
|
|
OAS (bp) |
219 |
338 |
587 |
347 |
295 |
5490 |
171 |
321 |
252 |
211 |
|
|
|
|
|
|
|
|
|
|
|
|
|
|
Source: Company data, Bloomberg, Goldman Sachs Global Investment Research |
|
|
|
|
|
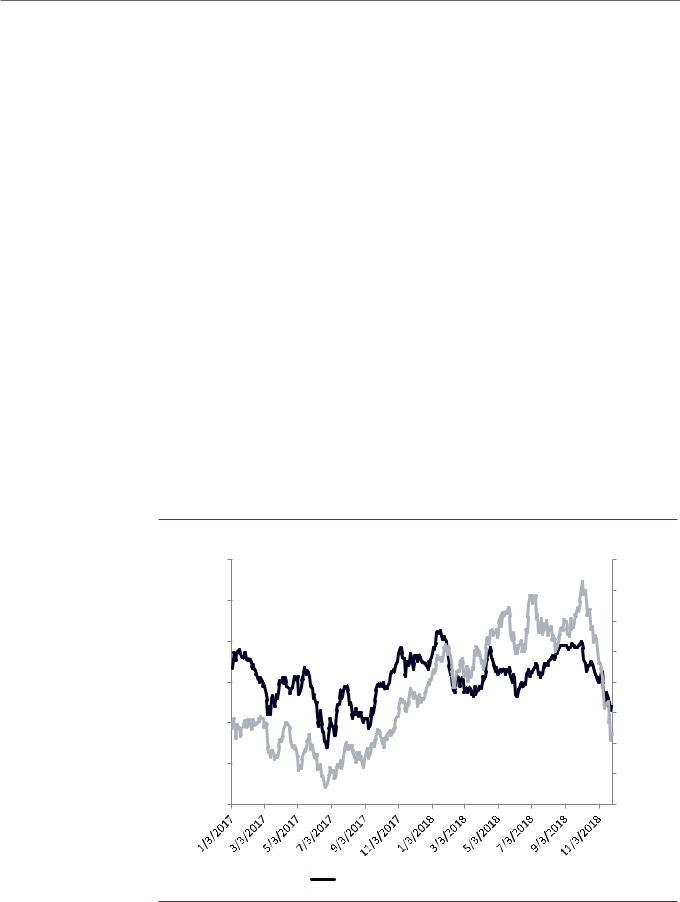
Exhibit 36: Rising feedstock costs (in both the TiO2 and ethylene |
|
Exhibit 37: ...which we think will help drive spread compression at |
chains) will likely weigh on non-integrated commodity chemical |
|
credits with more favorable cost structures (e.g. TROX, OLN) |
producers |
|
YTW (%) |
Ore price forecasts (from VNTR, LHS) and NA TiO2 pricing (RHS) |
|
|
|
$2,000 |
$2.50 |
|
|
$1,800 |
$2.00 |
|
($/mT) |
$1,600 |
||
$1,400 |
$1.50 |
||
$1,200 |
|||
price |
$1,000 |
|
|
$800 |
$1.00 |
||
Ore |
$600 |
|
|
$400 |
$0.50 |
||
|
|||
|
$200 |
|
|
|
$0 |
$0.00 |
Rutile |
10.0% |
|
Market pricing not accurately |
|
|
|
|
|
|
||
Chloride |
9.0% |
|
reflecting integrated business models |
||
8.0% |
|
(TROX, OLN) |
|
|
|
slag |
|
|
|
|
|
Sulfate |
7.0% |
|
|
|
|
slag |
6.0% |
|
|
|
|
|
|
|
|
|
|
Ilmenite |
5.0% |
|
|
|
|
|
|
|
|
|
|
TiO2 |
4.0% |
|
|
|
|
|
|
|
|
|
|
Price |
3.0% |
|
|
|
|
($/lb) |
Jan-18 |
Feb-18 Mar-18 |
Apr-18 May-18 Jun-18 |
Jul-18 Aug-18 Sep-18 |
Oct-18 Nov-18 |
|
|||||
|
HY Chemicals |
TROX 5.75% 2025 |
CC 7% 2025 |
OLN 5.125% 2027 |
|
Source: Company data, Venator, TZMI |
Source: The Yield Book Inc.; FTSE Index, Bloomberg |
Exhibit 38: In specialty chems, we think producers have limited growth opportunities and will experience only incremental margin expansion
Adj. EBITDA margin
25% |
|
|
|
|
|
|
20% |
|
|
|
|
|
|
15% |
|
|
|
|
|
|
10% |
|
|
|
|
|
|
5% |
|
|
|
limited margin |
|
|
|
|
|
improvement in 2019 |
|
||
0% |
|
|
|
|
|
|
2014 |
2015 |
2016 |
2017 |
2018E |
2019E |
2020E |
ASH HUN POL
Exhibit 39: We therefore favor credits with idiosyncratic catalysts such as HUN (potential IG upgrade)
HUN relative value summary
|
HUN |
(Specialty) |
IG Peers |
(Commodity) |
||||
|
EMN |
SHW |
|
|
MOS |
WLK |
||
|
Huntsman |
Eastman |
Sherwin |
|
|
Mosaic |
Westlake |
|
|
Chemical |
Williams |
|
|||||
|
|
|
|
|
|
|||
GS Rating |
OP |
NC |
NC |
|
|
NC |
NC |
|
S&P |
BB+ |
BBB |
BBB |
|
|
BBB- |
BBB |
|
MDY |
Ba1 |
Baa2 |
Baa3 |
|
|
Baa3 |
Baa2 |
|
Fitch |
NA |
BBB |
BBB |
|
|
BBB-u |
BBB |
|
EBITDA |
$1,554 |
|
$2,270 |
$2,496 |
|
|
$1,618 |
$2,191 |
Net Leverage |
1.3x |
2.8x |
3.8x |
|
|
2.2x |
0.9x |
|
EV/EBITDA |
5.1x |
8.8x |
20.9x |
|
|
10.1x |
6.0x |
|
|
|
|
|
|
|
|
||
Bond |
5.125% 2022 |
|
3.6% 2022 |
2.75% 2022 |
3.25% 2022 |
3.6% 2022 |
||
Call date |
MW |
MW |
MW |
|
|
MW |
MW |
|
Call price |
|
|
||||||
|
|
|
|
|
|
|
|
|
Amount |
400 |
|
750 |
1,250 |
|
|
550 |
250 |
Bid Price |
101.875 |
|
99.220 |
95.703 |
|
|
96.810 |
98.230 |
YTW (%) |
4.6% |
|
3.8% |
4.1% |
|
|
4.1% |
4.1% |
OAS (bp) |
171 |
|
97 |
125 |
|
|
130 |
128 |
Source: Company data, Goldman Sachs Global Investment Research |
Source: Company data, Goldman Sachs Global Investment Research, Bloomberg |
4 December 2018 |
16 |

vk.com/id446425943
Goldman Sachs
Best idea
Credit Outlook
Trade idea: Buy TROX 5.75% 2025s (on our HY CL) as we think the company’s feedstock integration positions it to preserve margins in an environment of inflating costs and peaking TiO2 prices.
While we believe pigment pricing has reached its peak, we believe supply-side conservatism (especially outside of China, where new capacity additions remain limited) and a shifting focus toward price stability will lead to only moderate declines in pigment pricing to levels that are still supportive of cash generation and deleveraging (at TROX specifically). We think TROX is still well positioned to delever its balance sheet given its integrated cost position (that allows it to benefit from rising feedstock costs negatively impacting its peers), which we believe will drive investors to reassess Tronox’s credit risk at the conclusion of its pending Cristal transaction (regardless of the outcome).
Risks to our rating: Higher-than-expected integration costs, declining synergy realization following potential asset sales, TiO2 cycle downturn
Exhibit 40: Tronox bonds have weakened significantly as TiO2 price increases have stalled..
Tronox bond pricing
Exhibit 41: ...but its integrated business model should allow it to outperform pigment peers and continue to delever even with flat to declining pigment prices
Summary financials
|
|
|
Tronox (TROX) |
FY:16 |
FY:17 |
FY:18E |
FY:19E |
FY:20E |
$110 |
2026s were issued |
|
Financials ($, mns) |
|
|
|
|
|
|
TROX bonds have sold |
Revenues |
2,093 |
1,698 |
1,843 |
1,735 |
1,777 |
|
|
|
|||||||
$105 |
|
off 8-9 points in 4Q18 |
EBITDA |
314 |
421 |
538 |
473 |
487 |
$100 |
|
|
Total Debt |
3,054 |
3,147 |
3,165 |
3,165 |
3,165 |
|
|
|
Cash |
251 |
1,769 |
1,764 |
1,888 |
2,027 |
$95 |
|
|
Net Debt |
2,803 |
1,378 |
1,401 |
1,277 |
1,138 |
$90 |
|
|
Debt/EBITDA |
9.7x |
9.2x |
5.9x |
6.7x |
6.5x |
|
|
Net Debt/EBITDA |
8.9x |
4.0x |
2.6x |
2.7x |
2.3x |
|
|
|
|
||||||
$85 |
|
|
Net Debt/Cap |
71% |
58% |
61% |
58% |
53% |
$80 |
|
|
CFO |
211 |
166 |
215 |
268 |
283 |
|
|
Capex |
(119) |
(91) |
(121) |
(120) |
(120) |
|
|
|
|
||||||
|
|
|
Dividends |
(46) |
(23) |
(23) |
(24) |
(24) |
|
|
|
Free Cash Flow |
46 |
52 |
71 |
124 |
139 |
|
TROX 5.75% 2025 |
TROX 6.5% 2026 |
TiO2 price ($/lb) |
$1.28 |
$1.48 |
$1.67 |
$1.61 |
$1.62 |
Source: Bloomberg
Exhibit 42: Beyond standalone fundamentals, many asset sale scenarios support deleveraging
Net leverage under various asset sale scenarios at TROX
Potential asset sale
PF net leverage under the assumed sale of Ashtabula 1 & 2
FY18 PF net leverage (without remedy package)
Comment
|
Asset sale multiple |
|
|
2.0x |
3.0x |
4.0x |
5.0x |
3.1x |
2.9x |
2.8x |
2.6x |
3.0x
EBITDA assumptions are calculated by taking an average pigment EBITDA/kt from CC/VNTR in FY17, and applying that to the respective facility production capacity
Asset sale multiples represent a range determined from recent asset sales and publically traded pigment producing comps (VNTR, 2.2x , CC, 4.2x; initial Ashtabula valuation of 5.5x)
Source: Company data, Goldman Sachs Global Investment Research
Exhibit 43: Increasing Chinese capacity is one of the main risks to TiO2; export pressure has moderated from early 2018 levels
Net exports from China (tons) by month
100,000 |
|
|
|
|
|
|
|
|
|
|
|
|
|
|
|
100% |
90,000 |
|
|
|
|
|
|
|
|
|
|
|
|
|
|
|
90% |
80,000 |
|
|
|
|
|
|
|
|
|
|
|
|
|
|
|
80% |
70,000 |
|
|
|
|
|
|
|
|
|
|
|
|
|
|
|
70% |
60,000 |
|
|
|
|
|
|
|
|
|
|
|
|
|
|
|
60% |
50,000 |
|
|
|
|
|
|
|
|
|
|
|
|
|
|
|
50% |
40,000 |
|
|
|
|
|
|
|
|
|
|
|
|
|
|
|
40% |
30,000 |
|
|
|
|
|
|
|
|
|
|
|
|
|
|
|
30% |
20,000 |
|
|
|
|
|
|
|
|
|
|
|
|
|
|
|
20% |
10,000 |
|
|
|
|
|
|
|
|
|
|
|
|
|
|
|
10% |
0 |
Feb-17 |
Mar-17 |
Apr-17 |
May-17 |
Jun-17 |
Jul-17 |
Aug-17 Sep-17 Oct-17 |
Nov-17 |
Dec-17 |
Jan-18 Feb-18 Mar-18 Apr-18 |
May-18 |
Jun-18 |
Jul-18 |
Aug-18 |
Sep-18 |
0% |
-10,000 |
-10% |
|||||||||||||||
Jan17- |
|
|||||||||||||||
|
|
|
|
|
|
|
Net exports |
|
|
y/y change |
|
|
|
|
|
|
Source: Company data, Goldman Sachs Global Investment Research, Bloomberg |
Source: China Petroleum and Chemical Industry Federation |
4 December 2018 |
17 |

vk.com/id446425943
Goldman Sachs
Credit Outlook
Energy: Jason Gilbert
Sector View: Neutral
The Energy sector has shown in 4Q18 that it is nothing if not dynamic. After touching 2018 highs of $76/bbl on 10/3, WTI crude fell 34% to YTD lows of $50/bbl on 11/23 and sits at $51/bbl currently. To investors, the recent reset in prices is eerily reminiscent of the 48% oil decline (to $47 from $91) in 4Q14, which was part of a nearly 2 year downturn in oil which saw average HY Energy yields trade north of 15% from prior range of 5-10%. HY Energy credit has widened 163bp since 10/3 to a current yield of 8.4%, underperforming broader HY, which currently yields 7.3%, by 110bp. The natural question from investors now is “are we on the verge of another Energy distressed cycle?” We continue to believe the answer is “no,” which underpins our Neutral sector coverage view. Nonetheless, we still expect near term volatility as crude prices search for a bottom and uncertainty around a global production slowdown remains an overhang. Our trade recommendations (SM Energy and WPX Energy) focus on low BB names that we view as (1) having solid assets and (2) see as potentially taking part in industry consolidation. On the latter point, we would note that we view consolidation as perhaps the most compelling theme for HY Energy investors in 2019.
What is different vs. the last selloff: better balance sheets, lower cost structures
In the discussion below we attempt to point out some of the key differences/similarities
vs. the prior oil downturn that began in 2H14.
Exhibit 44: Key Energy indicators vs. broader markets
|
Prior peak |
Recent |
Current |
Current vs. |
Current vs. |
|
peak (Oct |
prior peak |
recent peak |
||
|
(Jul 2014) |
||||
|
2018) |
|
(% / bps) |
(% / bps) |
|
|
|
|
|||
WTI Spot ($/bbl) |
$104.59 |
$76.41 |
$50.93 |
(51%) |
(33%) |
WTI 12 Month Strip ($/bbl) |
$95.47 |
$73.84 |
$51.89 |
(46%) |
(30%) |
Henry Hub Gas ($/MMBtu) |
$3.85 |
$3.23 |
$4.61 |
20% |
43% |
S&P 500 Index |
1,973.6 |
2,925.5 |
2,760.2 |
40% |
(6%) |
XLE - Energy sector ETF |
99.1 |
77.5 |
66.1 |
(33%) |
(15%) |
OSX - Oil Services Index |
304.9 |
153.5 |
104.7 |
(66%) |
(32%) |
XOP - E&P sector ETF |
78.5 |
44.6 |
32.8 |
(58%) |
(26%) |
HY Energy Yield |
5.4% |
6.7% |
8.4% |
300 |
168 |
HY Yield |
5.4% |
6.3% |
7.2% |
181 |
98 |
10yr Treasury yield |
2.6% |
3.2% |
3.0% |
45 |
(19) |
|
|
|
|
|
|
|
Prior peak |
|
Current |
Change |
|
|
(Jul 2014) |
|
(% / bps) |
|
|
|
|
|
|
||
OECD crude + products inventories (mn bbls) |
2,666 |
|
2,875 |
8% |
|
OECD crude + products inventories (days of demand) |
58 |
|
60 |
3% |
|
Total OPEC production (mn b/d) |
30.5 |
|
32.6 |
7% |
|
1yr forward World Real GDP growth (%) |
3.6% |
|
3.5% |
(10) |
|
Source: Bloomberg, IEA
Key Difference #1: Leverage (as measured in Debt/BOE of production) is lower today than in 2014
As shown in the charts below, average leverage for our coverage is expected to be 4.0x as of 12/31/18 vs. leverage of 2.8x for the same group of companies as of 12/31/2014. However, from a more commodity price agnostic debt/BOE of production standpoint,
4 December 2018 |
18 |

vk.com/id446425943
Goldman Sachs
Credit Outlook
leverage has improved, falling to $69/boe vs. $104/boe in 3Q14. Furthermore, barrels of production today are both oilier (36% for our coverage vs. 35% in 2014) and supported by lower cost structures ($12.50/boe cash costs vs. $14.10/boe) than in 2H14. Thus, despite the optics of higher leverage on a trailing EBITDA basis, we conclude that balance sheets are in better shape today than headed into the last downturn.
Exhibit 45: Evolution of Total debt / EBITDA and Total debt / BOE of production for our coverage
6.5x |
|
|
|
|
|
$110.0 |
6.0x |
|
|
|
|
|
$100.0 |
|
|
|
|
|
|
|
5.5x |
|
|
|
|
|
$90.0 |
5.0x |
|
|
|
|
|
|
|
|
|
|
|
|
|
4.5x |
|
|
|
|
|
$80.0 |
4.0x |
|
|
|
|
|
$70.0 |
3.5x |
|
|
|
|
|
$60.0 |
3.0x |
|
|
|
|
|
|
|
|
|
|
|
|
|
2.5x |
|
|
|
|
|
$50.0 |
|
|
|
|
|
|
|
2.0x |
|
|
|
|
|
$40.0 |
2014 |
2015 |
2016 |
2017 |
2018E |
2019E |
2020E |
Total debt / EBITDA |
|
Total debt / BOE of production |
|
Source: Company data, Goldman Sachs Global Investment Research
Key Difference #2: Breakeven prices have come down significantly
Based on 2017 year-end reserve reports and 2018E operating data we estimate $51 per barrel oil is required for our coverage to generate a 10% return on investment . In 2014 that number was $73/bbl. For 2019, we forecast our E&P coverage to generate $3.0bn in aggregate positive FOCF vs. Bloomberg consensus forecast of ($5.5bn) for the same group of companies in 2015 as of 4Q14. In short, we believe E&Ps are better equipped to deal with lower prices today than in the last downturn.
4 December 2018 |
19 |

vk.com/id446425943
Goldman Sachs
Credit Outlook
Exhibit 46: Oil price required for E&Ps to generate a 10% return
$80
$70
$60
$50
$40
$30
$20
$10
$0
2014 |
2015 |
2016 |
2017 |
 Oil price required for 10% return
Source: Company data, Goldman Sachs Global Investment Research
Key Difference #3: Absent a recession, we view the global crude and product inventory path as being more favorable than in 4Q14
Oil bears point to growing OECD crude and product inventories as cause for alarm. By way of reference, days forward demand cover is currently at 60 vs. ~58 in 4Q14. While today’s level is slightly higher, we would note that 55-60 days coverage is within the realm of what we consider to be “normal.” What is different today, however, is the expected path for inventory builds given that the market was far more oversupplied in 2014/15 than we believe it to be today. For example, OECD crude and product stocks increased by 462mm bbls from July 2014 before peaking in July 2016, representing an average oil oversupply of 632k b/d over a two year period. For 2019, we are currently expecting OECD stocks to draw at a rate of -140k b/d in 1H19 assuming a 1.3mm b/d OPEC cut on 12/6.
Key Difference #4: Valuations are already pricing in a negative outcome
We believe current HY Energy trading levels are discounting ~$49/bbl oil in perpetuity vs. the 24 month strip at $54/bbl. Our historical production margin based valuation framework suggests fair value for HY Energy at the strip at 120%, representing 41bp of potential upside.
4 December 2018 |
20 |
vk.com/id446425943
Goldman Sachs
Credit Outlook
Exhibit 47: We see 41bps of upside at current 12 month strip pricing
Spread ratio of HY Energy / HY Market ex-Energy at production bands since 1/3/2012
Energy Spread
HY Energy Spread as % of Broader HY Market Ex-
250%
HY Energy is currently 130% of the 200% market spread ex-energy with margin
at ~$10. This compares to the average of 120% at current 12 month strip pricing.
150%
100%
50%
0%
6-$ to 10-$ |
2-$ to 6-$ |
$2 to 2-$ |
$6 to $2 |
$10 to $6 |
$14 to $10 |
$18 to $14 |
$22 to $18 |
$26 to $22 |
$30 to $26 |
$34 to $30 |
$38 to $34 |
$42 to $38 |
$46 to $42 |
Production margin
Source: Company data, Goldman Sachs Global Investment Research
What could turn sentiment?
We see a number of fundamental catalysts that could improve our/broader investor sentiment. First, there is widespread debate of the potential for an output cut at the 12/6 OPEC meeting. In our view, a cut of >1mm b/d could dramatically improve the inventory outlook for 2019. Similarly, we believe cuts to the US rig count (beyond just a seasonal slowdown), which is +27 rigs since oil peaked on 10/3 and +150 YTD, could dampen US output growth expectations for 2019. Third, we believe oil price volatility through E&P budgeting season is likely to result in steeper y/y capex decreases than we had previously expected. Absent much concrete company guidance, we are currently modelling y/y E&P capex -4%, with risk to the downside.
4 December 2018 |
21 |

vk.com/id446425943
Goldman Sachs
Credit Outlook
Exhibit 48: GS vs. strip oil prices |
Exhibit 49: OECD inventories on a days of demand basis are below |
|
the 5yr average, but above July 2014 levels |
$/bbl
$80
$70 $60
$50
$40
$30
$20
$10
$0
2018E |
2019E |
2020E |
2018E |
2019E |
2020E |
|
WTI |
|
|
Brent |
|
|
|
GS |
Strip |
|
|
|
68.0 |
|
|
66.0 |
|
|
64.0 |
|
|
62.0 |
|
Days |
60.0 |
|
58.0 |
|
|
|
56.0 |
3Q14: 58.8 days |
|
54.0 |
|
|
3Q18: 59.8 days |
|
|
52.0 |
|
|
|
|
|
50.0 |
|
OECD inventory (days of demand)
OECD inventory (days of demand) - 5yr avg.
Source: Goldman Sachs Global Investment Research, Bloomberg |
Source: IEA |
Exhibit 50: Comparison of yields for HY market, Energy and E&P
|
12.0 |
110 |
|
|
11.0 |
100 |
|
|
10.0 |
90 |
|
|
80 |
||
(%) |
9.0 |
||
70 |
|||
8.0 |
|||
Yield |
|||
60 |
|||
7.0 |
|||
50 |
|||
|
6.0 |
||
|
40 |
||
|
5.0 |
||
|
30 |
||
|
4.0 |
20 |
E&P Index |
|
HY Energy Index |
|
||
HY Market Index |
|
WTI Oil ($/bbl) |
|
Exhibit 51: OPEC production by country
OPEC production (mn b/d |
2014 |
3Q18 |
% chg |
Saudi Arabia |
9.53 |
10.43 |
9% |
Iran |
2.81 |
3.62 |
29% |
Iraq |
3.33 |
4.62 |
39% |
UAE |
2.76 |
3.00 |
9% |
Kuwait |
2.61 |
2.80 |
7% |
Neutral Zone |
0.38 |
0.00 |
(100%) |
Qatar |
0.71 |
0.61 |
(14%) |
Angola |
1.66 |
1.48 |
(11%) |
Nigeria |
1.90 |
1.63 |
(14%) |
Libya |
0.46 |
0.90 |
96% |
Algeria |
1.12 |
1.06 |
(5%) |
Congo |
-- |
0.32 |
-- |
Gabon |
-- |
0.19 |
-- |
Equatorial Guinea |
-- |
0.12 |
-- |
Ecuador |
0.55 |
0.53 |
(4%) |
Venezuela |
2.46 |
1.25 |
(49%) |
Total Crude oil |
30.28 |
32.56 |
8% |
Total NGLs |
6.38 |
6.98 |
9% |
Total OPEC |
36.66 |
39.54 |
8% |
Source: The Yield Book Inc.; FTSE Index |
Source: IEA |
4 December 2018 |
22 |
vk.com/id446425943
Goldman Sachs
Best ideas
Credit Outlook
Trade idea 1: Buy the SM 6.25%s of 2025 at $92/7.2% to move into a mid quality Midland basin name that should benefit from Permian consolidation tailwinds. While we view the SM complex as more defensive than not, the SM 2025s are our greater return pick of the two, given an added 60bps of yield and an added turn of LTM leverage. However, like WPX, the name is migrating towards Permian Pure play status, and falls into the same bucket of mid sized Permian E&Ps that may be beneficiaries of industry consolidation.
We believe that SM’s Midland basin acreage is underappreciated by investors, and recent well results in the company’s Howard County Rockstar area have continued steadily outperform type curves, helping SM grow production by 18% (and reduce its gas cut by 3% and unit cash costs per BOE by 14%) YTD, despite closing on ~$750mm of non-core asset sales. On our GS $65/$55 oil deck, we see SM organically delevering from 3.1x today to 1.9x at YE 2020. We also estimate that SM will pivot from burning $560mm of cash in 2018 to generating $46mm of cash in 2019; an important marker given that the turn to cash flow neutrality in a volatile commodity price environment is increasingly rewarded by credit investors.
Importantly, we calculate SM as breaking even at $46 WTI, which gives the company staying power in a lower for longer commodity price environment, as does $~1.2bn of liquidity and <$200mm of maturities inside of 2021.
Compared to high quality Permian Pure play PARSLY (2025s 6.2%), an investor picks up 70bps of yield in a bond that has asset upside potential and a deleveraging catalyst (the sale of its Eagle Ford Asset), that pure play peers do not.
Exhibit 52: The SM 2025s are $4 cheaper than the last time WTI traded at $51
$110 |
$80 |
$105 |
$75 |
|
|
|
$70 |
$100 |
$65 |
|
|
$95 |
$60 |
$90 |
$55 |
|
|
|
$50 |
$85 |
$45 |
|
|
$80 |
$40 |
SM 5.675$ of 2025 |
|
WTI Crude |
|
Source: Bloomberg
4 December 2018 |
23 |

vk.com/id446425943
Goldman Sachs
Credit Outlook
Exhibit 53: The 2019 GS oil call is $65; on 1/18, WTI traded at $64 and the SM 2025s traded at $101.3
|
6/23/2017 |
10/13/2017 |
1/12/2018 |
11/27/2018 |
SM 2025s $ |
$87.00 |
$94.50 |
$101.25 |
$92.00 |
SM 2025s Yield |
6.67% |
6.38% |
5.25% |
6.98% |
WTI |
$43.01 |
$51.45 |
64.3 |
51.5 |
GS Next Cal. Year Oil Deck |
$58.00 |
$58.00 |
$65.00 |
$65.00 |
Spot Oil Vs. GS Next Year Deck |
-$14.99 |
-$6.55 |
-$0.70 |
-$13.50 |
Source: Bloomberg, Goldman Sachs Global Investment Research, The Yield Book Inc.; FTSE Index
The SM complex has traded down $6 YTD to $92 on the back of $9 lower spot WTI pricing; however, we note that in 6/17, with leverage at 4.0x, WTI trading at $43, and the GS call for oil at $58, the SM 2025s traded at $87, while in 10/17 with WTI at $51, the
GS call at $58, and leverage at 4.3x, the SM 2025s traded at $95.Today, the company is 3.1x levered, and with oil at $51 and the GS call at $64, we see upside through the $95 level as more likely than downside to the $87 level. Additionally, we note that in 1/18, with spot oil at $64 and leverage at 4.5x, the SM 2025’s traded above par. Given (1) solid execution, (2) declining leverage, (3) upside catalysts, (4) M&A tailwinds and (5) the GS $64 oil call, we view a return to par as within possible in the next 12 months.
Key Risks: The key risk to our view remains crude oil pricing, where we see lack of OPEC cuts as the primary negative catalyst.
4 December 2018 |
24 |

vk.com/id446425943
Goldman Sachs
Credit Outlook
Trade idea 2: Buy WPX (B1/BB-) 5.25% of 2024s at $95.9/6.1% as a defensive name
with organic upside, M&A optionality
We view Permian transition story WPX (OP) as a name offering the right combination of defensive characteristics ($46/bbl average oil breakeven) and upside (+20-39bp of upside) as the company continues its migration towards becoming Permian pure play. By comparison, similarly rated Permian E&P Parsley Energy (NC) 5.38% of 25 trade at 6% vs. 6.2% for the WPX 24s. Furthermore, we see “mid-sized” names such as WPX as potential beneficiaries of industry consolidation, which we expect to be a key theme in 2019.
WPX has no debt maturities until 2022 ($530mn), total liquidity of $1.3bn ($36mn in cash + $1.25bn of RBL availability) and is 37% hedged on 2019 oil production at $57/bbl. We see leverage (total debt / EBITDA) improving to 1.4x/1.2x in 2019/2020 from 2.0x in 2018 on our base case WTI oil price deck of $65/$55. We expect WPX to generate close to breakeven FOCF in 2019 and +$300mn of FOCF in 2020 vs. -$400mn in 2018.
Exhibit 54: Comparison of yields for WPX, SM and PARSLY vs. WTI oil
|
7.5 |
80.0 |
|
|
|
7.0 |
75.0 |
|
|
|
|
|
||
|
6.5 |
70.0 |
WTI oil ($/bbl) |
|
Yield (%) |
|
|||
6.0 |
65.0 |
|||
60.0 |
||||
|
||||
5.5 |
55.0 |
|||
|
|
|
||
|
5.0 |
50.0 |
|
|
|
|
|
||
|
4.5 |
45.0 |
|
|
|
WPX 5.25% 2024s |
PARSLY 5.25% 2025s |
|
|
|
SM 5.625% of 2025s |
WTI Oil ($/bbl) |
|
Source: Bloomberg
We are OP rated. The WPX 6% of 2024s ($650mm, the largest issue in the structure) are currently trading at $95.9 /6.1%, down from recent highs of $100.7 / 5.1% on Oct 3.
Risks to our view: Downside risks include oil price weakness, worse than expected
well results.
4 December 2018 |
25 |