

DB European Pharmaceuticals 2019 Outlook_watermark
.pdf
|
European Pharmaceuticals |
|
|
|
|
|
vk.com/id446425943 |
|
|
|
|
|
Deutsche Bank |
|
|
|
|
|
Research |
|
|
|
|
|
Europe |
|
Industry |
|
Date |
|
|
|
|||
|
|
|
European |
|
10 December 2018 |
|
|
|
|
|
|
|
Pharmaceuticals |
|
Pharmaceuticals |
|
Industry Update |
|
Pharmaceuticals |
|
|
||
|
|
|
|
|
|
|
|
|
|
|
|
2019 outlook: Innovation outweighing erosion
Improving earnings trajectory, downgrades stabilised
EU pharma performance has been hampered in recent years by US pricing concerns and consensus EPS downgrades as an expected acceleration in EPS growth was delayed. However, downgrade momentum seems to have stabilised and '19 o ers mid-to-high single digit EPS growth at a time of wider macro uncertainty. Our strategists are tactically more cautious as they see a receding of global growth fears in the short term and see risks from rising US bond yields and a weakening dollar in the medium term. However, fundamentals look solid in '19 and valuations are underpinned by growth prospects.
Innovation outweighing expiries and pricing: improving growth in '19
We are experiencing an innovation boom with '18 a record year for new drug approvals. We see the rapid pace of innovation as carrying both opportunities (new drugs) and challenges (rapid obsolescence) for large cap Pharma. This may trigger further expensive M&A in the long-term. However, for now it is resulting in solid mid-term growth (6% EPS growth in '19E and 7% EPS CAGR '18-23E) driven by new drug roll-outs with fewer o sets from patent expiries. We see US pricing headwinds as manageable and expect more bark than bite from the currently split US congress in '19.
Less hidden value but 16x PER reasonable: Top large cap picks = AZN & Novo Given a broader market de-rating, EU Pharma is trading at the upper end of its
relative PE range. However, multiples do not look stretched and are supported by our expectations for improving growth. However, our DCFs indicate modest upside in aggregate (~10%), suggesting stock picking and a preference for strong growth is required. Our top picks reflect this with AZN retained as a top pick as we expect margin leverage to materialise strongly in '19. Novo Nordisk enters our top picks list as we see the shares as undervaluing our expectation for a return to long-term growth driven by a shift to its higher-margin GLP-1 franchise.
More Bullish on mid-caps; Upgrading UCB, Sobi, MorphoSys & Genmab to Buy We also become constructive on mid-caps, and upgrade four stocks to Buy
ratings: UCB given our increased confidence that its pipeline can o set expected medium term pressures and return the company to growth; Sobi as we believe the transformational nature of recent acquisitions is yet to be fully reflected; Genmab as we believe the current price is underpinned by expected Darzalex cash flows and we see upside as the company delivers on its growing clinical
Tim Race, CFA Research Analyst +44-20-754-76522
Richard Parkes, Ph.D. Research Analyst +44-20-754-50470
Jordan McConnell Research Analyst +44-20-754-74562
Rajan Sharma Research Analyst +44-20-754-53663
Gunnar Romer Research Analyst +49-69-910-31917
Falko Friedrichs Research Analyst +49-69-910-36270
Deutsche Bank AG/London |
Distributed on: 10/12/2018 04:03:40 GMT |
Deutsche Bank does and seeks to do business with companies covered in its research reports. Thus, investors should be aware that the firm may have a conflict of interest that could a ect the objectivity of this report. Investors should consider this report as only a single factor in making their investment decision. DISCLOSURES AND ANALYST CERTIFICATIONS ARE LOCATED IN APPENDIX 1. MCI (P) 091/04/2018.
7T2se3r0Ot6kwoPa

vk.com/id446425943
10 December 2018 Pharmaceuticals European Pharmaceuticals
pipeline; and MorphoSys as we believe the pipeline can continue to produce positive surprises.
Top picks |
|
GlaxoSmithKline (GSK.L),GBP1,437.40 |
Hold |
Novartis (NOVN.S),CHF87.00 |
Hold |
Vifor Pharma (VIFN.S),CHF123.75 |
Hold |
AstraZeneca (AZN.L),GBP5,927.00 |
Buy |
Bayer AG (BAYGn.DE),EUR63.43 |
Buy |
Evotec (EVTG.DE),EUR17.85 |
Buy |
Genmab (GEN.CO),DKK997.80 |
Buy |
Grifols (GRLS.MC),EUR24.40 |
Hold |
Lundbeck (LUN.CO),DKK264.80 |
Sell |
Merck (MRCG.DE),EUR95.90 |
Hold |
Novo Nordisk (NOVOb.CO),DKK300.25 |
Buy |
Roche (ROG.S),CHF250.70 |
Hold |
Sanofi (SASY.PA),EUR76.55 |
Buy |
Swedish Orphan Bio |
Buy |
(SOBIV.ST),SEK186.85 |
|
UCB (UCB.BR),EUR75.40 |
Buy |
Morphosys (MORG.DE),EUR98.25 |
Buy |
Polyphor (POLN.S),CHF20.80 |
Buy |
Idorsia (IDIA.S),CHF18.55 |
Buy |
Source: Deutsche Bank |
|
Page 2 |
Deutsche Bank AG/London |

vk.com/id446425943 |
|
|
|
|
|
|
10 December 2018 |
|
|
|
|
|
|
Pharmaceuticals |
|
|
|
|
|
|
European Pharmaceuticals |
|
|
|
|
|
|
|
|
|
|
|
|
|
|
Companies featured |
|
|
|
|
|
|
GlaxoSmithKline (GSK.L),GBP1,437.40 |
Hold |
||||
|
|
2017A |
|
2018E |
2019E |
|
|
DB EPS (GBP) |
110.58 |
114.35 110.61 |
|||
|
Novartis (NOVN.S),CHF87.00 |
|
|
Hold |
||
|
|
2017A |
|
2018E |
2019E |
|
|
DB EPS (USD) |
4.80 |
|
5.14 |
5.10 |
|
|
Vifor Pharma (VIFN.S),CHF123.75 |
Hold |
||||
|
|
2017A |
|
2018E |
2019E |
|
|
DB EPS (CHF) |
2.12 |
|
3.82 |
4.46 |
|
|
AstraZeneca (AZN.L),GBP5,927.00 |
Buy |
||||
|
|
2017A |
|
2018E |
2019E |
|
|
DB EPS (USD) |
4.28 |
|
3.40 |
3.79 |
|
|
Bayer AG (BAYGn.DE),EUR63.43 |
|
Buy |
|||
|
|
2017A |
|
2018E |
2019E |
|
|
DB EPS (EUR) |
6.74 |
|
5.80 |
6.92 |
|
|
Evotec (EVTG.DE),EUR17.85 |
|
|
Buy |
||
|
|
2017A |
|
2018E |
2019E |
|
|
DB EPS (EUR) |
0.17 |
|
0.39 |
0.36 |
|
|
P/E (x) |
74.9 |
|
45.3 |
50.2 |
|
|
EV/EBITA (x) |
51.3 |
|
39.8 |
38.1 |
|
|
Genmab (GEN.CO),DKK997.80 |
|
|
Buy |
||
|
|
2017A |
|
2018E |
2019E |
|
|
DB EPS (DKK) |
17.77 |
|
19.75 |
24.45 |
|
|
P/E (x) |
75.5 |
|
50.5 |
40.8 |
|
|
EV/EBITA (x) |
56.7 |
|
40.9 |
29.9 |
|
|
Grifols (GRLS.MC),EUR24.40 |
|
|
Hold |
||
|
|
2017A |
|
2018E |
2019E |
|
|
DB EPS (EUR) |
0.96 |
|
1.03 |
1.18 |
|
|
Lundbeck (LUN.CO),DKK264.80 |
|
|
Sell |
||
|
|
2017A |
|
2018E |
2019E |
|
|
DB EPS (DKK) |
16.48 |
|
23.05 |
19.32 |
|
|
Merck (MRCG.DE),EUR95.90 |
|
|
Hold |
||
|
|
2017A |
|
2018E |
2019E |
|
|
DB EPS (EUR) |
5.93 |
|
5.17 |
5.64 |
|
|
Novo Nordisk (NOVOb.CO),DKK300.25 |
Buy |
||||
|
|
2017A |
|
2018E |
2019E |
|
|
DB EPS (DKK) |
15.39 |
|
15.93 |
16.56 |
|
|
Roche (ROG.S),CHF250.70 |
|
|
Hold |
||
|
|
2017A |
|
2018E |
2019E |
|
|
DB EPS (CHF) |
15.29 |
|
18.00 |
18.43 |
|
|
Sanofi (SASY.PA),EUR76.55 |
|
|
Buy |
||
|
|
2017A |
|
2018E |
2019E |
|
|
DB EPS (EUR) |
5.53 |
|
5.50 |
5.66 |
|
|
P/E (x) |
14.8 |
|
13.9 |
13.5 |
|
|
EV/EBITA (x) |
17.6 |
|
16.8 |
16.4 |
|
|
Swedish Orphan Bio |
|
|
|
Buy |
|
|
(SOBIV.ST),SEK186.85 |
|
|
|
|
|
|
|
2017A |
|
2018E |
2019E |
|
|
DB EPS (SEK) |
5.51 |
|
10.16 |
13.42 |
|
|
UCB (UCB.BR),EUR75.40 |
|
|
|
Buy |
|
|
|
2017A |
|
2018E |
2019E |
|
|
DB EPS (EUR) |
4.82 |
|
4.70 |
4.65 |
|
|
Morphosys (MORG.DE),EUR98.25 |
Buy |
||||
|
|
2017A |
|
2018E |
2019E |
|
|
DB EPS (EUR) |
-2.41 |
|
-1.99 |
-3.37 |
|
Deutsche Bank AG/London |
P/E (x) |
– |
|
– |
|
– |
EV/EBITA (x) |
– |
|
Page– |
3– |
||
|
Polyphor (POLN.S),CHF20.80 |
|
|
Buy |
||
|
|
2017A |
|
2018E |
2019E |
|
DB EPS (CHF) |
-5.84 -4.18 -5.03 |
vk.com/id446425943
4 Page |
Improving earnings trajectory, downgrades stabilised |
Fundamentals look solid but macro an uncertainty
■Bottom-up: moderately positive on fundamentals. EU pharma performance has been hampered in recent years by US pricing concerns and consensus EPS downgrades as an expected acceleration in EPS growth has been slow to materialise. However, downgrade momentum seems to have stabilised and 2019 o ers mid-to- high single digit EPS growth at a time of wider macro uncertainty. Industrywide, we are seeing an innovation boom which carries both opportunities (new drugs) and challenges (rapid obsolescence) for large cap Pharma. This may trigger further expensive M&A in the longterm. However, for now it is resulting in solid short term growth (6% EPS growth in 2019E and 7% EPS CAGR 2018-23E) driven by new drug rollouts with fewer o sets from patent expiries.
■Less hidden value but valuations underpinned. Given a broader market de-rating EU Pharma is trading at the upper end of its relative PE range over the last ten years. However, multiples do not look stretched and we believe are supported by our EPS growth expectations. However, with DCFs suggesting only ~10% upside in aggregate we see less hidden value and fewer obvious 'table pounding' Buy ideas. However, we are more positive on mid-caps where valuations are more attractive and pipelines advancing.
■Our strategists are underweight Pharma suggesting near-term downside risk. They expect a rebound in PMI momentum together with rising US inflation to drive up US bond yields. Combined with their expectations for a weaker US$ this points to near-term downside risk. On a 12 month view they believe European EPS growth will weaken due to headwinds from Euro strength and a softening in PMIs. This would be more constructive for defensives. However, Euro strength and upward pressure on US bond yields represents the most significant risk to our more positive fundamental view.
|
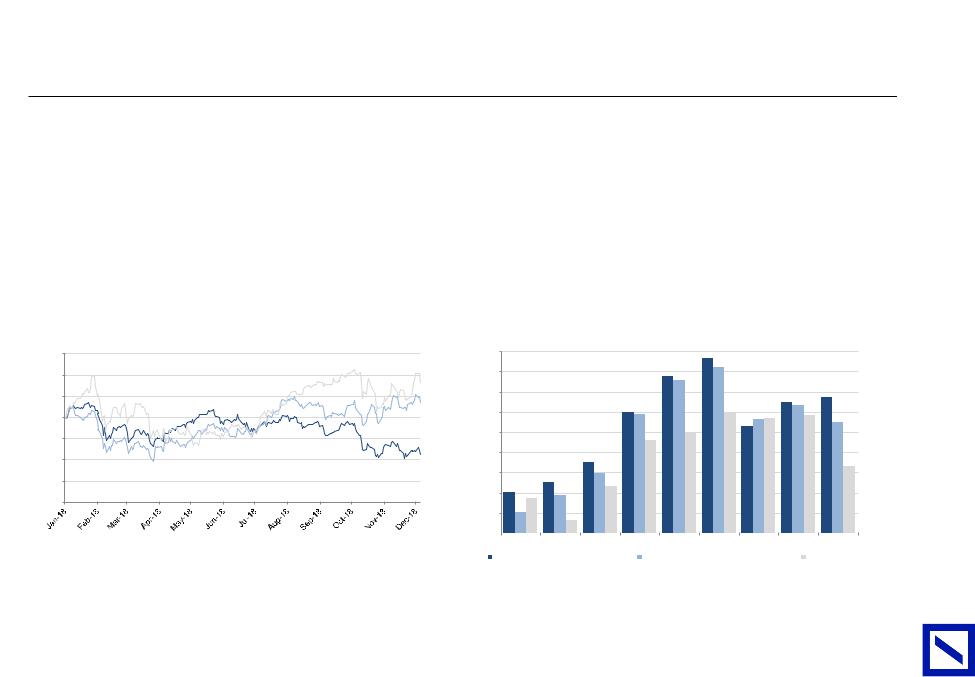
Figure 1 : DB coverage YTD share price performance (%) |
|
|
|
|
|
|
Figure 2 : DB EU Pharma & Biotech recommendations |
|
|
|||||||||||||||||
|
|
|
|
|
|
|
|
|
|
|
|
|
|
|
|
|
|
|
|
|
|
|
Mkt Cap |
|
|
|
|
|
80% |
|
|
|
|
|
|
|
|
|
|
|
|
|
|
|
|
|
|
|
|
|
($bn) |
06-Dec-18 |
Target price |
Div yield % |
1 yr total ret % |
|
|
|
|
|
|
|
|
|
|
|
|
|
|
|
|
|
|
|
|
|
|
||||||
|
|
|
|
|
|
|
|
|
|
|
|
|
|
|
|
|
|
|
|
|
|
|
|
|
|
|
|
|
60% |
|
|
|
|
|
|
|
|
|
|
|
|
|
|
|
|
|
|
|
AstraZeneca |
Buy |
97.9 |
5,955.0p |
6,900.0p |
3.7% |
19.5% |
|
|
|
|
|
|
|
|
|
|
|
|
|
|
|
|
|
|
|
|
Bayer AG |
Buy |
70.2 |
EUR 62.4 |
EUR 115.0 |
4.8% |
89.2% |
|
|
|
|
|
|
|
|
|
|
|
|
|
|
|
|
|
|
|
|
|
|
|||||||
|
40% |
|
|
|
|
|
|
|
|
|
|
|
|
|
|
|
|
|
|
|
GlaxoSmithKline |
Hold |
91.7 |
1,418.0p |
1,520.0p |
4.4% |
11.6% |
|
|
|
|
|
|
|
|
|
|
|
|
|
|
|
|
|
|
|
|
||||||||
|
|
|
|
|
|
|
|
|
|
|
|
|
|
|
|
|
|
|
|
|
Novartis |
Hold |
210.8 |
CHF 87.4 |
CHF 96.0 |
3.4% |
13.2% |
|
20% |
|
|
|
|
|
|
|
|
|
|
|
|
|
|
|
|
|
|
|
Novo Nordisk |
Buy |
111.1 |
DKK 296.0 |
DKK 355.0 |
2.9% |
22.8% |
|
|
|
|
|
|
|
|
|
|
|
|
|
|
|
|
|
|
|
|
||||||||
|
|
|
|
|
|
|
|
|
|
|
|
|
|
|
|
|
|
|
|
|
|||||||
|
0% |
|
|
|
|
|
|
|
|
|
|
|
|
|
|
|
|
|
|
|
Roche |
Hold |
218.2 |
CHF 247.3 |
CHF 255.0 |
4.0% |
7.1% |
|
|
|
|
|
|
|
|
|
|
|
|
|
|
|
|
|
|
|
|
Sanofi |
Buy |
110.9 |
EUR 75.6 |
EUR 93.0 |
4.1% |
27.1% |
|
|
|
|
|
|
|
|
|
|
|
|
|
|
|
|
|
|
|
|
|
||||||||
|
|
|
|
|
|
|
|
|
|
|
|
|
|
|
|
|
|
|
|
|
|||||||
|
-20% |
|
|
|
|
|
|
|
|
|
|
|
|
|
|
|
|
|
|
|
Evotec |
Buy |
3.1 |
EUR 18.4 |
EUR 22.0 |
0.0% |
19.6% |
|
|
|
|
|
|
|
|
|
|
|
|
|
|
|
|
|
|
|
|
||||||||
|
|
|
|
|
|
|
|
|
|
|
|
|
|
|
|
|
|
|
|
|
Genmab |
Buy |
9.3 |
DKK 1,005.5 |
DKK 1,250.0 |
0.0% |
24.3% |
|
-40% |
|
|
|
|
|
|
|
|
|
|
|
|
|
|
|
|
|
|
|
Grifols A shares |
Hold |
19.5 |
EUR 24.2 |
EUR 25.0 |
1.5% |
4.7% |
|
|
|
|
|
|
|
|
|
|
|
|
|
|
|
|
|
|
|
|
||||||||
|
|
|
|
|
|
|
|
|
|
|
|
|
|
|
|
|
|
|
|
|
|||||||
|
-60% |
|
|
|
|
|
|
|
|
|
|
|
|
|
|
|
|
|
|
|
Idorsia |
Buy |
2.3 |
CHF 18.5 |
CHF 29.0 |
0.0% |
56.5% |
Deutsche |
|
GYBAYN |
SWIDIA |
DCLUN |
DCNOVOB |
SWVIFN |
DCGEN |
GRF.MC |
SWROG |
GYMRK |
FPSAN |
SWNOVN |
LNGSK |
BBUCB |
LNAZN |
GYMOR |
GYEVT |
SSSOBI |
Polyphor |
Buy |
0.2 |
CHF 21.0 |
CHF 78.0 |
0.0% |
272.3% |
||
|
|
|
|
|
|
|
|
|
|
|
|
|
|
|
|
|
|
|
|
|
Lundbeck |
Sell |
8.0 |
DKK 262.1 |
DKK 225.0 |
4.0% |
-10.1% |
|
|
|
|
|
|
|
|
|
|
|
|
|
|
|
|
|
|
|
|
|
Merck KGaA |
Hold |
48.3 |
EUR 94.8 |
EUR 93.0 |
1.4% |
-0.5% |
Bank |
|
|
|
|
|
|
|
|
|
|
|
|
|
|
|
|
|
|
|
|
Morphosys |
Buy |
3.3 |
EUR 95.4 |
EUR 130.0 |
0.0% |
36.3% |
|
|
|
|
|
|
|
|
|
|
|
|
|
|
|
|
|
|
|
|
UCB |
Buy |
16.1 |
EUR 74.0 |
EUR 95.0 |
1.8% |
30.1% |
|
AG/London |
|
|
|
|
|
|
|
|
|
|
|
|
|
|
|
|
|
|
|
|
SOBI |
Buy |
5.8 |
SEK 189.6 |
SEK 245.0 |
0.0% |
29.2% |
|
|
|
|
|
|
|
|
|
|
|
|
|
|
|
|
|
|
|
|
Vifor |
Hold |
8.9 |
EUR 120.8 |
EUR 135.0 |
1.7% |
13.5% |
|
|
|
|
|
|
|
|
|
|
|
|
|
|
|
|
|
|
|
|
|
|
|||||||
|
Source: Deutsche Bank |
|
|
|
|
|
|
|
|
|
|
|
|
|
|
|
|
|
Source: Deutsche Bank |
|
|
|
|
|
|
||
|
|
|
|
|
|
|
|
|
|
|
|
|
|
|
|
|
|
|
|
|
|
|
|
||||
|
|
|
|
|
|
|
|
|
|
|
|
|
|
|
|
|
|
|
|
|
|
|
|
|
|
|
|
2018 December 10 Pharmaceuticals Pharmaceuticals European

vk.com/id446425943
Bank Deutsche |
Top picks: AstraZeneca, Novo Nordisk and UCB |
|
|
Top large-cap picks o er opportunity for best in class growth and returning investor confidence |
|
AG/London |
the GLP-1 driven earnings turn. We also become more constructive on mid-cap pharma, which has been pressured in the past year by high valuations and |
|
Following outperformance of the market in 2018, EU pharma valuations do not suggest as obvious mis-pricing as in the past. However, although not 'table |
|
pounding', we see outperformance from AZN as confidence in its sector beating growth continues; Novo Nordisk as investors start looking ahead to anticipate |
|
pipeline uncertainty. Now, we see opportunity and highlight UCB as a top pick (but also upgrade SOBI, Genmab and MorphoSys). |
AstraZeneca (Buy): Turned and now the fastest growing LC pharma
■The now de-risked new drug portfolio should drive high single-digit sales growth, which when paired with a pre-loaded marketing costs, means we should witness a material improvement in margin and earnings in 2019 and an EPS CAGR of 17% between 2018 and 2022E. Delivery on earnings leverage is likely to become the equity story. Admittedly, there are fewer overtly controversial catalysts for the share and value is less hidden. However, we still expect pipeline newsflow in 2019 (roxadustat in anaemia, and new indications for Imfinzi, Lynparza, Calquence) to continue to help drive the shares.
Novo Nordisk (Buy): Anticipating the turn
■Novo underperformed in 2018 reflecting perhaps too open, and sometimes confusing, communication, emerging competitors and only low-to-mid single-digit near-term earnings growth. 2019E still o ers only mid single-digit growth, but as Ozempic continues to take share and as we pass oral semaglutide's filing and close on approval, we expect investors to increasingly warm to the prospect of a return to more meaningful, potential double digit, earnings growth. At 16x 2020E PE, Novo trades at a 15% premium to peers, but only a 4% premium if we normalise sector earnings for the more egregious "core accounting" items, that only Novo does not engage in.
UCB (Upgrade to Buy): Increased confidence in pipeline
■We are upgrading our recommendation on UCB to Buy given our increased confidence that its pipeline can ultimately o set expected medium term pressures and return the company to growth. This confidence reflects our optimism over the blockbuster potential of FcRn inhibitor rozanolixizumab. This should become clearer to investors through 2019. We believe the drug's potential can return the company to growth post its trough in 2022/23 as patents on Vimpat expire, with ~double digit EPS growth possible in best cases. We believe the shares 16x PER reflects only modest value for the pipeline and undervalues the company's ability to leverage its balance sheet to drive growth.
5 Page
2018 December 10 Pharmaceuticals Pharmaceuticals European
vk.com/id446425943
6 Page |
Pharma has outperformed markets despite rising |
|
bond yields |
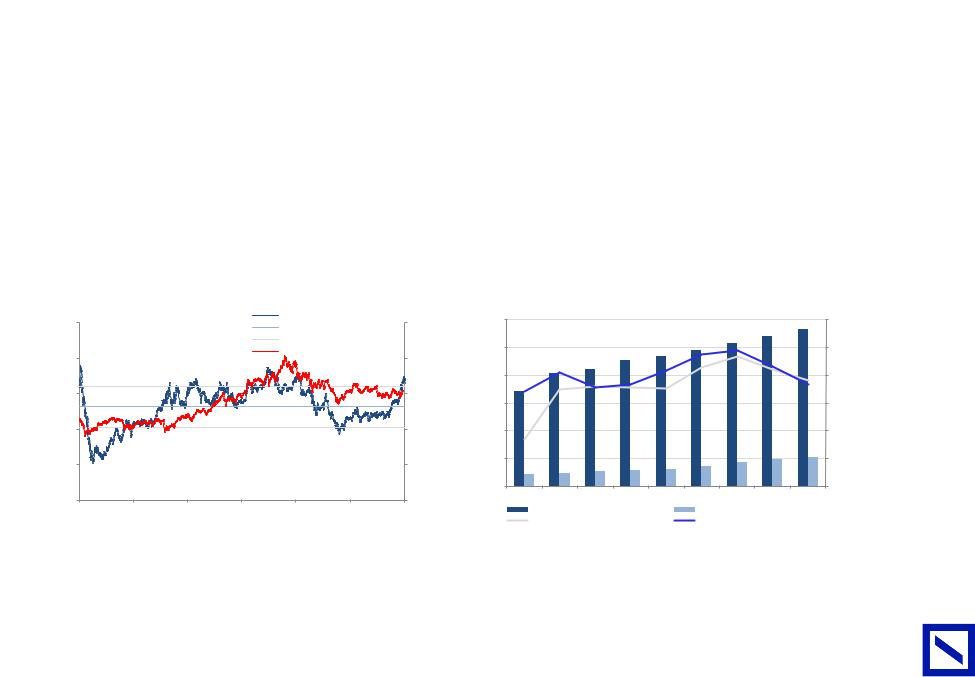
MSCI EU Pharma up +4% in 2018 vs. MSCI Europe -9%
■EU Pharma absolute performance has been uninspiring in 2018 with modest downgrades to consensus EPS forecasts providing a continuing headwind to share prices.
■Despite this, the sector's defensive characteristics have seen it outperform broader markets impacted by fears over slowing global growth. This has led to an unusual situation of Pharma outperforming even with rising bond yields, usually a challenge for a defensive high yielding sector.
■The sector (ex-Bayer) now trades at a 12 month fwd PE of ~16x, broadly in-line with the end of 2017 but having re-rated from ~14.5x at end 2016 when fears over US pricing dominated investor discussions on the sector's prospects.
■EU Pharma has significantly underperformed US Pharma in 2018. We believe this reflects di ering earnings momentum over the period, with US Pharma buoyed by EPS upgrades (helped by US tax reform) vs overall downgrades within EU Pharma.
Figure 3: MSCI EU vs MSCI EU / US Pharma Biotech & Life Science |
|
Figure 4: Large cap European Pharma 1-year forward PE vs sector & |
|
|
market |
|
|
|
rebased |
115 |
|
18 |
110 |
|
17 |
|
|
|
||
|
|
|
|
currency,local |
105 |
|
16 |
PEfwd |
|
||
100 |
15 |
||
|
|
|
|
|
95 |
|
14 |
price, |
|
|
|
|
1yr |
13 |
|
|
|
|
|
|
90 |
|
|
Index |
|
|
12 |
85 |
|
|
|
|
|
|
|
|
|
|
11 |
|
80 |
|
|
|
|
|
10 |
|
|
|
MSCI Europe |
|
MSCI Europe Pharma/Biotech/Life Science |
9 |
|
|
|
|
|
|
AG/LondonBankDeutsche |
|
|
|
End-2010 End-2011 End 2012 |
End-2013 End-2014 End-2015 End-2016 |
End-2017 |
Now* |
|
||||
|
|
|
|
|
|
|||||||
|
|
|
|
|
|
|||||||
|
|
MSCI USA Pharma/Biotech/Life Science |
|
|
|
Large Cap European Pharma 1yr fwd PE |
MSCI Europe Pharma, Biotech & Life Science |
MSCI Europe |
|
|||
|
|
|
|
|
|
|
||||||
|
|
|
|
|
|
|
|
|||||
|
Source: Deutsche Bank, Bloomberg Finance LP |
|
|
Source: Bloomberg. *Large caps exclude Bayer & Shire in 2018. |
|
|
|
|||||
|
|
|
|
|
|
|||||||
|
|
|
|
|
|
|
|
|
|
|
|
|
2018 December 10 Pharmaceuticals Pharmaceuticals European
vk.com/id446425943
Bank Deutsche |
Earnings momentum key to performance |
||||
|
|
|
|
||
Positive EPS momentum but still unspectacular |
|
|
|
||
AG/London |
|
to be driven by slowly improving confidence that our forecasts for a growth improvement are achievable (DBe '18-23 CAGR sales/EPS of 5% & 7%). |
|||
|
■ |
Earnings momentum remains key to large cap pharma performance. We expect an improvement in 2019 median EPS growth, following a modest |
|||
|
|
2018, as past biosimilar/generic pressures ease and new portfolios gain traction (Novartis, Sanofi, AstraZeneca). We expect the sector's performance |
|||
|
■ |
US pricing more benign than feared but there may be winners and losers. With the Republicans and Democrats holding majorities in the Senate and |
|||
|
|
House respectively, we believe debates over US drug pricing are likely to be more bark than bite through 2019. However, e orts to remove rebates |
|||
|
|
from the equation and incentives for uptake of biosimilars may be successful. Although eliminating rebates would ultimately be broadly neutral for |
|||
|
|
the sector, we see potential for "winners and losers" in this scenario (see later in this report here ). |
|||
|
■ |
Innovation to outweigh expiry, for now: Near-term ebbing of generic outflows (Roche aside) is set to be outweighed by new product growth in 2019. |
|||
|
|
This should allow the sector to perform better than previous years. Longer-term, innovation is a double edged sword for incumbent Pharma (see |
|||
|
|
later in this report here ). |
|
|
|
|
|
|
|
|
|
|
Figure 5: Pharma sector PE relative to market |
|
Figure 6: Large-Cap Pharma revenue & EBIT |
||
|
|
|
|
|
|
|
1.6x |
|
|
|
Rel. PE |
|
25 |
|
|
350 |
|
|
|
|
|
|
|
15% |
|
|
|
|
|
|
|
|
|
|
|
|
|
|
|
|
|
||||
|
|
|
|
10yr Ave |
|
|
|
|
|
|
|
|
|
|
|
|
|
||
|
|
|
|
|
|
|
|
|
|
|
|
|
|
|
|
|
|
|
|
fwd |
|
|
|
|
+/- 1 s.d. |
|
|
|
|
300 |
|
|
|
|
|
|
|
10% |
|
1.4x |
|
|
|
Sector Average 1 yr Fwd PE |
20 |
fwd1yraverageSectorPE |
|
|
|
|
|
|
|
|
|
||||
(x),markettorel.PESector1yr |
|
|
|
|
|
($bn) |
|
|
|
|
|
|
|
|
|
(%)growthYoY |
|||
|
|
|
|
|
|
|
250 |
|
|
|
|
|
|
|
5% |
||||
|
|
|
|
|
|
|
|
|
|
|
|
|
|
|
|
|
|
||
|
1.2x |
|
|
|
|
|
15 |
|
|
|
|
|
|
|
|
|
|
|
|
|
|
|
|
|
|
|
|
|
|
200 |
|
|
|
|
|
|
|
0% |
|
|
1.0x |
|
|
|
|
|
10 |
|
|
150 |
|
|
|
|
|
|
|
-5% |
|
|
0.8x |
|
|
|
|
|
5 |
|
|
100 |
|
|
|
|
|
|
|
-10% |
|
|
|
|
|
|
|
|
|
|
|
|
|
|
|
|
|
|
|
||
|
|
|
|
|
|
|
|
|
|
50 |
|
|
|
|
|
|
|
-15% |
|
|
0.6x |
|
|
|
|
|
0 |
|
|
2015A |
2016A |
2017A |
2018E |
2019E |
2020E |
2021E |
2022E |
2023E |
|
|
|
|
|
|
|
|
|
|
|
|
|
|
|
|
|
|
|
||
|
Jan 09 |
Aug 10 |
Apr 12 |
Dec 13 |
Aug 15 |
Apr 17 |
Dec 18 |
|
|
Revenues ($bn) |
|
|
Core EBIT ($bn) |
|
|
|
|||
|
|
|
|
|
|
|
|
|
|
EBIT growth (%) |
|
|
Weighted average EPS growth (%) |
|
|||||
Source: Deutsche Bank, Factset. Market = MSCI Europe |
Source: Deutsche Bank, Note: large-cap European Pharma (excluding Shire) |
|
|
|
|
7 Page
2018 December 10 Pharmaceuticals Pharmaceuticals European
vk.com/id446425943 |
|
|
|
|
8 Page |
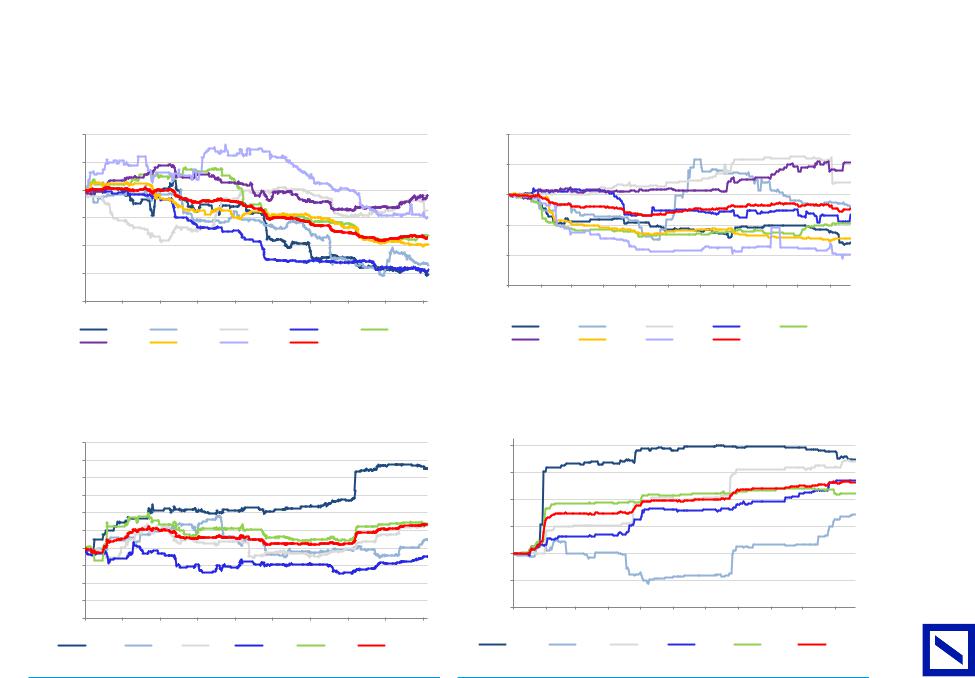
EPS downgrades for EU Pharma have stabilised |
|||
|
|
|
|
|
|
Earnings downgrades have weighed on EU Pharma but signals of stabilisation/reversion |
|||
|
|
|
|
|
|
Figure 7: EU Pharma 2019E consensus EPS rebased change |
|
Figure 8: EU Pharma 2019E consensus EPS rebased change (2018) |
|
|
(2015-2018) |
|
|
|
|
1.20 |
|
|
|
|
|
|
|
|
|
1.10 |
|
|
|
|
|
|
relative change |
1.10 |
|
|
|
|
|
|
|
|
EPS relative change |
1.05 |
|
|
|
|
|
|
|
|
|
|
|
|
|
|
|
|
|
|
|
|
|
|||
1.00 |
|
|
|
|
|
|
|
|
1.00 |
|
|
|
|
|
|
||
|
|
|
|
|
|
|
|
|
|
|
|
|
|
|
|||
0.90 |
|
|
|
|
|
|
|
|
|
|
|
|
|
|
|
||
2020E consensus EPS |
|
|
|
|
|
|
|
|
2020E consensus |
0.95 |
|
|
|
|
|
|
|
|
|
|
|
|
|
|
|
|
|
|
|
|
|
|
|||
0.80 |
|
|
|
|
|
|
|
|
|
|
|
|
|
|
|
||
|
|
|
|
|
|
|
|
|
0.90 |
|
|
|
|
|
|
||
0.70 |
|
|
|
|
|
|
|
|
|
|
|
|
|
|
|
||
|
|
|
|
|
|
|
|
|
0.85 |
Feb-18 Mar-18 |
Apr-18 May-18 |
Jun-18 |
Jul-18 |
Aug-18 Sep-18 |
Oct-18 Nov-18 |
||
0.60 |
|
|
|
|
|
|
|
|
Jan-18 |
||||||||
|
|
|
|
|
|
|
|
|
|
|
|
|
|
|
|||
|
Feb-15 |
Jul-15 |
Dec-15 |
May-16 |
Oct-16 |
Mar-17 |
Aug-17 |
Jan-18 |
Jun-18 |
Nov-18 |
|
|
|
|
|
|
|
|
|
AZN |
|
Bayer |
|
GSK |
Novartis |
Novo |
|
|
AZN |
Bayer |
GSK |
Novartis |
Novo |
||
|
|
|
|
|
|
|
|
|
|
|
|
||||||
|
|
Roche |
|
Sanofi |
|
Shire |
Average |
|
|
|
Roche |
Sanofi |
Shire |
Average |
|
||
|
|
|
|
|
|
|
|
|
|
|
|
|
|||||
Source: Deutsche Bank, Bloomberg Finance LP |
Source: Deutsche Bank, Bloomberg Finance LP |
|
|
|
|
Figure 9: US Pharma 2019E consensus EPS rebased change |
|
Figure 10: US Pharma 2019E consensus EPS rebased change (2018) |
(2015-2018) |
|
|
|
|
|
|
|
1.60 |
|
|
|
|
|
|
1.16 |
|
|
|
|
|
|
|
|
|
BankDeutsche |
changerelativeEPSconsensus2020E |
|
|
|
|
|
|
changerelativeEPSconsensus2020E |
|
|
|
|
|
|
|
|
|
|
1.50 |
|
|
|
|
|
|
|
|
|
|
|
|
|
|
|
|||
|
|
|
|
|
|
|
|
|
|
|
|
|
|
|
|
|
|
|
|
|
1.40 |
|
|
|
|
|
|
1.12 |
|
|
|
|
|
|
|
|
|
|
|
|
|
|
|
|
|
|
|
|
|
|
|
|
|
|
|
|
|
|
1.30 |
|
|
|
|
|
|
1.08 |
|
|
|
|
|
|
|
|
|
|
|
|
|
|
|
|
|
|
|
|
|
|
|
|
|
|
|
|
|
|
1.20 |
|
|
|
|
|
|
|
|
|
|
|
|
|
|
|
|
|
|
1.10 |
|
|
|
|
|
|
1.04 |
|
|
|
|
|
|
|
|
|
|
|
|
|
|
|
|
|
|
|
|
|
|
|
|
|
|
|
|
|
|
1.00 |
|
|
|
|
|
|
1.00 |
|
|
|
|
|
|
|
|
|
|
|
|
|
|
|
|
|
|
|
|
|
|
|
|
|
|
|
|
|
|
0.90 |
|
|
|
|
|
|
|
|
|
|
|
|
|
|
|
|
|
|
0.80 |
|
|
|
|
|
|
0.96 |
|
|
|
|
|
|
|
|
|
|
|
|
|
|
|
|
|
|
|
|
|
|
|
|
|
|
|
|
|
|
0.70 |
|
|
|
|
|
|
0.92 |
|
|
|
|
|
|
|
|
|
|
|
|
|
|
|
|
|
|
|
|
|
|
|
|
|
|
|
|
AG/London |
|
0.60 |
|
|
|
|
|
|
Jan-18 |
Feb-18 Mar-18 Apr-18 |
May-18 |
Jun-18 |
Jul-18 |
Aug-18 |
Sep-18 |
Oct-18 |
Nov-18 |
|
|
Feb-15 Jul-15 Dec-15 |
May-16 Oct-16 |
Mar-17 Aug-17 Jan-18 |
Jun-18 Nov-18 |
|
|
|
|
|
|
|
|
|
|
|
|||
|
|
|
|
|
|
|
|
|
|
|
|
|
||||||
|
|
AbbVie |
BMS |
Lilly |
Merck |
Pfizer |
Average |
|
AbbVie |
BMS |
Lilly |
|
Merck |
|
Pfizer |
|
Average |
|
|
Source: Deutsche Bank, Bloomberg Finance LP |
|
|
|
|
Source: Deutsche Bank, Bloomberg Finance LP |
|
|
|
|
|
|
|
|||||
2018 December 10 Pharmaceuticals Pharmaceuticals European
vk.com/id446425943
Bank Deutsche |
Share performance to largely reflect EPS growth |
||||
|
|
|
|
||
Our price targets imply minimal overall re-rating |
|
|
|
||
AG/London |
|
in-line with the 10 year average of PE vs growth relative to the market. |
|||
|
■ |
At 16x forward PE (excluding Bayer) valuations appear reasonable vs history. However, given a broader market de-rating this puts EU Pharma at |
|||
|
|
the upper end of its relative PE range over the last ten years. Despite this our expectations for solid growth means this still puts the sector broadly |
|||
|
■ |
Large Pharma stocks are trading at a ~10% discount to our DCF valuations, suggesting more moderate upside than in the recent past. This is |
|||
|
|
below the >25% discount at end 2016 and the 15% discount at the end of 2017. |
|||
|
■ |
Price targets imply modest re-rating potential; upside based on improving growth prospects. Our price targets imply a target PE of ~16x forward |
|||
|
|
PE and are broadly consistent with our DCF valuations implying a median ~10% share price return. Our target PE is a modest premium to the sector |
|||
|
|
long run average of 15x given improved R&D productivity and growth prospects versus the historic average. However, this would still leave Pharma |
|||
|
|
trading on a significant discount to current Consumer Staples stocks (HPC) which trade at 18x. |
|||
|
|
|
|
|
|
|
Figure 11: ~15% PE premium but in line with PE vs growth trend |
|
Figure 12: DCF valuations imply target sector of 16x |
||
|
|
|
|
|
|
|
|
CURRENT PHARMA PE REL VS EPS GROWTH |
|
|
|
Price |
|
2020 PE |
|
|
|
Upside vs |
Implied |
|||
|
|
|
|
|
|
|
implied by |
Upside to |
|
Target |
current |
2020 PE at |
||||
|
|
5.0% |
|
|
|
|
|
|
|
|
|
|||||
relative |
|
REL IS IN LINE WITH HISTORICAL TREND |
|
|
|
Company |
07-Dec-18 |
DCF value |
DCF |
DCF (%) |
2020E PE |
price |
price |
14.8x |
||
|
|
|
|
|
|
|
Bayer AG |
EUR 63.4 |
EUR 123.3 |
15.9x |
94.5% |
8.2x |
EUR 115.0 |
81.3% |
||
|
|
|
|
|
|
|
|
AstraZeneca |
5,927.0p |
6,821.8p |
17.8x |
15.1% |
15.5x |
6,900.0p |
16.4% |
18.0x |
growth |
|
0.0% |
|
|
|
|
|
GlaxoSmithKline |
1,437.4p |
1,500.0p |
13.5x |
4.4% |
12.9x |
1,520.0p |
5.7% |
13.7x |
|
|
|
|
|
|
|
||||||||||
|
|
|
|
|
|
|
Novo Nordisk |
DKK 300.3 |
DKK 380.0 |
20.4x |
26.5% |
16.2x |
DKK 355.0 |
18.2% |
19.1x |
|
EPSFWDmonth |
marketto |
|
|
|
|
|
|
Novartis |
CHF 87.0 |
CHF 95.9 |
16.9x |
10.2% |
14.0x |
CHF 96.0 |
10.3% |
16.9x |
-5.0% |
|
|
|
|
|
Roche |
CHF 250.7 |
CHF 228.5 |
12.3x |
-8.9% |
13.5x |
CHF 255.0 |
1.7% |
13.8x |
||
|
|
|
|
|
|
|
|
Sanofi |
EUR 76.6 |
EUR 94.0 |
15.4x |
22.8% |
12.5x |
EUR 93.0 |
21.5% |
15.2x |
|
|
|
|
|
|
|
|
Median |
|
|
15.9x |
|
13.5x |
|
|
15.2x |
|
|
-10.0% |
|
|
|
|
|
Median (excluding Bayer) |
|
16.1x |
|
13.8x |
|
|
16.1x |
|
|
|
|
|
|
|
|
|
Average |
|
|
16.0x |
|
13.3x |
|
|
15.9x |
|
|
|
|
|
|
|
|
Average (excl Bayer) |
|
|
16.1x |
|
14.1x |
|
|
16.1x |
24 |
|
-15.0% |
|
|
|
|
|
|
|
|
|
|
|
|
|
|
|
|
|
|
|
|
|
|
|
|
|
|
|
|
|
|
|
Pharma |
|
-20.0% |
|
|
|
|
|
|
|
|
|
|
|
|
|
|
|
|
|
|
|
|
|
|
|
|
|
|
|
|
|
|
|
|
|
-20% |
-10% |
0% |
10% |
20% |
30% |
40% |
|
|
|
|
|
|
|
|
Pharma 12 mth Fwd PE premium/discount to market
Source: Deutsche Bank, Bloomberg Finance LP. Pharma = MSCI Europe Pharmaceuticals, Biotechnology & Life Sciences. Market = |
Source: Deutsche Bank |
|
MSCI Europe. |
|
|
|
|
|
9 Page
2018 December 10 Pharmaceuticals Pharmaceuticals European
vk.com/id446425943
Page |
Valuation |
|
|
|
|
|
|
|
|
|
|
|
|
|
|
|
|
|
|
10 |
|
|
|
|
|
|
|
|
|
|
|
|
|
|
|
|
|
|
|
|
Figure 13 : Comparable analysis |
|
|
|
|
|
|
|
|
|
|
|
|
|
|
|
|
||
|
|
|
Price |
Target |
Upside vs |
% Total |
Mcap |
|
|
|
PER |
|
|
|
|
EPS CAGR |
EPS CAGR |
Div yld |
FCF yld |
|
Stock |
Rec. |
07-Dec-18 |
price |
current price |
return |
(lc; bn) |
(US$bn) |
|
|
|
|
|
|
|
18E-'23E |
19E-'23E |
|
|
|
EU major Pharma |
|
|
|
|
|
|
881.0 |
16.0 |
15.7 |
14.8 |
13.5 |
12.3 |
11.6 |
11.3 |
6.8% |
7.0% |
3.9% |
6.1% |
|
AstraZeneca |
Buy |
5,955p |
6,900 |
16% |
20% |
75.3 |
96.3 |
14.6 |
22.4 |
20.1 |
15.6 |
13.0 |
11.3 |
10.6 |
15.5% |
16.5% |
3.7% |
5.0% |
|
Bayer |
Buy |
EUR 62.4 |
115 |
84% |
89% |
58.7 |
66.8 |
16.3 |
10.7 |
9.0 |
8.0 |
7.3 |
6.7 |
6.2 |
11.5% |
9.6% |
4.8% |
10.3% |
|
GlaxoSmithKline |
Hold |
1,418p |
1,520 |
7% |
13% |
69.7 |
89.1 |
13.9 |
12.4 |
12.8 |
12.8 |
11.9 |
11.0 |
10.6 |
3.2% |
4.9% |
5.6% |
4.8% |
|
Novartis |
Hold |
CHF 87.4 |
96 |
10% |
13% |
202.2 |
201.8 |
16.7 |
17.1 |
15.4 |
14.0 |
12.4 |
11.8 |
11.6 |
8.2% |
7.4% |
3.4% |
5.2% |
|
Novo Nordisk |
Buy |
DKK 296 |
355 |
20% |
23% |
716.8 |
109.3 |
18.2 |
18.6 |
17.9 |
15.9 |
14.2 |
12.3 |
11.2 |
10.6% |
12.3% |
2.9% |
4.9% |
|
Roche |
Hold |
CHF 247.3 |
255 |
3% |
7% |
210.7 |
210.3 |
16.1 |
13.7 |
13.4 |
13.4 |
13.1 |
13.7 |
13.9 |
-0.3% |
-1.0% |
4.0% |
6.5% |
|
Sanofi |
Buy |
EUR 75.6 |
93 |
23% |
27% |
94.4 |
107.4 |
14.8 |
13.7 |
13.4 |
12.4 |
11.1 |
10.0 |
9.9 |
6.7% |
7.7% |
4.1% |
7.5% |
|
EU mid-cap Pharma |
|
|
|
|
|
|
121.2 |
21.0 |
20.2 |
20.5 |
17.6 |
16.0 |
14.7 |
13.9 |
8.3% |
8.4% |
1.6% |
3.3% |
|
Evotec |
Buy |
EUR 18.4 |
22 |
20% |
20% |
2.7 |
3.1 |
na |
46.6 |
51.7 |
46.0 |
57.8 |
47.0 |
39.9 |
3.2% |
6.7% |
0.0% |
1.9% |
|
Genmab |
Buy |
DKK 1,006 |
1,250 |
24% |
24% |
60.6 |
9.2 |
na |
>50 |
41.1 |
29.1 |
18.7 |
14.4 |
12.7 |
32.0% |
34.1% |
0.0% |
2.5% |
|
Grifols A shares |
Hold |
EUR 24.2 |
25 |
3% |
5% |
16.7 |
19.0 |
24.3 |
23.6 |
20.5 |
18.7 |
16.8 |
15.2 |
13.6 |
11.7% |
10.9% |
1.5% |
3.7% |
|
Idorsia A shares |
Buy |
CHF 18.5 |
29 |
57% |
57% |
2.3 |
2.3 |
na |
na |
na |
na |
na |
na |
na |
-29.3% |
-38.4% |
0.0% |
-19.4% |
|
Lundbeck |
Sell |
DKK 262.1 |
225 |
-14% |
-10% |
51.8 |
7.9 |
20.8 |
11.4 |
13.6 |
11.7 |
11.1 |
11.3 |
11.1 |
0.5% |
5.1% |
4.0% |
6.1% |
|
Merck KGaA |
Hold |
EUR 94.8 |
93 |
-2% |
0% |
41.2 |
46.9 |
16.8 |
18.3 |
16.8 |
15.7 |
14.7 |
13.9 |
13.0 |
7.1% |
6.7% |
1.4% |
4.1% |
|
Morphosys |
Buy |
EUR 95.4 |
130 |
36% |
36% |
2.8 |
3.1 |
na |
na |
na |
na |
na |
>50 |
25.4 |
-213.6% |
na |
0.0% |
-3.2% |
|
Polyphor |
Buy |
CHF 21.0 |
78 |
272% |
272% |
0.2 |
0.2 |
na |
na |
na |
na |
na |
na |
23.0 |
-173.7% |
na |
0.0% |
-23.5% |
|
SOBI |
Buy |
SEK 189.6 |
245 |
29% |
29% |
51.2 |
5.7 |
22.3 |
18.7 |
14.1 |
12.6 |
11.9 |
11.1 |
10.8 |
11.6% |
7.0% |
0.0% |
-17.2% |
|
UCB |
Buy |
EUR 74.0 |
95 |
28% |
30% |
13.9 |
15.8 |
13.3 |
15.7 |
15.9 |
14.7 |
13.7 |
14.8 |
14.7 |
1.4% |
2.1% |
1.8% |
6.7% |
|
Vifor Pharma |
Hold |
EUR 120.8 |
135 |
12% |
13% |
7.8 |
7.9 |
52.7 |
31.6 |
27.1 |
17.5 |
14.1 |
11.5 |
9.7 |
26.8% |
29.4% |
1.7% |
3.1% |
|
Source: Deutsche Bank |
|
|
|
|
|
|
|
|
|
|
|
|
|
|
|
|
|
|
AG/London Bank Deutsche
2018 December 10 Pharmaceuticals Pharmaceuticals European