

DB European Pharmaceuticals 2019 Outlook_watermark
.pdfvk.com/id446425943
Bank Deutsche |
|
|
Vifor Pharma (Hold; PT CHF135) |
||||||||||||||||||||||||||
|
|||||||||||||||||||||||||||||
|
|
|
|
|
|
|
|
|
|
|
|
|
|
|
|
|
|
|
|
||||||||||
|
|
Focus remains on uptake of Veltassa and further growth of Ferinject |
|||||||||||||||||||||||||||
AG/London |
|
|
|
|
|
of potential blockbuster Veltassa and further growth of likely blockbuster Ferinject as key success factors. The balance sheet is strong and growth |
|||||||||||||||||||||||
|
|
|
■ |
|
The jury remains out. Vifor Pharma is a global specialty pharma company focused on iron deficiency, nephrology, and cardio renal therapies. Following |
||||||||||||||||||||||||
|
|
|
|
|
|
the acquisition of Relypsa and disposal of Santè, focus is on execution on 2020 goals (>CHF2bn sales, high 3-digit million EBITDA) with the uptake |
|||||||||||||||||||||||
|
|
|
|
|
|
beyond 2020 could be industry leading, however visibility on such development appears limited at this stage and with shares trading at a meaningful |
|||||||||||||||||||||||
|
|
|
|
|
|
premium to the sector, we see balanced risk reward on a 12 month horizon; Hold. |
|
|
|||||||||||||||||||||
|
|
|
■ |
|
Taking a more cautious view on Veltassa and cost, while still convinced of Ferinject. Veltassa sales guidance for 2018 was lowered to E90m (100m) |
||||||||||||||||||||||||
|
|
|
|
|
|
and with competitor Lokelma now in the market, we have reduced our Veltassa estimates by c10%. In addition, we have assumed higher spending |
|||||||||||||||||||||||
|
|
|
|
|
|
behind the compound as data generation will be key to create awareness. Meanwhile, we remain convinced of Ferinject’s potential and agree with |
|||||||||||||||||||||||
|
|
|
|
|
|
management’s view that the product can generate >CHF2bn of in-market sales by 2025. Overall, we have lowered our earnings forecasts by c.10% |
|||||||||||||||||||||||
|
|
|
|
|
|
for outer years and our DCF-derived target to CHF135 (CHF180) to reflect a more conservative stance on longer-term growth prospects. |
|||||||||||||||||||||||
|
|
|
■ |
|
Events to watch out for in 2019. Vifor Pharma expects PI data for VIT-2763 (ferroprtin inhibitor), partnering of the Japanese rights for CCX140 and |
||||||||||||||||||||||||
|
|
|
|
|
|
filing of Rayaldee still before year end, while approval of Avacopan in Europe should come either late this or early next year. 2H18 results, which will |
|||||||||||||||||||||||
|
|
|
|
|
|
likely include first sales of Retacrit, and 2019 guidance are due on 14 March, while we would expect the launch of Ferinject in Japan and read-out of |
|||||||||||||||||||||||
|
|
|
|
|
|
the AMBER trial (investigating the use of Veltassa in patients with resistant hypertension) sometime in 1H next year. 1H19 results are due on 8 August, |
|||||||||||||||||||||||
|
|
|
|
|
|
while data from the AFFIRM-AHF trial of Ferinject in 2H could lead to further improvements in the guideline recommendation for use in heart failure |
|||||||||||||||||||||||
|
|
|
|
|
|
patients in Europe. We also believe Vifor will remain active on the in-licensing front with possibly a few more deals in the coming 12-18 months. |
|||||||||||||||||||||||
|
|
|
|
|
|
|
|
|
|
|
|
|
|
|
|
|
|
|
|
|
|
|
|
||||||
|
|
|
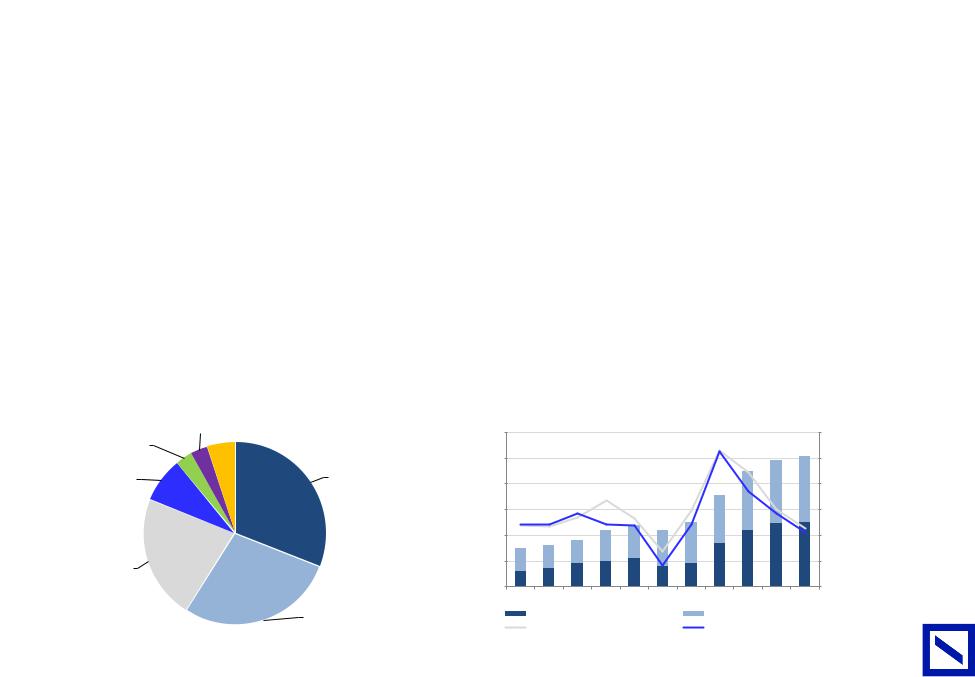
Figure 134 : Growth profile - Revenue (CHFm) |
|
|
|
|
|
|
|
|
Figure 135 : Potential newsflow |
|||||||||||||||||
|
|
3,000 |
|
|
|
|
|
|
|
|
|
|
|
|
|
|
|
|
|
|
|
|
|
|
|
Timing |
Event / Description |
||
|
|
|
|
|
|
|
|
|
|
|
|
|
|
|
|
|
|
|
|
|
|
|
|
|
|
|
|
||
|
|
|
|
|
|
|
|
|
|
|
|
|
|
|
|
|
|
|
|
|
|
|
|
|
|
|
4Q-18 |
PI data VIT-2763 |
|
|
|
2,500 |
|
|
|
|
|
|
|
|
|
|
|
|
|
|
|
|
|
|
|
|
|
|
|
4Q-18 |
partnering of Japnese rights for CCX140 |
||
|
|
|
|
|
|
|
|
|
|
|
|
|
|
|
|
|
|
|
|
|
|
|
|
|
4Q-18 |
Avacopan EMA filing |
|||
|
|
|
|
|
|
|
|
|
|
|
|
|
|
|
|
|
|
|
|
|
|
|
|
|
|
|
|||
|
|
2,000 |
|
|
|
|
|
|
|
|
|
|
|
|
|
|
|
|
|
|
|
|
|
|
|
4Q-18/1Q-19 |
M7824 (anti-PD-L1/TGF- trap) - Initiation of 2L BTC trial & decision on further NSCL trial settings |
||
|
|
|
|
|
|
|
|
|
|
|
|
|
|
|
|
|
|
|
|
|
|
|
|
|
14-Mar-19 |
2H 2018 results and 2019 guidance |
|||
|
|
|
|
|
|
|
|
|
|
|
|
|
|
|
|
|
|
|
|
|
|
|
|
|
|
|
|||
|
|
1,500 |
|
|
|
|
|
|
|
|
|
|
|
|
|
|
|
|
|
|
|
|
|
|
|
1H-19 |
Ferinject launch Japan |
||
|
|
|
|
|
|
|
|
|
|
|
|
|
|
|
|
|
|
|
|
|
|
|
|
||||||
|
|
|
|
|
|
|
|
|
|
|
|
|
|
|
|
|
|
|
|
|
|
|
|
|
|
|
1H-19 |
AMBER read-out |
|
|
|
1,000 |
|
|
|
|
|
|
|
|
|
|
|
|
|
|
|
|
|
|
|
|
|
|
|
08-Aug-18 |
1H 2019 results |
||
|
|
|
|
|
|
|
|
|
|
|
|
|
|
|
|
|
|
|
|
|
|
|
|
||||||
|
|
|
|
|
|
|
|
|
|
|
|
|
|
|
|
|
|
|
|
|
|
|
|
|
|
|
2H-19 |
AFFIRM-AHF read-out |
|
|
|
500 |
|
|
|
|
|
|
|
|
|
|
|
|
|
|
|
|
|
|
|
|
|
|
|
FY-19 |
further in-licesning deals |
||
|
|
|
|
|
|
|
|
|
|
|
|
|
|
|
|
|
|
|
|
|
|
|
|
||||||
|
|
0 |
|
|
|
|
|
|
|
|
|
|
|
|
|
|
|
|
|
|
|
|
|
|
|
|
|
|
|
|
|
|
2014A |
|
2015A |
2016A |
2017A |
2018E |
2019E |
2020E |
2021E |
|
2022E |
|
|
||||||||||||||
|
|
|
|
|
|
|
|
|
|
||||||||||||||||||||
71 Page |
|
|
|
|
Ferinject |
|
Mircera |
|
Veltassa |
|
Velphoro |
|
|
Retacrit |
|
|
Avacopan |
|
|
Rayaldee |
|
Others |
|
|
|||||
|
|
|
|
|
|
|
|
|
|
|
|
|
|||||||||||||||||
|
|
|
|
|
|
|
|
|
|
|
|
|
|||||||||||||||||
|
|
Source: Deutsche Bank, Company data |
|
|
|
|
|
|
|
|
|
|
|
|
|
|
|
|
|
Source: Deutsche Bank, Company data |
|
||||||||
|
|
|
|
|
|
|
|
|
|
|
|
|
|
|
|
|
|
|
|
||||||||||
|
|
|
|
|
|
|
|
|
|
|
|
|
|
|
|
|
|
|
|
|
|
|
|
|
|
|
|
|
|
|
|
|
|
|
|
|
|
|
|
|
|
|
|
|
|
|
|
|
|
|
|
|
|
|
|
|
|
|
|
2018 December 10 Pharmaceuticals Pharmaceuticals European

vk.com/id446425943
Page |
Figure 136 : Vifor Pharma summary P&L |
|
|
|
|
|
|
|
|
|
||
|
|
|
|
|
|
|
|
|
|
|||
72 |
CHFm ex-per share data |
2014A |
2015A |
2016A |
2017A |
2018E |
2019E |
2020E |
2021E |
2022E |
||
|
|
|
|
|
|
|
|
|
|
|
||
Revenue |
844 |
987 |
1,267 |
1,383 |
1,623 |
1,873 |
2,186 |
2,529 |
2,892 |
|||
|
||||||||||||
|
Growth |
|
17% |
28% |
9% |
17% |
15% |
17% |
16% |
14% |
||
|
Gross profit |
809 |
854 |
822 |
865 |
1,022 |
1,227 |
1,486 |
1,783 |
2,097 |
||
|
Gross margin |
96% |
87% |
65% |
63% |
63% |
66% |
68% |
71% |
73% |
||
|
SG&A |
413 |
363 |
463 |
546 |
611 |
648 |
668 |
771 |
874 |
||
|
R&D |
104 |
119 |
122 |
185 |
195 |
219 |
249 |
281 |
312 |
||
|
EBITDA |
292 |
373 |
322 |
280 |
371 |
521 |
739 |
911 |
1,100 |
||
|
EBITDA margin |
35% |
38% |
25% |
20% |
23% |
28% |
34% |
36% |
38% |
||
|
EBIT |
256 |
328 |
237 |
134 |
216 |
359 |
569 |
731 |
910 |
||
|
EBIT margin |
|
33% |
19% |
10% |
13% |
19% |
26% |
29% |
31% |
||
|
Financial result |
-1 |
-6 |
-11 |
-9 |
41 |
-2 |
-1 |
-1 |
-1 |
||
|
Income tax |
29 |
40 |
-2 |
2 |
12 |
47 |
74 |
95 |
118 |
||
|
Tax rate |
12% |
13% |
-1% |
1% |
5% |
13% |
13% |
13% |
13% |
||
|
Net income |
199 |
212 |
237 |
1,147 |
139 |
181 |
339 |
447 |
571 |
||
|
EPS |
3.07 |
3.27 |
3.65 |
17.67 |
2.14 |
2.78 |
5.22 |
6.89 |
8.80 |
||
|
CORE EPS |
3.27 |
3.56 |
3.06 |
2.12 |
3.82 |
4.46 |
6.90 |
8.57 |
10.48 |
||
|
Growth |
|
9% |
-14% |
-31% |
80% |
17% |
55% |
24% |
22% |
||
|
Source: Deutsche Bank, Company data |
|
|
|
|
|
|
|
|
|
|
|
|
|
|
|
|
|
|
|
|
|
|
||
|
|
|
|
|
|
|
|
|||||
|
|
|
|
|
|
|
|
|||||
|
Figure 137 : EBITDA development |
|
|
|
|
Figure 138 : Revenue and EBITDA margin development |
|
|||||
|
|
|
|
|
|
|
|
|
|
|
|
|
|
700 |
|
|
|
|
|
|
2,500 |
|
|
|
|
|
45% |
|
600 |
|
|
|
|
|
|
|
|
|
|
|
|
40% |
|
|
|
|
|
|
|
|
|
|
|
|
|
|
|
|
|
|
|
|
|
|
|
2,000 |
|
|
|
|
|
35% |
|
|
|
|
|
|
|
|
|
|
|
|
|
|
|
|
500 |
|
|
|
|
|
|
|
|
|
|
|
|
30% |
|
|
|
|
|
|
|
|
|
|
|
|
|
|
|
|
400 |
|
|
|
|
|
|
1,500 |
|
|
|
|
|
25% |
|
|
|
|
|
|
|
|
|
|
|
|
|
||
|
|
|
|
|
|
|
|
|
|
|
|
|
|
|
Deutsche |
300 |
|
|
|
|
|
|
1,000 |
|
|
|
|
|
20% |
|
|
|
|
|
|
|
|
|
|
|
|
|||
|
|
|
|
|
|
|
|
|
|
|
|
|
||
|
|
|
|
|
|
|
|
|
|
|
|
|
15% |
|
|
|
|
|
|
|
|
|
|
|
|
|
|
|
|
|
200 |
|
|
|
|
|
|
|
|
|
|
|
|
|
|
|
|
|
|
|
|
|
500 |
|
|
|
|
|
10% |
|
|
|
|
|
|
|
|
|
|
|
|
|
|
|
Bank |
100 |
|
|
|
|
|
|
|
|
|
|
|
|
5% |
|
|
|
|
|
|
|
|
|
|
|
|
|
||
0 |
|
|
|
|
|
|
0 |
|
|
|
|
|
0% |
|
AG/London |
2014A |
2015A |
2016A |
2017E |
2018E |
2019E |
2020E |
2014A |
2015A |
2016A |
2017A |
2018E |
2019E |
2020E |
|
|
EBIT (incl. Relypsa) |
Relypsa dilution |
|
|
|
|
Sales (CHF m) |
|
EBITDA margin (%) |
|
|||
|
|
|
|
|
|
|
|
|
||||||
|
Source: Deutsche Bank, Company data |
|
|
|
|
|
Source: Deutsche Bank, Company data |
|
|
|
|
|
||
2018 December 10 Pharmaceuticals Pharmaceuticals European

vk.com/id446425943
Deutsche |
|
Appendix A - M&A by company |
|
|
|||
|
|
|
|
Bank |
|
■ |
AstraZeneca: has limited resources to engage in further pipeline driven M&A given its current leverage. However, we believe the company is likely |
|
|
||
AG/London |
|
|
to continue to evaluate earnings accretive deals that fit within its current growth platforms (oncology, cardiovascular, respiratory, diabetes). We also |
|
|
expect AstraZeneca to continue to out licence non-core products and opportunistically dispose of the rights of older products. We also do not believe |
|
|
|
|
|
|
|
|
AstraZeneca is a target due to its size and strategic importance to the UK government, albeit, its oncology pipeline and CV, diabetes and respiratory |
|
|
|
platforms could be attractive to a number of companies. DB Conclusion: no major deals likely. |
|
|
■ |
Bayer : Digestion of Bayer’s acquisition of Monsanto remains the focus for the coming year, and management comments suggest other large-scale |
|
|
|
deals are unlikely in the short to mid-term. However, divestment of Bayer's Radiology or Animal Health businesses are possible. Bayer may, also, |
|
|
|
engage in smaller in-licensing deals to bolster its Pharma pipeline. DB Conclusion: preoccupied with integrating Monsanto. However, expect more |
|
|
|
investor noise over the ine ciencies and oversight of Bayer's conglomerate structure. |
|
|
■ |
GlaxoSmithKline : GSK is digesting its acquisition of Novartis' consumer health division. We expect no major M&A, particularly given GSK's high |
|
|
|
dividend commitments, but do expect renewed e ort to bolster it Pharma pipeline and research platforms. DB Conclusion: Management likely to |
|
|
|
explore pipeline opportunities. |
|
|
■ |
Novartis : Novartis, under new management, is in a patent free growth phase in its business cycle and as such has been looking to have this |
|
|
|
recognised by the market by shedding its once defensive but lower growth businesses. We expect Alcon to be split in 2019, in line with management |
|
|
|
statements. Furthermore we expect divestment of some generic products as well as tail products within Pharma. We believe management has |
|
|
|
identified deficiencies in its platform technologies if it is to remain a leader in innovation and is part way in building its cell, genetic and radiological |
|
|
|
franchises. With low debt and further potential sources of cash at its disposal, we do not rule out further pipeline acquisitions by Novartis. Furthermore, |
|
|
|
we would not be surprised if Novartis were to lead the charge in terms of innovative solutions to combat pricing pressure in competitive categories |
|
|
|
through partnerships in competitive broad therapeutic categories with the aim of building synergy as well as relevelling the balance of Buyer and |
|
|
|
seller power in the US. DB Conclusion: M&A to focus on pharma, likely small to mid-size. |
|
|
■ |
Novo Nordisk : Historically, Novo has always been reluctant to do M&A with a strong focus on organic growth. However, as its biopharma division |
|
|
|
faces competitive pressure, the company has stated it will take an opportunistic approach to returning this division to growth. In addition, the company |
|
|
|
will keep an open mind about opportunities in CV, obesity, NASH and other related diseases where Novo can leverage its core expertise from diabetes. |
|
|
|
DB Conclusion: Small bolt-ons possible but limited potential targets. |
|
|
■ |
Roche : Roche is typically acquisitive with constant pipeline and technology acquisitions as well as modest sized bolt-on deals. Although smaller bolt- |
|
|
|
ons are most likely, the possibility of a large scale M&A remains should Roche's pipeline stall and/or biosimilar erosion occur faster than anticipated. |
|
|
|
A strong cash position means the company could raise significant debt to fund a deal, if required. DB Conclusion: The most uncertain, but small- |
|
|
|
to-mid bolt-ons seem most likely. |
|
|
■ |
Sanofi : Following the flurry of deals in early 2018 (Bioverativ, Ablyx) we expect only modest M&A for Sanofi in 2019 related to the pipeline. However, |
|
|
|
given Sanofi operates in a number of competitive categories, we do expect over the longer term Sanofi to engage with partners to rightsize portfolios |
|
|
|
and e orts in Cardiovascular, Diabetes, and Oncology. DB Conclusion: A medium-sized deal is possible if a target can be found. |
73 Page |
|
|
|
2018 December 10 Pharmaceuticals Pharmaceuticals European

vk.com/id446425943
10 December 2018 Pharmaceuticals European Pharmaceuticals
Appendix B - Price targets and risks
AstraZeneca (Buy, TP: 6900p)
Our target price is based on a 50:50 blend of a 15% premium to our sector target PE of 16x 2020 PE (given above peer group growth) and our base case DCF (WACC 8.2%; beta 0.9, ERP 5.5%, RFR from local 10-yr govt bond yields; TGR 2.0%- reflecting expected longer-term growth trends). Risks include lower sales from the growth platforms given pressure on respiratory/diabetes, failure of key pipeline drugs and failure to deliver expected margin improvements from new launches.
Bayer (Buy, TP: EUR 115)
Our one year price target is based on a 50:50 blend of DCF & SOTP. For DCF, we utilise WACC 7.4%, TGR 2.5%, Beta 1.0 and ERP 6.5%. For SOTP we utilise peer multiples and our view of the current position within the cycle - Crop is valued at 17x 2020 EV/EBITDA, Pharma 12x and Consumer 16x. We incorporate a discount of 10% to reflect Bayer's conglomerate structure and a legal provision of €5bn in respect of on-going glyphosate litigation. Key risks to our assumptions include failure to execute on the Crop integration, a prolonged down-cycle in Crop, Pharma M&A risk, turnaround of the Consumer Health division and adverse conclusions from ongoing glyphosate litigation.
GlaxoSmithKline (Hold, TP: 1520p)
Our target price for GSK is based on an average of PE and DCF methodologies. We use a 15% discount to our sector average 2020E PE of 16x given GSK's lower growth prospects and due to its accounting treatment of dolutegravir royalties (which inflates adjusted EPS). Our DCF utilises a WACC of 8.1% (beta 0.9, ERP 5.5%, RFR based on long-term govt bond yields) and TGR of 2.0% based on our view on the long-term growth prospects for the company. Risks include potential for improved pipeline prospects, better/worse-than-expected performance of the respiratory, HIV and Vaccines divisions and impact from potential Consumer acquisitions.
Novartis (Hold, TP: CHF 96)
Our target price is based on an average of 2020E target PE and DCF methodologies. Our DCF valuation utilises three stage cash-flow forecasts, a WACC of 8.2% (we choose a beta of 0.9 and ERP of 5.5% and RFR based from LT government bond yields) and a terminal growth rate of 1.5%. Our PE target is set by a sector PE of 16x 2020E EPS, reflecting the sector's long run average and our expectation for above market EPS growth. The key risks for Novartis relate to the commercial success of new drugs particularly Cosentyx and Entresto, the approval and subsequent launches of AVXS-101, RTH258 and Mayzent, and successful execution on the planned spin-o of eye care division Alcon during 2019. In each case the progress of these items could have positive or negative
Page 74 |
Deutsche Bank AG/London |

vk.com/id44642594310 December 2018
Pharmaceuticals European Pharmaceuticals
impacts to the shares. In addition, we see risks from clinical trial success/failure as well as broader macro risk and currency.
Novo Nordisk (Buy, TP: DKK 355)
Our target price is set by an average of PE and DCF. Our 2020E sector target PE is set at 16x (reflecting the sector's long run average and our expectation for above market EPS growth) and we set a 10% premium to the sector reflecting Novo's sustainable growth prospects. Our DCF valuation utilises a three stage cash-flow forecast, and is based on a WACC of 8.4%, ERP of 5.5%, Beta of 0.9 and a terminal growth rate of 2%. We see risks should competition be more severe than expected or there is a significant adverse development in the US pricing environment. We also see risks from unsuccessful approval and worse uptake of oral semaglutide, and worse competition in the haemophilia franchise.
Roche (Hold, TP: CHF 255)
Our target price is based on an average of 2020E target PE and DCF methodologies. Our DCF valuation uses three stage cash-flow forecasts, a WACC of 8.1% (beta of 0.9, ERP of 5.5% and RFR based from LT government bond yields) and a terminal growth rate of 2.0%. Our PE target is set by a sector PE of 16x 2020E EPS, reflecting the sector's long run average and our expectation for above market EPS growth. Key downside risks: faster-than-anticipated progress of biosimilars, competitive developments in immuno-oncology, obsolescence of key drugs due to emerging competitor products in certain drug categories, valuedestructive M&A. Key upside risks: delays to biosimilar launches and penetration, Hemlibra uptake, value-creative M&A.
Sanofi (Buy, TP: EUR 93)
Our price target is based on an average of PE and DCF. We use a 2020E sector PE of 16x while our DCF utilises three-stage cash-flow forecasts, a WACC of 8.1% (beta 1.0, ERP 6.5%, RFR based on local 10-yr govt bond yields) and TGR of 1.5%. Our PE target is set by a sector PE of 16x 2020E EPS, reflecting the sector's long run average and our expectation for above market EPS growth. Risks relate to the pace of Dupixent uptake and the emergence of new competitors, the impact of Hemlibra on the haemophilia business, Phase III clinical trial failure and volatility in emerging markets.
Deutsche Bank AG/London |
Page 75 |

vk.com/id446425943
10 December 2018 Pharmaceuticals European Pharmaceuticals
Evotec (Buy, TP: EUR 22)
Our target price is SOTP based as we believe that it best reflects the company's profile. For the "EVT Execute" services business, we use a DCF and our assumptions include a WACC of 8.0% (based on levered beta of 1.0, risk-free rate of 4%, equity risk premium of 5.5%) and terminal growth of 3% (slightly above GDP growth due to Evotec's strong growth profile/outlook). For the "EVT Innovate" segment, we apply a NPV analysis of the individual pipeline projects. Downside risks relate to macros and a slowdown in the outsourced drug discovery market, healthcare reforms, slower-than-expected integration of acquisitions, lower share of success-based payments, competition, and M&A.
Genmab (Buy, TP: DKK 1,250)
Our 12-month price target is based on DCF using a WACC of 8.5%; beta of 0.9, ERP of 5.5%, RFR of 3.5% based on long-term government bond yields and terminal growth rate of 2.0% in line with our sector average long-term assumption. Key downside risks largely reflect uncertainty over Darzalex's commercial potential in multiple myeloma and other development stage indications; risk of increased competition for Darzalex from new therapeutic alternatives in multiple myeloma including CAR-T and BCMA targeting drugs and risk of failure of Genmab's early stage pipeline.
Grifols (Hold, TP: EUR 25)
Our price target is based on our DCF valuation. This utilizes three-stage cashflow based on our forecasts for sales and profitability of the various divisions. We set our terminal growth rate at 2%, in line with the long-run growth rate of the sector. We use a WACC of 8.3% based on a risk-free rate equal to long-term government bond yields of 3.5%, equity risk premium of 5.5% and beta of 1.1. Key upside risks include potential albumin use in Alzheimer's and market share gains. Downside risks are failure to execute on capacity improvements, greater competition from FcRn inhibitors and other novel drug classes, and slowing global demand for plasma therapeutics.
Idorsia (Buy, TP: CHF 29)
Our Price Target is derived using risk-adjusted DCF. We use a WACC of 9.0%, Beta 1.0, ERP 5.5% and TGR 2.0%. Our three-stage DCF model is based on our explicit forecasts for Idorsia out to 2025. We then assume growth in FCF fades from 15% to a terminal growth rate range of 2.0% in 2032. Our choice of terminal growth is consistent with assumptions for our other pharma/biotech coverage and in-line with our assumptions for long-term industry growth. The main risks to this are: 1) clinical failure of the pipeline, most meaningfully near-term trials of clazosentan; 2) disappointing commercial potential of aprocitentan; and 3) failure to secure financing to profitability.
Lundbeck (Sell, TP: DKK 225)
We set our price target using DCF (WACC 9%, Beta 1.0, ERP 5.5%, TGR 2.0%) in an aim to better capture both the mid and long-term implications of its potential earnings curve and subsequent decline. Key upside risks include greater-than-
Page 76 |
Deutsche Bank AG/London |

vk.com/id44642594310 December 2018
Pharmaceuticals European Pharmaceuticals
expected performance of legacy products as well as better than forecast sales of new drugs Rexulti, Abilify Maintena and Trintellix.
Merck KGa (Hold, TP: EUR 93)
We value Merck on a simple average of SOTP and DCF as we believe this best reflects investors' appreciation of the di erent business segments and longerterm growth prospects of the group. Our SOTP looks at a broad range of peers by division with a focus on P/E and EV/EBITDA multiples. While we believe Life Science deserves to trade in line with peers, we apply a 20% discount to both Healthcare (given limited pipeline opportunities and an underwhelming track record historically) and Performance Materials (given an uncertain outlook for liquid crystals). Our DCF assumes a WACC of 8% (based on levered beta of 1, risk-free rate 4%, and equity risk premium 5%, as we assume for most of our healthcare coverage) and TG of 2% (in line with long-term GDP growth). General up/downside risks stem from healthcare reform and macros. Companyspecific up-/downside risks relate to the integration of Sigma Aldrich, less/more competition for key pharma products (Rebif, Erbitux) and/or in liquid crystals/ OLED (e.g. from new disruptive technologies). Additionally, we see risks related to execution on cost, pharma pipeline success/failures, emerging markets, and FX.
Morphosys (Buy, TP: EUR 130)
We value MorphoSys on a DCF model as we believe this best mirrors the longterm visible growth profile and value creation potential of its partnered and proprietary pipeline as well as other assets. We assume a WACC of 9% (rfr 4%, erp 5%, beta 1) and a forecast horizon until 2036 (no terminal growth thereafter). We attribute risk-adjusted fair valuations per share for marketed and late-stage partnered programs, the Novartis and other collaborations, for MOR103, MOR106, MOR202 (incl. the patent case), and MOR208; we add net cash per share and take a neutral view on other (earlier) stage proprietary pipeline programs. Key downside risks to the investment case and our forecasts include setbacks with regard to Tremfya, clinical MOR programs, and late-stage partnered programs as well as pipeline failures beyond historical attrition rates in antibody drug development, longer-than-expected development cycles, and peak sales short of our estimates. Besides limited predictability of success-based payments from partners, there is additional uncertainty about proprietary pipeline spent and the use of cash (M&AA/in-licensing) and hence the development of earnings in the near to mid-term. Sentiment may su er from negative pipeline data and investors' perception of biotech stocks more generally.
Polyphor (Buy, TP: CHF 78)
Our Price Target is derived using risk-adjusted NPV. We use a cost of capital of 11.8% based on a risk-free rate of 3.5%, an equity risk premium of 5.5% and a beta of 1.5. We believe this is a good proxy for an industry beta for loss making biotech companies. The main risks to this reflect timely execution and success of clinical trials of murepavadin and delivery on its commercial potential. As a pathogen-specific antibiotic, its development raises unique challenges. Our forecasts are also partly dependent on the use of newly emerging rapid diagnostics becoming widespread. In addition, although the legislative and regulatory environment for antibiotic development is improving, these incentives
Deutsche Bank AG/London |
Page 77 |

vk.com/id446425943
10 December 2018 Pharmaceuticals European Pharmaceuticals
still fall short of guaranteeing attractive ROI given challenging reimbursement for new antibiotics.
SOBI (Buy, TP: SEK 245)
Our price target is based on the average of our DCF analysis with a 2% TGR (line with our industry average) and a WACC of 8.5% (based on a beta of 0.9, ERP of 5.5%, and RFR of 3.5% based on long-term government bond yields). Key risks include a weaker switch to long-acting clotting factors, greater competition from new hemophilia therapies and disappointing sales of Gamifant.
UCB (Buy, TP: EUR 95)
Our target price is based on our DCF analysis (WACC 8.1%; beta 0.9; ERP 5.5%; and a terminal growth rate of 2%, in line with our industry average). Downside risks include commercial execution on CVN, romosozumab approvability, pricing and market share pressure on Cimzia from biosimilars and new drug classes, as well as success/failure of key pipeline programmes.
Vifor Pharma (Hold, TP: CHF 135)
We value Vifor Pharma based on DCF as we believe this best mirrors the company's longer-term growth profile and value creation potential of its current portfolio and pipeline. Key assumptions to our DCF include a WACC of 8% (based on levered beta of 1, risk-free rate of 4%, and equity risk premium of 5.5% - in line with DB's European health care coverage) and terminal growth of 2% (in line with long-term GDP growth). We have also checked against sector multiples and conclude that the current premium over peers looks about right against the theoretical earnings power of the company and scope for above sector growth in the longer term. General up-/downside risks stem from health care reform, regulation, and reimbursement. The main company specific up-/downside risks, in our view, relate to stronger/weaker uptake and less/more competition for key products Ferinject and Veltassa, less/more cost related to the integration of Relypsa, less/more investment requirements to exploit the potential of the current portfolio, pipeline progress/setbacks, value accretive/destructive M&A, and FX.
Page 78 |
Deutsche Bank AG/London |
vk.com/id446425943
Bank Deutsche |
Appendix C - Drug pricing: more of the same in |
|||||
competitive classes |
|
|
|
|||
AG/London |
|
|
|
|
|
|
Increasing pressure on US drug pricing in competitive categories appears here to stay |
||||||
|
||||||
|
■ |
Consolidation amongst US payors, slowing patent expiries and increasing new approvals are putting pressure on drug budgets. As a result, payors |
||||
|
|
have been increasing use of formulary exclusions and exclusive contracts to control cost inflation, particularly in the commercial (50-60% of sector |
||||
|
|
profits) and Medicare Part D segments. This has led to increased pressure in categories with multiple competitors and low therapeutic di erentiation. |
||||
|
■ |
Investors should be cognizant of a company's reliance on competitive primary care areas with limited innovation (respiratory, CV, diabetes etc). |
||||
|
|
However, these pressures are now largely reflected in share prices. Companies able to innovate in areas of low competitive intensity and high unmet |
||||
|
|
need should maintain pricing power. We continue to believe investors must focus on companies with clinically di erentiated product o erings and |
||||
|
|
those with broad portfolios in specific therapeutic categories enabling negotiating power with payors. |
||||
|
■ |
US drug spend growth has moderated, easing pressure on drug budgets. US drug spend growth slowed again in 2017 to less than 1%, after reaching |
||||
|
|
close to double digits in 2014 and 2015. Although this should limit pressure on payors, the continued divergence of gross and net prices remains a |
||||
|
|
political focus and could result in actions to reform or eliminate the rebate system. |
||||
|
■ |
Further deterioration in environment not expected in 2019. Although price pressures in competitive drug categories is the "new normal", initial |
||||
|
|
signals suggest a further dramatic deterioration in 2019 in key categories a ecting our universe is unlikely. |
||||
|
|
|
|
|
||
|
Figure 139 : Consolidation of US payor power. 81% of commercial |
|
Figure 140 : Slowdown in total drug spend increases in the US market |
|||
|
purchasing power, covering >230m lives, now in the hands of three |
|
|
|
||
|
companies |
|
|
|
||
|
MedImpact |
Other |
|
500 |
20% |
|
|
5% |
|
|
|||
Humana |
3% |
|
|
|
|
|
|
|
|
|
|
||
|
|
|
|
|
|
|
3% |
|
|
|
450 |
15% |
|
|
|
|
|
|
||
Prime |
|
CVS Caremark |
Spending($bn) |
400 |
10% |
changeAnnual(%) |
8% |
|
31% |
||||
|
|
|
350 |
5% |
||
|
|
|
|
|
||
|
|
|
|
300 |
0% |
|
OptumRx |
|
|
|
250 |
-5% |
|
|
|
|
|
|
|
|
22% |
|
|
|
|
|
|
|
|
|
|
200 |
-10% |
|
|
|
|
|
2007A 2008A 2009A 2010A 2011A 2012A 2013A 2014A 2015A 2016A 2017A |
|
|
|
|
Express Scripts |
|
Net Spending $bn (lhs) |
Gross to Net Discount $bn (lhs) |
|
|
|
28% |
|
Invoice Spending Growth % (rhs) |
Net Spending Growth % (rhs) |
|
|
|
|
|
|
||
79Page |
Source: Novo Nordisk |
|
Source: IQVIA, National Sales Perspectives, Dec 2016; IQVIA Institute of Human Data Science |
|
|
|
|
||||
|
|
|
|
|
|
2018 December 10 Pharmaceuticals Pharmaceuticals European

vk.com/id446425943
10 December 2018 Pharmaceuticals European Pharmaceuticals
Appendix 1
Important Disclosures
*Other information available upon request
*Prices are current as of the end of the previous trading session unless otherwise indicated and are sourced from local exchanges via Reuters, Bloomberg and other vendors . Other information is sourced from Deutsche Bank, subject companies, and other sources. For disclosures pertaining to recommendations or estimates made on securities other than the primary subject of this research, please see the most recently published company report or visit our global disclosure look-up page on our website at https://research.db.com/Research/Disclosures/CompanySearch. Aside from within this report, important risk and conflict disclosures can also be found at https://research.db.com/Research/Topics/Equities? topicId=RB0002. Investors are strongly encouraged to review this information before investing.
Analyst Certification
The views expressed in this report accurately reflect the personal views of the undersigned lead analyst about the subject issuers and the securities of those issuers. In addition, the undersigned lead analyst has not and will not receive any compensation for providing a specific recommendation or view in this report. Tim Race, Richard Parkes, Gunnar Romer, Falko Friedrichs
Equity Rating Key |
Equity rating dispersion and banking relationships |
Buy: Based on a current 12month view of total share-holder |
|
return (TSR = percentage change in share price from current |
|
price to projected target price plus pro-jected dividend yield ) , |
|
we recommend that investors buy the stock. |
|
Sell: Based on a current 12-month view of total share-holder |
|
return, we recommend that investors sell the stock. |
|
Hold: We take a neutral view on the stock 12-months out and, |
|
based on this time horizon, do not recommend either a Buy |
|
or Sell. |
|
Newly issued research recommendations and target prices |
|
supersede previously published research. |
|
|
|
Page 80 |
Deutsche Bank AG/London |