

DB European Pharmaceuticals 2019 Outlook_watermark
.pdfvk.com/id446425943
Deutsche |
Summary model |
|
|
|
|
|
|
|
|
|
|
|
|
|
|
|
|
|
|
|
|
Figure 71 : Roche summary P&L |
|
|
|
|
|
|
|
|
|
|
Bank |
CHFm ex-per share data |
2016A |
2017A |
|
2018E |
2019E |
2020E |
2021E |
2022E |
2023E |
|
|
|||||||||
|
|
|
|
|
|
|
|
|
|
|
AG/London |
Sales |
50,576 |
53,299 |
56,894 |
59,086 |
59,671 |
60,657 |
59,855 |
60,155 |
|
Core operating profit |
18,420 |
19,012 |
20,632 |
21,239 |
21,435 |
21,944 |
21,108 |
20,752 |
||
|
Gross profit |
39,167 |
41,380 |
43,951 |
45,203 |
45,861 |
46,671 |
45,979 |
46,193 |
|
|
Margin % |
77% |
78% |
77% |
77% |
77% |
77% |
77% |
77% |
|
|
Margin % |
36% |
36% |
36% |
36% |
36% |
36% |
35% |
34% |
|
|
Core PBT |
17,423 |
18,268 |
19,938 |
20,595 |
20,805 |
21,357 |
20,534 |
20,190 |
|
|
Core net income |
12,688 |
13,404 |
15,845 |
16,334 |
16,475 |
16,891 |
16,213 |
15,938 |
|
|
To Roche |
12,507 |
13,192 |
15,522 |
15,904 |
15,967 |
16,317 |
15,577 |
15,290 |
|
|
Minority interests |
181 |
212 |
323 |
430 |
507 |
575 |
636 |
648 |
|
|
Diluted EPS |
14.53 |
15.32 |
18.00 |
18.43 |
18.51 |
18.91 |
18.06 |
17.73 |
|
|
% change |
8% |
5% |
17% |
2% |
0% |
2% |
-4% |
-2% |
|
|
Source: Deutsche Bank, Company data |
|
|
|
|
|
|
|
|
|
|
|
|
|
|
|
|
|
|
|
|
|
|
|
|
|
|
|||||
|
|
|
|
|
|
|||||
|
Figure 72 : Rebased change in 2019E consensus earnings forecasts |
|
Figure 73 : Sales and EPS growth 2016A-2023E |
|
|
|||||
|
1.10 |
|
|
|
|
|
|
|
|
|
|
70,000 |
|
|
|
|
|
|
|
20 |
|
change |
|
|
|
|
|
|
|
|
|
|
|
|
|
|
|
|
|
|
|
||
|
|
|
|
|
|
|
|
|
|
|
|
|
|
|
|
|
|
|
18 |
|
|
1.00 |
|
|
|
|
|
|
|
|
|
Revenue (CHFm) |
56,000 |
|
|
|
|
|
|
|
16 |
Core EPS (CHF) |
|
consensus EPS rebased |
|
|
|
|
|
|
|
|
|
|
|
|
|
|
24% |
|
|
||||
|
|
|
|
|
|
|
|
|
|
|
|
|
23% |
23% |
25% |
26% |
|
||||
|
|
|
|
|
|
|
|
|
|
|
|
23% |
|
|
|||||||
|
|
|
|
|
|
|
|
|
|
|
|
|
|
|
|
|
14 |
||||
|
|
|
|
|
|
|
|
|
|
|
23% |
|
|
|
|
|
|
||||
0.90 |
|
|
|
|
|
|
|
|
|
23% |
|
|
|
|
|
|
|
||||
|
|
|
|
|
|
|
|
|
|
|
|
|
|
|
|
12 |
|||||
|
|
|
|
|
|
|
|
|
|
42,000 |
|
|
|
|
|
|
|
||||
|
|
|
|
|
|
|
|
|
|
|
|
|
|
|
|
|
|
10 |
|||
0.80 |
|
|
|
|
|
|
|
|
|
28,000 |
|
|
|
|
|
|
|
8 |
|||
|
|
|
|
|
|
|
|
|
|
|
|
|
|
|
|
|
|||||
|
|
|
|
|
|
|
|
|
|
|
77% |
77% |
77% |
77% |
76% |
75% |
74% |
6 |
|||
|
|
|
|
|
|
|
|
|
|
77% |
|
|
|
||||||||
2020E |
0.70 |
|
|
|
|
|
|
|
|
|
|
|
|
|
|
|
|
|
|
|
|
|
|
|
|
|
|
|
|
|
|
|
|
|
|
|
|
|
|
|
|
||
|
|
|
|
|
|
|
|
|
|
|
14,000 |
|
|
|
|
|
|
|
4 |
|
|
|
|
|
|
|
|
|
|
|
|
|
|
|
|
|
|
|
|
|
2 |
|
|
|
0.60 |
|
|
|
|
|
|
|
|
|
|
|
|
|
|
|
|
|
|
|
|
|
|
|
|
|
|
|
|
|
|
|
|
|
|
|
|
|
|
|
|
|
|
|
Feb-15 |
Jul-15 |
Dec-15 |
May-16 |
Oct-16 |
Mar-17 |
Aug-17 |
Jan-18 |
Jun-18 |
Nov-18 |
|
- |
|
|
|
|
|
|
|
0 |
|
|
|
|
|
|
Roche |
|
|
|
|
|
|
2016A |
2017A |
2018E |
2019E |
2020E |
2021E |
2022E |
2023E |
|
|
|
|
|
|
|
|
|
|
|
|
|
|
Pharma |
Diagnostics |
|
Core EPS |
|
|
||||
|
|
|
|
|
|
|
|
|
|
|
|
|
|
|
|
||||||
Source: Deutsche Bank, Bloomberg Finance LP |
Source: Deutsche Bank, Company data |
|
|
|
|
41 Page
2018 December 10 Pharmaceuticals Pharmaceuticals European

vk.com/id446425943
Page |
Sanofi (Buy; PT €93) |
42 |
|
Not perfect but now on the road for consistent growth
■2019, most importantly, growing again. Sanofi now trades at a 5-10% discount to peers on PE. This has closed slightly from last year and reflects a return of investor confidence as the company's patent outflows ebb and new growth avenues kick-in. This pattern is set to continue through 2019 and over the mid-term. Sanofi o ers a stable healthcare investment, with a diversified product o ering through both therapy area, healthcare field and geography. It's becoming a go-to defensive in our view. In 2019, we expect continued solid quarterly growth comparisons in 1H. These will progressively get tougher in 2H but we still expect solid full year growth. Overall, the simplified equity story for Sanofi should continue to allow investors to see the shares as significantly more investable than in the past.
■Dupixent continues to be the driver. Sanofi's predominant source of growth is the allergy drug Dupixent, which we expect can generate over €6bn of peak revenues shared between Sanofi and Regeneron. We believe the drug will contribute to over two third's of Sanofi's operating profit growth in the coming five years and represents the di erence between tepid growth and robust mid to high single digit growth of over the period. Given this, following the prescription trends of the drug will remain critical to sentiment, as will the potential emergence of new competitors overt the longer term (eg. JAK1's).
|
Figure 74 : Bull/Bear case valuation (EUR/share) |
|
|
|
|
Figure 75 : PE Company vs. EU Pharma – 1 yr FWD PE |
|
|
|||||||||||||
|
|
110 |
|
|
|
|
|
|
|
|
|
5 |
105 |
|
1.1x |
|
|
|
Rel. PE |
|
|
|
|
|
|
|
|
|
|
|
|
|
|
|
|
|
|
|
|
|
|||
|
|
105 |
|
|
|
|
|
|
|
|
|
|
|
|
|
|
|
|
10yr Ave |
|
|
|
|
|
|
|
|
|
|
|
|
|
|
|
|
|
|
|
|
+/- 1 s.d. |
|
|
|
|
|
|
|
|
|
|
|
|
|
|
1 |
|
|
|
|
|
|
|
|
|
|
|
|
|
|
|
|
|
|
|
|
1 |
|
|
|
1.0x |
|
|
|
|
|
|
|
|
priceShare(€) |
100 |
|
|
|
|
|
3 |
1 |
|
|
|
|
|
|
|
|
|
|
|
|
|
|
|
|
|
|
|
|
|
|
1yr(x),sectorfwd |
|
|
|
|
|
|
|
||||
|
|
|
|
6 |
1 |
93 |
|
|
|
|
|
|
|
|
|
|
|
|
|
||
|
95 |
|
|
|
|
|
|
|
|
|
0.9x |
|
|
|
|
|
|
||||
|
|
|
|
|
|
|
|
|
|
|
|
|
|
|
|
|
|
||||
|
|
|
|
|
|
|
|
|
|
|
|
|
|
|
|
|
|
|
|
||
|
|
90 |
86 |
1 |
|
|
|
|
|
|
|
|
|
|
|
|
|
|
|
|
|
|
|
|
|
|
|
|
|
|
|
|
|
|
|
|
|
|
|
|
|
|
|
|
|
|
|
|
|
|
|
|
|
|
|
|
|
|
0.8x |
|
|
|
|
|
|
|
|
85 |
|
|
|
|
|
|
|
|
|
|
|
rel. to |
|
|
|
|
|
|
|
|
|
80 |
|
|
|
|
|
|
|
|
|
|
|
0.7x |
|
|
|
|
|
|
|
|
|
|
|
|
|
|
|
|
|
|
|
|
PE |
|
|
|
|
|
|
||
|
|
|
|
|
|
|
|
|
|
|
|
|
|
|
|
|
|
|
|
||
|
|
|
|
|
|
|
|
|
|
|
|
|
|
|
|
|
|
|
|
|
|
Deutsche |
|
75 |
Bear |
failsisatuximab |
disruptJAK1's market:eczema… |
AsthmaDupixent €1bn |
Base |
asthmaDupixent €3bn |
isatuximab (peakdifferentiated… |
generatesLibtayo $1bn |
€1bnCablivi |
€savigncost1bn programme |
Bull |
|
|
|
|
|
|
|
|
|
|
|
0.6x |
|
|
|
|
|
|
||||||||||||
|
|
|
|
|
|
|
|
|
|
|
|
|
|
|
|
|
|
|
|
|
|
|
|
|
|
|
|
|
|
|
|
|
|
|
|
|
0.5x |
|
|
|
|
|
|
|
|
|
|
|
|
|
|
|
|
|
|
|
|
|
Jan 09 |
Aug 10 |
Apr 12 |
Dec 13 |
Aug 15 |
Apr 17 |
Dec 18 |
AG/London Bank |
Source: Deutsche Bank estimates,* - current share price |
|
|
|
|
|
|
|
Source: Deutsche Bank, Factset |
|
|
|
|
|
|||||||
|
|
|
|
|
|
|
|
|
|
|
|
|
|
|
|
|
|
|
|
|
|
2018 December 10 Pharmaceuticals Pharmaceuticals European

vk.com/id446425943
Deutsche |
|
Focus for 2019 |
|
|
||
|
■ |
Dupixent uptake is key. Prescription data suggests Dupixent is on track to meet consensus 2019 sales expectations. However, given that the drug |
||||
|
|
|||||
Bank |
|
|
represent c.15% of our price target on NPV it is the single largest driver of sentiment to the stock. As such, weekly prescription data as well as |
|||
|
■ |
confirmatory quarterly sales figures will be key to follow. The recent FDA approval of Dupixent in asthma has resulted in a significant uptick in the lead |
||||
AG/London |
|
Hematology franchise in focus. Sanofi's acquired rare blood disease franchise needs to deliver. We expect solid growth of Elocate and Alprolix. |
||||
|
|
|
indicator 'new to brand prescriptions', which if translated to total prescriptions suggests consensus may need to reassess and upgrade its expectations |
|||
|
|
|
for asthma (currently representing <20% of total Dupixent sales expectations). |
|||
|
|
|
However, investor focus will likely be on the read-through of Roche's Hemlibra launch. Expectations are for a strong launch, there is still much |
|||
|
|
|
uncertainty as to the size of the initial bolus of patients that move on to Hemlibra and the ongoing switch rate from more traditional Factor VIII |
|||
|
|
|
therapies. Furthermore, uncertainty as to the switch from shorter acting sales (not Sanofi) vs the newer longer acting versions (Sanofi). O setting this |
|||
|
|
|
risk, we see the EU roll out of Cablivi and potential US approval (1Q19) as an o setting factor to these risks, in part. |
|||
|
|
■ |
Pipeline provides opportunity to beat modest expectations. We expect the FDA approval decision for Zynquista (type I diabetes) in March. We are |
|||
|
|
|
not convinced in this product (adverse events vs modest e ect) and believe sales could be limited. However, approval and solid uptake o ers upside |
|||
|
|
|
to our €280m forecast. We believe consensus is pricing in little for Sanofi's pipeline, it has two Phase III trial read-outs in 2019. First isatuximab in |
|||
|
|
|
refractory multiple myeloma (ICARIA study) is due to read out in 4Q18/1Q19. If positive investors may raise their limited expectations for this Darzalex |
|||
|
|
|
fast follower. We expect pivotal data from sutimlimab in Cold Agglutinin Disease (2H19, DBe €230m at peak); and data from fitusiran in 2H19 for |
|||
|
|
|
haemophilia with and without inhibitors (DBe €0, due to concerns on safety profile). |
|||
|
|
|
|
|
||
|
|
Key news flow |
|
|
||
|
|
|
|
|
||
|
|
Figure 76 : Potential news flow |
|
|
||
|
|
Timing |
|
Event |
Description |
|
|
|
4Q18/1Q19 |
isatuximab |
Data from Phase III (ICARIA) trial in r/r multiple myeloma (PomDex combination) |
||
|
|
4Q18 |
|
Fluzone |
Phase III data in influenza prevention |
|
|
|
17-Jan-19 |
sotagliflozin (Zynquista) |
FDA advisory committee meeting for type 1 diabetes |
||
|
|
1Q19 |
|
isatuximab |
Planned FDA filing in r/rMM |
|
|
|
1Q19 |
|
Cablivi (caplacizumab) |
FDA approval decision in acquired Thrombotic Thrombocytopenic Purpura (aTTP) |
|
|
|
1Q19 |
|
Dupixent |
Expected filing in nasal polyposis |
|
|
|
1Q19 |
|
SAR341402 (rapid-acting insulin) |
Primary completion of Phase III trial vs NovoLog |
|
|
|
1Q19 |
|
sotagliflozin (Zynquista) |
Primary completion of Phase III trial in type 2 diabetes with background metformin |
|
|
|
1Q19 |
|
Dupixent (competitor) |
Primary completion of Phase III trial of oral JAK kinase (PF-04965842) in AD |
|
|
|
1Q19 |
|
cemiplimab (PD-1) |
CHMP decision expected in CSCC |
|
|
|
1Q19 |
|
sotagliflozin (Zynquista) |
CHMP decision expected in type 1 diabetes |
|
|
|
1Q19 |
|
Dupixent |
Potential approval in adolescent AD |
|
|
|
22-Mar-19 |
sotagliflozin (Zynquista) |
PDUFA in type 1 diabetes |
||
|
|
28-Apr-19 |
Praluent |
ODYSSEY OUTCOMES PDUFA date |
||
|
|
2Q19 |
|
MenQuadTT |
Planned US submission |
|
|
|
Jun-19 |
|
Fitusiran |
Primary completion of Phase III inhibtiors trial (A&B) |
|
|
|
Nov-19 |
|
Fitusiran |
Primary completion of Phase III non-inhibitors trial |
|
|
|
2H19 |
|
SAR566658 |
Data from Phase II trial (ORR) in triple negative mBC |
|
43Page |
2019 |
|
Fitusiran |
Expected regulatory filings |
||
|
Source: Deutsche Bank, Company data |
|
|
|||
|
|
|
||||
|
|
|
|
|
|
|
|
|
|
|
|
|
|
2018 December 10 Pharmaceuticals Pharmaceuticals European

vk.com/id446425943
44 Page |
Summary model |
|
|
|
|
|
|
|
|
|
|
|
|
|
|
|
|
|
|
|
|
Figure 77 : Sanofi summary P&L |
|
|
|
|
|
|
|
|
|
|
|
|
|
|
|
|
|
|
|
|
|
|
€m (EPS €) |
2016A |
2017A |
|
2018E |
2019E |
2020E |
2021E |
2022E |
2023E |
|
|
|
|
|
|
|
|
|
|
|
|
Net sales |
33,821 |
35,072 |
34,495 |
36,323 |
38,368 |
40,881 |
43,543 |
44,297 |
|
|
Gross profit |
24,006 |
24,774 |
24,327 |
26,035 |
27,599 |
29,503 |
31,514 |
32,109 |
|
|
as % net sales |
71% |
71% |
71% |
72% |
72% |
72% |
72% |
72% |
|
|
Share of profits/loss of associates |
177 |
214 |
404 |
409 |
457 |
525 |
551 |
579 |
|
|
Business operating income |
9,285 |
9,323 |
8,979 |
9,400 |
10,014 |
11,006 |
12,127 |
12,110 |
|
|
as % net sales |
27% |
27% |
26% |
26% |
26% |
27% |
28% |
27% |
|
|
Income tax expense |
(2,054) |
(2,106) |
(1,802) |
(1,899) |
(2,028) |
(2,236) |
(2,482) |
(2,478) |
|
|
Tax rate |
23% |
24% |
22% |
22% |
22% |
22% |
22% |
22% |
|
|
Business net income |
6,832 |
6,943 |
6,867 |
7,077 |
7,592 |
8,406 |
9,312 |
9,331 |
|
|
as % net sales |
20% |
20% |
20% |
19% |
20% |
21% |
21% |
21% |
|
|
Business EPS |
5.68 |
5.52 |
5.50 |
5.69 |
6.13 |
6.82 |
7.58 |
7.62 |
|
|
yoy ch % |
1% |
-3% |
0% |
3% |
8% |
11% |
11% |
1% |
|
|
Source: Deutsche Bank, Company data |
|
|
|
|
|
|
|
|
|
|
|
|
|
|
|
|
|
|
|
|
|
|
|
|
|
|
|||||
|
|
|
|
|
|
|||||
|
Figure 78 : Rebased change in 2019E consensus earnings forecasts |
|
Figure 79 : Sales and EPS growth 2016A-2023E |
|
|
|||||
|
|
|
|
|
|
|
|
|
|
|
|
|
1.10 |
|
|
|
|
|
|
|
|
|
|
50,000 |
|
|
|
|
|
|
|
9 |
|
|
change |
|
|
|
|
|
|
|
|
|
|
|
|
|
|
|
|
|
|
|
||
|
1.00 |
|
|
|
|
|
|
|
|
|
|
45,000 |
|
|
|
|
|
|
13% |
8 |
|
|
|
|
|
|
|
|
|
|
|
|
|
|
|
|
|
|
|
|
|
|
|
|
|
|
rebasedEPSconsensus |
|
|
|
|
|
|
|
|
|
|
|
40,000 |
|
|
|
|
|
13% |
|
7 |
|
|
|
|
|
|
|
|
|
|
|
|
|
|
|
|
|
|
|
|
(EUR)EPSSSEINSUB |
|||
|
|
|
|
|
|
|
|
|
|
|
)(EURRMEUNEVE |
15,000 |
|
|
|
|
72% |
|
|
|||
|
|
|
|
|
|
|
|
|
|
|
|
|
|
|
|
|
|
13% |
|
|
|
|
|
|
|
|
|
|
|
|
|
|
|
|
|
35,000 |
|
|
|
13% |
|
15% |
15% |
|
|
|
|
|
|
|
|
|
|
|
|
|
|
|
|
|
13% |
|
|
6 |
|
|||
|
|
0.90 |
|
|
|
|
|
|
|
|
|
|
10% |
14% |
14% |
|
15% |
|
|
|
||
|
|
|
|
|
|
|
|
|
|
|
|
|
15% |
|
|
|
|
|||||
|
|
|
|
|
|
|
|
|
|
|
|
|
30,000 |
|
|
15% |
|
|
|
|
|
|
|
|
|
|
|
|
|
|
|
|
|
|
|
14% |
15% |
15% |
|
|
|
|
5 |
|
|
|
|
|
|
|
|
|
|
|
|
|
|
|
|
|
|
|
|
|
||||
|
|
|
|
|
|
|
|
|
|
|
|
|
25,000 |
|
|
|
|
|
|
|
|
|
|
|
0.80 |
|
|
|
|
|
|
|
|
|
|
|
|
|
|
|
|
|
|
4 |
|
|
|
|
|
|
|
|
|
|
|
|
|
|
20,000 |
|
|
|
|
|
|
|
|
|
|
|
|
|
|
|
|
|
|
|
|
|
|
|
|
|
|
|
|
73% |
72% |
3 |
|
|
|
|
|
|
|
|
|
|
|
|
|
|
|
|
|
|
|
|
|
|
||
|
2020E |
0.70 |
|
|
|
|
|
|
|
|
|
|
77% |
72% |
72% |
72% |
72% |
|
|
|
|
|
|
|
|
|
|
|
|
|
|
|
|
|
|
|
|
2 |
|
||||||
|
|
|
|
|
|
|
|
|
|
|
|
10,000 |
|
|
|
|
|
|
|
|
||
|
|
|
|
|
|
|
|
|
|
|
|
|
|
|
|
|
|
|
|
|
|
|
|
|
0.60 |
|
|
|
|
|
|
|
|
|
|
5,000 |
|
|
|
|
|
|
|
1 |
|
|
|
|
|
|
|
|
|
|
|
|
|
|
|
|
|
|
|
|
|
|
||
|
|
|
|
|
|
|
|
|
|
|
|
|
|
|
|
|
|
|
|
|
|
|
|
|
Feb-15 |
Jul-15 |
Dec-15 |
May-16 |
Oct-16 |
Mar-17 |
Aug-17 |
Jan-18 |
Jun-18 |
Nov-18 |
|
0 |
|
|
|
|
|
|
|
0 |
|
Deutsche |
Source: Deutsche Bank, Bloomberg Finance LP |
|
Sanofi |
|
|
|
|
|
|
2016A |
2017A |
2018E |
2019E |
2020E |
2021E |
2022E |
2023E |
|
|
|||
|
|
|
|
|
|
Source: Deutsche Bank, Company data |
|
|
|
|
|
|
|
|
||||||||
|
|
|
|
|
|
|
|
|
|
|
|
|
|
|
|
|
|
|
|
|
|
|
|
|
|
|
|
|
|
|
|
|
|
|
|
PHARMA |
|
VACCINES |
|
CONSUMER HEALTH |
|
BUSINESS EPS |
|
||
AG/London Bank |
|
|
|
|
|
|
|
|
|
|
|
|
|
|
|
|
|
|
|
|
|
|
2018 December 10 Pharmaceuticals Pharmaceuticals European

10 December 2018
Pharmaceuticals
European Pharmaceuticals
vk.com/id446425943
Deutsche Bank AG/London
Page 45

vk.com/id446425943
Page |
UCB (Upgrading to Buy; PT €95) |
46 |
|
Pipeline to drive return to LT growth
■We are upgrading our recommendation on UCB to Buy given our increased confidence that its pipeline can ultimately offset expected medium term pressures and return the company to growth. This confidence reflects our optimism over the blockbuster potential of FcRn inhibitor rozanolixizumab. This should become clearer to investors through 2019. We believe the drug's potential can help return the company to growth post its trough in 2022/23 as patents on Vimpat expire, with ~double digit EPS growth possible in best cases. We believe the shares 16x '19 PER reflects only modest value for the pipeline and undervalues the company's ability to leverage its balance sheet to drive growth.
■Sometimes its good not to recycle: rozanolixizumab competitive in potential $7bn market. Clinical data suggest FcRn inhibition is e ective in reducing pathogenic IgG levels and thus improving disease outcomes in various autoantibody driven autoimmune diseases. We believe the class could ultimately generate ~$7bn in sales if planned Phase II/III trials in immune thrombocytopenia (ITP), myasthenia gravis (MG) and chronic inflammatory demyelinating polyneuropathy (CIDP) report positively. UCB's rozanolixizumab is the most advanced subcut FcRn inhibitor in development. We believe publication of detailed data from its Phase II trial in MG due at the American Academy of Neurology in 2019 will reassure investors on its competitiveness in this potential multi-blockbuster class.
■Increasing PT to €95 (up from €75): Our revised DCF-based price target (WACC 8.1%) reflects increases to our revised pipeline forecasts which increase outer year EPS by up to ~30%. We see further upside based on pipeline de-risking, better Evenity label/sales and balance sheet deployment on M&A/business development. Downside risks include commercial execution on CVN, romosozumab approvability, pricing and market share pressure on Cimzia from biosimilars and new drug classes, as well as success/failure of key pipeline programmes.
|
Figure 80 : Bull/Bear case target price impact (Euro/share) |
Figure 81 : NPV valuation |
|
|
|
|
||||||
|
|
|
|
|
Rozanolixizumab |
NPV |
Phase |
Launch |
Peak sales |
Probability |
NPV (€m) |
NPV/Share |
|
|
|
|
Bimekizumab & |
|
|
|
(€m) |
|
|
(€) |
|
|
|
110 |
|
Bull case |
|
|
|
|
|
|||
|
|
|
rozanolixizumab |
|
|
|
|
|
|
|
||
|
|
|
|
Zyrtec |
Marketed |
Launched |
103.0 |
100% |
166.5 |
0.89 |
||
|
|
|
|
|
||||||||
|
|
105 |
|
approved |
|
Xyzal |
Marketed |
Launched |
104.0 |
100% |
122.2 |
0.65 |
|
|
100 |
|
Rozanolixizumab fails |
|
Cimzia |
Marketed |
Launched |
1,559.7 |
100% |
5,018.8 |
26.70 |
|
/share) |
|
|
|
Keppra |
Marketed |
Launched |
782.3 |
100% |
1,450.6 |
7.72 |
|
|
|
|
|
|
||||||||
|
|
95 |
Bimekizumab & |
|
|
Nootropil |
Marketed |
Launched |
44.0 |
100% |
51.7 |
0.27 |
|
(€ |
90 |
pipeline fails |
|
|
Neupro |
Marketed |
Launched |
319.8 |
100% |
561.9 |
2.99 |
|
|
|
|
Vimpat |
Marketed |
Launched |
1,396.3 |
100% |
2,876.6 |
15.30 |
||
|
price |
|
|
|
|
|||||||
|
85 |
|
|
|
Brivaracetam |
Marketed |
Launched |
255.4 |
100% |
1,410.5 |
7.50 |
|
|
Share |
|
|
|
|
Other product sales |
Marketed |
Launched |
|
100% |
253.7 |
1.35 |
|
80 |
|
|
|
Royalties |
Marketed |
Launched |
|
100% |
455.8 |
2.42 |
|
|
|
|
|
|
|
|
||||||
Deutsche |
|
75 |
|
|
|
Other revenue |
Marketed |
Launched |
|
100% |
359.2 |
1.91 |
|
|
|
|
|
|
|
|
|
|
|
||
|
|
|
|
|
Pharmaceutical NPV |
|
|
|
|
12,727.5 |
67.7 |
|
|
|
70 |
|
|
|
Romosozumab |
III |
2019 |
300.2 |
50% |
250.7 |
1.33 |
|
|
65 |
|
|
|
Bimekizumab |
III |
2021 |
1,200.0 |
70% |
1,387.3 |
7.38 |
|
|
|
|
|
|
|
|
|
|
|
|
|
|
|
|
|
|
|
Padsevonil |
II/III |
2022 |
525.5 |
30% |
565.6 |
3.01 |
Bank |
|
60 |
|
|
|
USL261 |
III |
2019 |
78.8 |
70% |
152.9 |
0.81 |
|
|
Bear case |
Base case |
Bull case |
Rozanolixizumab |
III |
2022 |
1,005.3 |
60% |
1,351.8 |
7.19 |
|
|
|
|
|
|
Tecnology value |
|
|
|
|
851.1 |
4.53 |
|
AG/London |
|
|
|
|
|
Pipeline NPV |
|
|
|
|
4,559.4 |
24.3 |
|
|
|
|
|
|
Net cash (debt) |
|
|
|
|
530.8 |
2.82 |
|
|
|
|
|
|
Total |
|
|
|
|
17,817.8 |
94.8 |
|
Source: Deutsche Bank |
|
|
Source: Deutsche Bank |
|
|
|
|
|
|
||
2018 December 10 Pharmaceuticals Pharmaceuticals European

vk.com/id446425943
Deutsche |
|
Support for change in recommendation |
|
|
||
|
■ |
16x '19 PE reflects limited pipeline value; optionality to the upside. Given our assumptions for restrained EPS growth over 2018-22E, investors may |
||||
|
|
|||||
Bank |
|
|
not feel UCB's shares look undervalued relative to large pharma peers (Large cap pharma = 16x 2019 PE for an 7% CAGR). However, we note that |
|||
|
■ |
UCB's currently high R&D spend (~27% vs 19% peers) masks its underlying profitability. Normalising this spend to peer group average would put the |
||||
AG/London |
|
Rozanolixizumab data at American Academy of Neurology should reassure over blockbuster potential. Enthusiasm for potential of the FcRn |
||||
|
|
|
shares on 12x PE, a >20% discount to large cap pharma. This is supported by our NPV analysis which underpins the shares at €68/share excluding |
|||
|
|
|
any pipeline value. |
|
|
|
|
|
|
class has been driven by initial evidence of clinical e cacy from proof-of-concept trials of both UCB's rozanolixizumab and competitor Argenx's |
|||
|
|
|
efgartigimod in ITP and MG. However, data from UCB's MG trial has left uncertainties over its competitiveness, given incidence of headache and |
|||
|
|
|
seemingly less impressive response rates. We expect concerns over the competitiveness of its e cacy to be largely addressed when full detail of the |
|||
|
|
|
data is published at the AAN meeting, with reported di erences largely reflecting trial design di erences. In addition, we do not believe the incidence |
|||
|
|
|
of headache will be a major disadvantage. This has not been limiting to treatment and should be manageable with premedication. We now include |
|||
|
|
|
~€1bn in peak sales at a 60% probability in our model. |
|||
|
|
■ |
Bimekizumab Phase III data in 4Q19 should be impressive; Evenity approval almost all upside to expectations. In addition to publication of data |
|||
|
|
|
from Phase II trials of rozanolixizumab, we expect UCB to report first Phase III data for bimekizumab in psoriasis in 4Q19. These will include head-to- |
|||
|
|
|
head trials with Humira and Stelara (and with Cosentyx due in 1H20). Given impressive Phase II data, we expect trials to show at least non-inferior |
|||
|
|
|
and potentially superior e cacy to market leader Cosentyx. Although the drug's late entrance will limit the sales opportunity, this remains significant |
|||
|
|
|
and could exceed expectations if the Trump administrations plans to reduce rebates helps unlock the market opportunity. We see a possible approval |
|||
|
|
|
of Evenity for osteoporosis during 2019, as almost entirely upside given very low market expectations. We include only €300m of sales at a 50% |
|||
|
|
|
probability (1% of NPV). |
|
|
|
|
|
|
|
|
||
|
|
Figure 82 : Potential news flow |
|
|
||
|
|
Timing |
Event |
Description |
|
|
|
2019 |
|
Rozanolixizumab (FcRn inhibitor) |
Results from Phase II trial in ITP (higher dose) |
||
|
|
1Q19 |
|
Rozanolixizumab (FcRn inhibitor) |
Initiate Phase II trial in CIDP |
|
|
|
1Q19 |
|
Romosozumab |
Expected CHMP decision on filing |
|
|
|
1Q19 |
|
midazolam nasal spray |
Expected FDA decision |
|
|
|
Mar-19 |
Neupro |
First US method of use patent expires |
||
|
|
2Q19 |
|
Rozanolixizumab (FcRn inhibitor) |
Publication of results from Phase II trial in myasthenia gravis |
|
|
|
2Q19 |
|
Romosozumab (Evenity) |
Expected FDA decision in osteoporosis |
|
|
2019 |
|
Cimzia |
Decision on FDA filing for non-radiographic axial spondyloarthritis |
||
|
|
2H19 |
|
Rozanolixizumab (FcRn inhibitor) |
Initiate pivotal trial in myasthenia gravis |
|
|
|
2H19 |
|
Rozanolixizumab (FcRn inhibitor) |
Initiate pivotal trial in ITP |
|
|
|
4Q19 |
|
Bimekizumab (UCB4940) |
Data from Phase III BE READY trial in psoriasis (placebo controlled) |
|
|
|
4Q19 |
|
Bimekizumab (UCB4940) |
Data from BE SURE head-to-head trial vs Humira in psoriasis |
|
|
|
4Q19 |
|
Bimekizumab (UCB4940) |
Data from BE VIVID head-to-head trial vs Stelara in psoriasis |
|
|
|
Source: Deutsche Bank |
|
|
|
|
|
|
|
|
|
||
47 Page |
|
|
|
|
|
|
|
|
|
|
|
|
|
2018 December 10 Pharmaceuticals Pharmaceuticals European
vk.com/id446425943
48 Page |
|
Summary model |
|
|
|
|
Figure 83 : UCB summary P&L |
|
|
|
|
|
|
|
|
||
|
|
|
|
|
|
|
|
EURm ex-per share |
|
2016A |
2017A |
|
|
Total revenue |
|
4,147 |
4,530 |
|
|
Gross profit |
|
2,945 |
3,330 |
|
|
Gross margin |
|
71% |
74% |
|
|
Total operating costs |
|
(2,149) |
(2,200) |
|
|
Recurring EBITDA |
|
1,031 |
1,375 |
|
|
EBITDA margin |
|
25% |
30% |
|
|
Non-recurring inc/(exp) |
|
80 |
(43) |
|
|
EBIT |
|
876 |
1,087 |
|
|
Net interest |
|
(112) |
(99) |
|
|
Pre-tax profit |
|
764 |
988 |
|
|
Taxation |
|
(199) |
(218) |
|
|
Net profit |
|
542 |
771 |
|
|
EPS |
|
2.76 |
4.01 |
|
|
Core EPS |
|
3.19 |
4.82 |
|
|
|
|
|
|
|
|
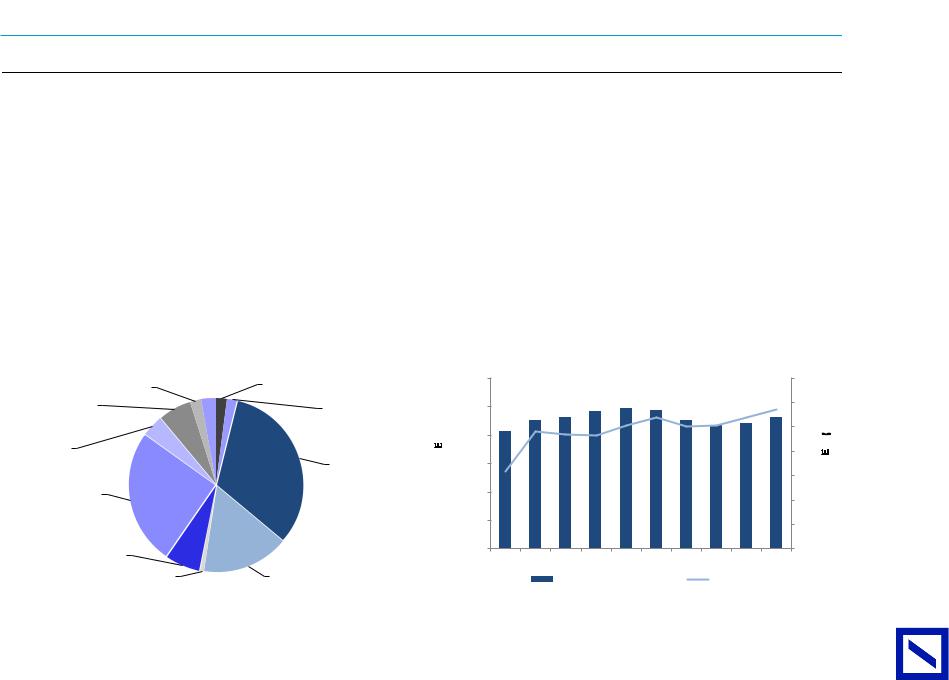
Figure 84 : 2019E revenue split |
|
|
|
|
|
|
Other revenue |
Zyrtec |
|
|
|
Royalties |
3% |
|
|
|
|
2% |
|
||
|
2% |
|
|
||
|
|
Other |
|
|
Xyzal |
|
6% |
|
|
||
|
|
|
2% |
||
|
|
|
|
|
|
|
|
Brivaracetam |
|
|
|
|
4% |
|
|
|
|
|
|
|
|
|
Cimzia |
|
|
|
|
|
32% |
|
|
Vimpat |
|
|
|
|
25% |
|
|
|
|
Deutsche |
|
Neupro |
|
|
|
|
|
|
|
|
|
|
7% |
|
|
|
|
|
|
Nootropil |
|
Keppra |
|
|
1% |
|
16% |
|
|
AG/London Bank |
|
Source: Deutsche Bank |
|
|
|
|
|
|
|
||
|
|
|
|
|
|
|
|
|
|
|
|
2018E |
2019E |
2020E |
2021E |
2022E |
2023E |
4,631 |
4,842 |
4,925 |
4,854 |
4,524 |
4,349 |
3,431 |
3,654 |
3,737 |
3,715 |
3,459 |
3,410 |
74% |
75% |
76% |
77% |
76% |
78% |
(2,341) |
(2,557) |
(2,581) |
(2,481) |
(2,321) |
(2,190) |
1,366 |
1,374 |
1,434 |
1,514 |
1,421 |
1,429 |
29% |
28% |
29% |
31% |
31% |
33% |
19 |
0 |
0 |
0 |
0 |
0 |
1,110 |
1,097 |
1,156 |
1,234 |
1,139 |
1,220 |
(92) |
(86) |
(69) |
(63) |
(59) |
(56) |
1,018 |
1,011 |
1,086 |
1,171 |
1,080 |
1,164 |
(214) |
(222) |
(239) |
(258) |
(238) |
(256) |
805 |
789 |
847 |
913 |
842 |
908 |
4.18 |
4.12 |
4.51 |
4.86 |
4.48 |
4.83 |
4.71 |
4.65 |
5.04 |
5.39 |
5.01 |
5.04 |
Figure 85 : Sales and EPS growth 2016A-2025E |
|
|
|
|
6,000 |
7 |
|
|
5,000 |
6 |
|
EURE M |
|
EPS(EUR) |
|
|
4 |
||
|
|
5 |
|
|
4,000 |
|
|
NEVEU |
3,000 |
|
OCRE |
|
|
3 |
|
R |
|
|
|
|
2,000 |
|
|
|
|
2 |
|
|
1,000 |
1 |
|
|
|
|
|
|
- |
0 |
|
|
2016A 2017A 2018E 2019E 2020E 2021E 2022E 2023E 2024E 2025E |
|
|
|
REVENUE |
CORE EPS |
|
Source: Deutsche Bank, Company data |
|
|
|
2018 December 10 Pharmaceuticals Pharmaceuticals European

vk.com/id446425943
Bank Deutsche |
Genmab (Upgrading to Buy; PT DKK1,250) |
||||
|
|
|
|||
Shares well underpinned by Darzalex base case; pipeline maturing |
|||||
AG/London |
|
sales of the drug ultimately exceed ~$7bn, fully underpinning the shares at current levels in our view. Importantly, the company's exciting proprietary |
|||
|
■ |
We are upgrading Genmab's shares as we believe the current price is well underpinned by expected Darzalex cash flows and we see upside |
|||
|
|
as the company delivers on its growing clinical pipeline. We believe recent data from trials of Darzalex in 1L multiple myeloma should ensure that |
|||
|
|
pipeline will begin to mature in 2019 and we see potential for meaningful shareholder value creation in the coming years. |
|||
|
■ |
Impressive data from MAIA trial should ensure role for Darzalex in 1L multiple myeloma. Darzalex currently has a share of ~25% in 2L, ~30% in 3L |
|||
|
|
and 45% in 4L patient starts in the United States with this penetration reflecting a balance of e cacy profile partly o set by requirement for significant |
|||
|
|
infusion chair time. We expect approvals based on the MAIA 1L data (during 2019) and of the subcut formulation (during 2020) to ensure sales go on |
|||
|
|
to reach ultimately reach ~$7bn, with upside possible from longer treatment durations, repeat use and from additional indications. These cash-flows |
|||
|
|
underpin the shares at ~DKK980/share. We believe investor fears over a new waive of BCMA targeting approaches in multiple myeloma are overdone |
|||
|
|
as these approaches are unlikely to impact the 1L treatment paradigm for many years to come. |
|||
|
■ |
Exciting proprietary pipeline should begin to mature in 2019. We expect Genmab's proprietary clinical pipeline begin to mature in the coming 12 |
|||
|
|
months with first clinical e cacy data expected from trials of DuoBody CD3xCD20, HuMax-AXL-ADC and HexaBody DR5/DR5, as well as data from |
|||
|
|
trials of tisotumab vedotin in new tumour types. In addition, we expect results of Novartis' Phase III trials of subcut ofatumumab to report in 2H19. |
|||
|
|
Given the exceptional success of Roche's Ocrevus (2022E consensus = >$5bn), Genmab's double digit royalty could have considerable value (worth |
|||
|
|
DKK65 to the shares for each $1bn in peak sales). |
|
|
|
|
|
|
|
|
|
|
Figure 86 : Bull/Bear case target price impact (DKK/share) |
|
Figure 87 : NPV valuation |
||
|
|
|
|
|
|
|
|
|
|
|
|
|
Peak sales |
|
Risk-adj |
Risk-adj |
NPV/Share |
|
|
2,000 |
|
|
Product |
Phase |
Launch |
($m) |
Probability |
NPV ($m) |
NPV (DKKm) |
(DKK) |
% of total |
|
|
|
Darzalex (relapsed/refractory MM) |
Marketed |
2016 |
3,412 |
100% |
3,627 |
23,927 |
388 |
31% |
|
|
|
|
|
|||||||||
|
|
38 |
1,558 |
Darzalex (1st-line MM) |
III |
2018 |
3,766 |
100% |
3,773 |
24,892 |
404 |
32% |
|
|
Core business NPV |
|
|
|
|
7,400 |
48,819 |
|
|
||
|
|
|
|
Subcut ofatumumab (MS) |
III |
2020 |
1,500 |
70% |
836 |
5,513 |
89 |
7% |
(DKK) |
|
263 |
|
Darzalex (new indications) |
III |
2021 |
425 |
70% |
558 |
3,681 |
60 |
5% |
|
|
Tisotumab vedotin (TF) |
II |
2022 |
393 |
60% |
265 |
1,751 |
28 |
2% |
||
|
|
|
||||||||||
|
1,500 |
|
|
Teprotumumab |
III |
2021 |
300 |
50% |
54 |
355 |
6 |
0% |
|
|
|
|
Technology value & partnerships |
|
|
|
100% |
1,380 |
9,108 |
148 |
12% |
price |
331 |
1,257 |
|
Pipeline NPV |
|
|
|
|
3,093 |
20,408 |
|
|
|
|
|
Total Product NPV |
|
|
|
|
10,493 |
69,227 |
1,123 |
|
|
|
|
|
|
Net cash (debt) |
|
|
|
100% |
1,235 |
8,149 |
134 |
11% |
Share |
263 |
|
|
DCF |
|
|
|
|
11,589 |
76,456 |
1,257 |
100% |
|
|
|
|
|
|
|
|
|
|
|
||
1,000 |
|
|
|
|
|
|
|
|
|
|
|
|
|
|
|
|
|
|
|
|
|
|
|
|
|
|
663 |
|
|
|
|
|
|
|
|
|
|
|
|
500 |
|
|
|
|
|
|
|
|
|
|
|
|
Bear |
Lower |
Pipeline |
Base Darzalex |
Subcut |
Bull |
|||
|
|
Darzalex |
failure |
upside* |
ofa +ve |
|
|
|
|
|
|
sales* |
|
|
|
|
|
|
|
49 Page |
Source: Deutsche Bank; * Darzalex scenarios = +/- $2bn in sales |
|
|
|
Source: Deutsche Bank |
|
|||
|
|
|
|
||||||
|
|
|
|
|
|
|
|
|
|
|
|
|
|
|
|
|
|
|
|
2018 December 10 Pharmaceuticals Pharmaceuticals European

vk.com/id446425943
50 Page |
|
Support for change in recommendation |
|
|
||
|
■ |
Darzalex integration into 1L paradigm now clearer based on MAIA outcome. We believe Genmab should be able to guide to Darzalex sales of $2.8- |
||||
|
|
|||||
|
|
|
$3.0bn for 2019 depending on timing of 1L approvals. We believe consensus is broadly consistent with the upper end of this range and assumes 1L |
|||
|
|
|
approval in the US during 1H19. Most importantly, we believe recent clinical data supports a meaningful role of Darzalex in the 1L treatment paradigm |
|||
|
|
|
in multiple myeloma and this should ensure annual sales ultimately exceed $7bn. In addition to expected 1L approvals in 2019, approval and launch |
|||
|
|
|
of the subcutaneous formulation expected in 2020 should be key to this. |
|||
|
|
■ |
Potential for upside from the proprietary pipeline growing. Genmab's recent R&D update highlighted the extent to which its investments in next |
|||
|
|
|
generation antibody technologies is beginning to bare fruit. As a result, IND applications to begin clinical trials are expected for 3-5 new drugs next year, |
|||
|
|
|
including first DuoBody checkpoint inhibitors from its BioNtech collaboration targeting 4-1BB, PD1 and CD40. In addition, we expect first meaningful |
|||
|
|
|
clinical data from ongoing Phase I/II trials of the DuoBody CD3xCD20, HuMax-AXL-ADC and HexaBody DR5/DR5 programmes, as well as from |
|||
|
|
|
cohorts exploring tisotumab vedotin in tumour types outside of the initial cervical cancer setting being explored in an ongoing pivotal study. Promising |
|||
|
|
|
anecdotal clinical responses have been reported from several of these programmes. If durable these could suggest promising commercial potential. |
|||
|
|
■ |
Subcut ofatumumab de-risking could open up a meaningful revenue stream. In addition to progress of Genmab's proprietary pipeline, we expect |
|||
|
|
|
results of Novartis' Phase III trials of subcut CD20 antibody ofatumumab in relapsing remitting multiple sclerosis (RRMS) to report in 2H19. Given |
|||
|
|
|
the exceptional success of Roche's CD20 antibody Ocrevus in multiple sclerosis (2022E consensus = >$5bn), Genmab's double digit royalty could |
|||
|
|
|
have considerable value (worth DKK65 to the shares for each $1bn in peak sales). Although Novartis is not developing ofatumumab for the primary |
|||
|
|
|
progressive form of MS, the majority of Ocrevus use is being driven by starts in the RRMS indication (2/3rds of new starts as of 3Q). In addition, |
|||
|
|
|
ofatumumab has the advantage of subcutaneous dosing and potentially more rapidly reversible e ects, which could be a significant advantage in the |
|||
|
|
|
relapsing remitting MS setting where safety/convenience is of key importance. Results from the drug's Phase II trial demonstrated that the subcut |
|||
|
|
|
formulation could suppress the mean number of new T1 MRI lesions in the brains of MS patients by >90% which is comparable to that achieved with |
|||
|
|
|
Ocrevus. This suggests a high probability of positive outcome from the ongoing Phase III trials. |
|||
|
|
|
|
|
||
|
|
Figure 88 : Potential news flow |
|
|
||
|
|
Timing |
|
Drug |
Description |
|
|
|
Nov-18 |
|
JNJ-64007957 (DuoBody BCMA/CD3) |
Primary completion of Phase I dose finding study in r/r MM |
|
|
|
4Q18 |
|
Competition |
Results of isatuximab Phase III (ICARIA) trial in r/r multiple myeloma (double refractory) |
|
|
|
4Q18 |
|
Tisotumab vedotin (HuMax-TF-ADC) |
Publication of data from Phase I/II trial in multiple solid tumours |
|
|
2018 |
|
Tisotumab vedotin (HuMax-TF-ADC) |
Initiate Phase II trials in 1L cervical cancer (combination) |
||
|
2018-19 |
|
Competition |
Potential results of ECOG Phase III trial of KRd vs VRd in 1L MM |
||
|
|
1H19 |
|
DuoBody-CD40x4-1BB |
Filed IND and start Phase I trials |
|
|
|
1H19 |
|
DuoBody-PD-L1x4-1BB |
Filed IND and start Phase I trials |
|
|
|
Mid 2019 |
Darzalex |
Expected approval by FDA based on MAIA Phase III trial |
||
|
2019 |
|
DuoBody-CD3xCD20 |
First clinical data from Phase I/II study in B-cell malignancies |
||
Deutsche |
2019 |
|
HexaBody DR5/DR5 |
First clinical data from Phase I/II study in solid tumors |
||
|
2H19 |
|
Subcut ofatumumab |
Phase III data in multiple sclerosis. Two Ph III trials vs Aubagio ongoing (ASCLEPIOS I and II) |
||
|
2019 |
|
Enapotamab vedotin (HuMax-AXL-ADC) |
First clinical data from Phase I/II study in solid tumors |
||
Bank |
2019 |
|
Competition |
Results of Phase III trials of isatuximab in R/R MM with Kyprolis |
||
|
2H19 |
|
DuoHexaBody-CD37 |
Filed IND and start Phase I trials |
||
|
|
|
||||
|
|
Dec-19 |
|
Tisotumab vedotin (HuMax-TF-ADC) |
Primary completion of Phase II (innovaTV 204) trial in 2/3L recurrent cervical cancer |
|
AG/London |
|
Source: Deutsche Bank |
|
|
|
|
|
|
|
|
|||
|
|
|
|
|
|
|
|
|
|
|
|
|
|
2018 December 10 Pharmaceuticals Pharmaceuticals European