

DB European Pharmaceuticals 2019 Outlook_watermark
.pdfvk.com/id446425943
Bank Deutsche |
M&A: Innovate or die...more likely just buy |
|
|
||
Mid range growth for the sector remains solid, thus large scale M&A remains unlikely for now |
||
AG/London |
■ |
EU Pharma is moderately levered despite moderate/large transactions by Bayer, GSK and Sanofi. The sector should generate a further $19bn in cash |
|
||
|
|
(after dividends) in 2019 and acquisitions or further shareholder distributions are likely. |
|
■ |
Market dynamics mean Biotechs justify high valuations. We expect large-cap pharma to focus on bolt on acquisitions in 2019, primarily given the |
|
|
health of their earnings trajectory. However, the very real boom in innovation/science with a looser FDA regulatory environment is creating new |
|
|
challenges. Biotechs have more value as timelines for development are quicker and costs to develop and launch are lower. This has twofold knock-on |
|
|
to Big Pharma meaning they have to pay-up for acquisitions, and that they risk being too slow in competitive R&D categories. Furthermore, it means |
|
|
faster obsolescence of existing products. As such, we expect continued bolt-on deals for new technologies and products by large pharma, which |
|
|
utilises its scientists to identify targets before the street can. Longer term, we expect a bifurcation in strategies as less innovative companies become |
|
|
consolidators of broad disease categories, rationalising costs vs a backdrop of price pressure in lower innovative categories. |
|
■ |
Roche, Novartis most likely dealmakers. M&A is still likely at Novartis, as it seeks to rebuild its high-tech focus areas, coupled with divestment of |
|
|
non-core (lower growth areas) such as the announced Alcon split as well as further divestments in generics and tail products. Roche typically makes |
|
|
deals each year as a supplement to R&D. However, given biosimilar pressures and increased oncology competition in general, we do not rule out |
|
|
larger diversifying acquisitions for this company. Novo Nordisk openly discusses potential deal-making in adjacent areas to diabetes. However, we |
|
|
expect only small scale deals for this conservative company. |
|
■ |
See Appendix A - M&A by company later in this report for our detailed company thoughts. |
Figure 34 : Net debt positions in EU Pharma have increased following |
|
Figure 35 : We expect EU Pharma to generate ~$19bn in FCF after |
|
|||||||||||||||
an acquisitive year |
|
|
|
|
|
|
|
dividends in 2019 |
|
|
|
|
|
|
||||
|
45 |
|
|
|
|
|
|
|
4.5 |
|
14 |
|
|
|
|
|
14% |
|
|
40 |
|
|
|
Proforma including |
|
|
4.0 |
|
|
|
|
|
|
|
|
|
|
|
|
|
|
Tesaro/Horlicks |
|
|
|
12 |
|
|
|
|
|
12% |
|
|||
|
|
|
|
|
|
|
|
|
|
|
|
|
|
|
||||
|
35 |
|
|
|
|
|
|
|
3.5 |
|
10 |
|
|
|
|
|
10% |
|
|
|
|
|
|
|
|
|
|
|
|
|
|
|
|
|
|
||
)($DNBNEBTET |
30 |
|
|
|
|
|
|
|
3.0 |
/EBITDADNEBTET |
)($FCFBN |
|
|
|
|
|
|
(%)IELDYFCF |
|
|
|
|
|
|
|
|
|
|
|
8 |
|
|
|
|
|
8% |
|
|
25 |
|
|
|
|
|
|
|
2.5 |
|
|
|
|
|
|
|
|
|
|
20 |
|
|
|
|
|
|
|
2.0 |
|
6 |
|
|
|
|
|
6% |
|
|
|
|
|
|
|
|
|
|
|
|
|
|
|
|
|
|
||
|
15 |
|
|
|
|
|
|
|
1.5 |
|
4 |
|
|
|
|
|
4% |
|
|
|
|
|
|
|
|
|
|
|
|
|
|
|
|
|
|
||
|
10 |
|
|
|
|
|
|
|
1.0 |
|
2 |
|
|
|
|
|
2% |
|
|
5 |
|
|
|
|
|
|
|
0.5 |
|
0 |
|
|
|
|
|
0% |
|
|
|
|
|
|
|
|
|
|
|
|
|
|
|
|
|
|
||
|
0 |
|
|
|
|
|
|
|
- |
|
-2 |
|
|
|
|
|
-2% |
|
|
|
|
|
|
|
|
|
|
|
|
|
|
|
|
|
|
||
|
-5 |
AZN |
Bayer |
GSK |
Novartis |
Novo |
Roche |
Sanofi |
-0.5 |
|
AZN |
Bayer |
GSK |
Novartis |
Novo |
Roche |
Sanofi |
|
|
|
|
|
|
|
|
|
Nordisk |
|
|
|
|||||||
|
|
|
|
|
|
Nordisk |
|
|
|
|
|
|
|
|
|
|
|
|
|
|
|
|
|
|
|
|
|
|
2019 FCF ($bn) |
FCF ($bn, after dividends) |
FCF yield (rhs) |
|
|||||
|
|
|
|
|
|
|
|
|
|
|
|
|||||||
|
|
Net Debt end 2018 ($bn) |
|
Average Net Debt/EBITDA |
Net Debt/EBITDA |
|
|
|
|
|
|
|
|
|
|
|||
Page |
Source: Deutsche Bank. Proceeds received by GSK's announced disposal of Horlicks business assumed as cash given the liquid |
|
Source: Deutsche Bank |
|
|
|
|
||||
21 |
nature of the consideration received. |
|
|
|
|
|
|
|
|
|
|
|
|
|
|
|
|
2018 December 10 Pharmaceuticals Pharmaceuticals European

vk.com/id446425943
Page |
Consumer Health: trends stabilising/improving; |
22 |
consolidation still possible |
|
Consumer/OTC markets saw a contraction in growth over 2015-18
■Global Consumer Healthcare companies have reported slower growth in the past 2-3 years. Investor concerns have focused on the impact of e- commerce, threatening pricing and volumes, a trend which Bayer has termed "the Amazon e ect." The ability of companies to adapt to changing business channels is a key uncertainty.
■eCommerce: a challenge and an opportunity. Companies are now seemingly adapting strategies to account for this shift, with Johnson and Johnson highlighting this as a key opportunity with expectations that this will grow from 4% of sales to double digits over time. On its call following the acquisition of Novartis' share of its Consumer business, GSK's CEO of its Consumer division Brian McNamara highted that " E-commerce is a challenge and an opportunity. Globally less than 2% of sales in the categories we compete go through e-commerce but the channel is growing well ahead of the market. "
■Trends showing stabilisation/improvement heading into 2019 - still room for consolidation. Despite a contraction in growth, Consumer trends seem to have stabilised in a low to mid single digit growth range during 2018. Although Pfizer's publically disclosed aim to exit its Consumer business did not lead to further consolidation in 2018, this remains a possibility and we expect Pfizer to make a decision on this around the end of 2018. It remains possible that Pfizer becomes willing to enter a JV with another major Consumer company, allowing both to benefit from synergies from such a cooperation. Given GSK's past involvement in such JV's this remains a strategic possibility for the company.
|
Figure 36 : Consumer/OTC reported growth rates have stabilised but |
|
|
|
Figure 37 : EU Pharma Consumer Health exposure |
|
|
|
|
||||||||||||||||||||||||
|
remain suboptimal |
|
|
|
|
|
|
|
|
|
|
|
|
|
|
|
|
|
|
|
|
|
|
|
|
|
|
|
|
|
|||
|
15.0% |
|
|
|
|
|
|
|
|
|
|
Reckitt Cons H'care (CER, Organic) |
|
|
|
|
30% |
|
|
|
|
|
|
|
|
|
|
|
|
||||
|
|
|
|
|
|
|
|
|
|
|
P&G Cons H'care (CER, Organic) |
|
|
|
|
|
|
|
|
|
|
|
|
|
|
|
|
|
|||||
|
|
|
|
|
|
|
|
|
|
|
|
|
|
|
|
|
|
|
|
|
|
|
|
|
|
|
|
|
|||||
|
|
|
|
|
|
|
|
|
|
|
|
J&J Cons (CER. Organic) |
|
|
|
|
sales |
|
|
|
|
|
|
|
|
|
|
|
|
|
|||
|
|
|
|
|
|
|
|
|
|
|
|
|
|
|
|
|
|
|
|
|
|
|
|
|
|
|
|
|
|||||
|
|
|
|
|
|
|
|
|
|
|
|
Pfizer Cons (CER) |
|
|
|
|
|
|
|
|
|
|
|
|
|
|
|
|
|
|
|||
|
|
|
|
|
|
|
|
|
|
|
|
|
|
|
|
|
|
|
|
|
|
|
|
|
|
|
|
|
|
||||
|
|
|
|
|
|
|
|
|
|
|
|
Sanofi Cons (CER/Organic) |
|
|
|
|
20% |
|
|
|
|
|
|
|
|
|
|
|
|
||||
|
|
|
|
|
|
|
|
|
|
|
|
|
|
|
|
|
|
|
|
|
|
|
|
|
|
|
|
||||||
|
10.0% |
|
|
|
|
|
|
|
|
|
|
GSK Cons (CER) |
|
|
|
|
|
group2018E |
|
|
|
|
|
|
|
|
|
|
|
|
|||
|
|
|
|
|
|
|
|
|
|
|
|
|
|
|
|
10% |
|
|
|
|
|
|
|
|
|
|
|
|
|||||
|
|
|
|
|
|
|
|
|
|
|
|
|
|
|
|
|
|
|
|
|
|
|
|
|
|
|
|
|
|
||||
Deutsche |
5.0% |
|
|
|
|
|
|
|
|
|
|
Bayer (CER/Organic) |
|
|
|
|
|
% of |
0% |
|
|
|
|
|
|
|
|
|
|
|
|
||
|
|
|
|
|
|
|
|
|
|
|
|
|
|
|
|
|
|
|
|
|
|
|
|
|
|
|
|||||||
|
|
|
|
|
|
|
|
|
|
|
|
|
|
|
|
|
|
|
|
|
|
|
|
|
|
|
|
|
|
||||
|
|
|
|
|
|
|
|
|
|
|
|
|
|
|
|
|
|
|
|
|
|
|
|
|
|
|
|
|
|
||||
|
|
|
|
|
|
|
|
|
|
|
|
|
|
|
|
|
|
|
|
|
|
|
|
|
|
|
|
|
|
||||
0.0% |
|
|
|
|
|
|
|
|
|
|
|
|
|
|
|
|
|
|
|
|
|
|
|
|
|
|
|
|
|
|
|||
|
|
|
|
|
|
|
|
|
|
|
|
|
|
|
|
|
|
|
|
|
|
|
|
|
|
|
|
|
|
||||
|
|
|
|
|
|
|
|
|
|
|
|
|
|
|
|
|
|
|
|
|
|
|
|
|
|
|
|
|
|
|
|||
|
|
|
|
|
|
|
|
|
|
|
|
|
|
|
|
|
|
|
|
|
Astra |
Bayer |
GSK |
Novartis |
Novo |
Roche |
Sanofi |
||||||
|
|
|
|
|
|
|
|
|
|
|
|
|
|
|
|
|
|
|
|
|
|
|
|||||||||||
AG/LondonBank |
-5.0% |
|
|
|
|
|
|
|
|
|
|
|
|
|
|
|
|
|
|
|
|
|
|
|
|
|
|
Sector average |
|
|
|
|
|
|
|
|
|
|
|
|
|
|
|
|
|
|
|
|
|
|
|
|
|
|
|
|
|
|
|
|
|
|
|
|
|||
|
|
|
|
|
|
|
|
|
|
|
|
|
|
|
|
|
|
|
|
|
|
|
|
|
|
|
|
|
|
|
|
||
1Q15 |
2Q15 |
3Q15 |
4Q15 |
1Q16 |
2Q16 |
3Q16 |
4Q16 |
1Q17 |
2Q17 |
3Q17 |
4Q17 |
1Q18 |
2Q18 |
3Q18 |
|
|
|
|
|
|
|
|
|
|
|
|
|
||||||
|
|
|
|
|
|
|
|
|
|
|
|
|
|
||||||||||||||||||||
|
Source: Company data |
|
|
|
|
|
|
|
|
|
|
|
|
|
|
|
|
|
Source: Deutsche Bank |
|
|
|
|
|
|
|
|
|
|||||
|
|
|
|
|
|
|
|
|
|
|
|
|
|
|
|
|
|
|
|
|
|
|
|
|
|
|
|||||||
|
|
|
|
|
|
|
|
|
|
|
|
|
|
|
|
|
|
|
|
|
|
|
|
|
|
|
|
|
|
|
|
|
|
2018 December 10 Pharmaceuticals Pharmaceuticals European

10 December 2018
Pharmaceuticals
European Pharmaceuticals
vk.com/id446425943
Deutsche Bank AG/London
Page 23
vk.com/id446425943
Page |
AstraZeneca (Buy; PT 6,900p) |
24 |
|
Best-in-class growth and best-in-class pipeline
■We expect AZN to emerge from its EPS trough as the fastest growing large pharma company in 2019. We expect the new drug portfolio to drive high single digit product sales growth and a material improvement in margins and earnings during the year. Our forecasts suggest AZN will deliver a '18-'22E EPS CAGR of ~18% as it emerges from its patent cli . This puts it well above its peer group and makes its current '20 PE of 16x (vs 14x for peers) look undemanding. In Bull cases, our DCF suggests potential upside to ~£75/share.
■Delivery on earnings leverage and pipeline in focus. With easing impact from generic pressures, we expect the momentum of AZN's margin leverage to begin to improve dramatically in 2019. We believe that the infrastructure to drive continued growth of the new portfolio (Fasenra, Imfinzi, Tagrisso, Lynparza and Lokelma) is largely in place and thus will delivery exceptionally high margin sales. The equity story should therefore shift to one of delivering/beating on revenue and earnings expectations. We expect that new portfolio, along with AZN's other growth products (Brilinta and Farxiga) to add an incremental ~$3bn in new sales in '19 and deliver '21E sales of ~$15bn (from $6.3bn today).
■Less hidden value but still pipeline catalysts. Following an intense period of new drug approvals and pipeline readouts, 2019 is likely to be a quieter year for AZN's. However, we still expect meaningful pipeline news, with pivotal data on potential new potential blockbuster roxadustat (see deep dive on roxadustat here ) and key clinical data for existing drugs Lynparza and Imfinzi in new potential indications. Combined these could add > $4bn in sales in Bull cases.
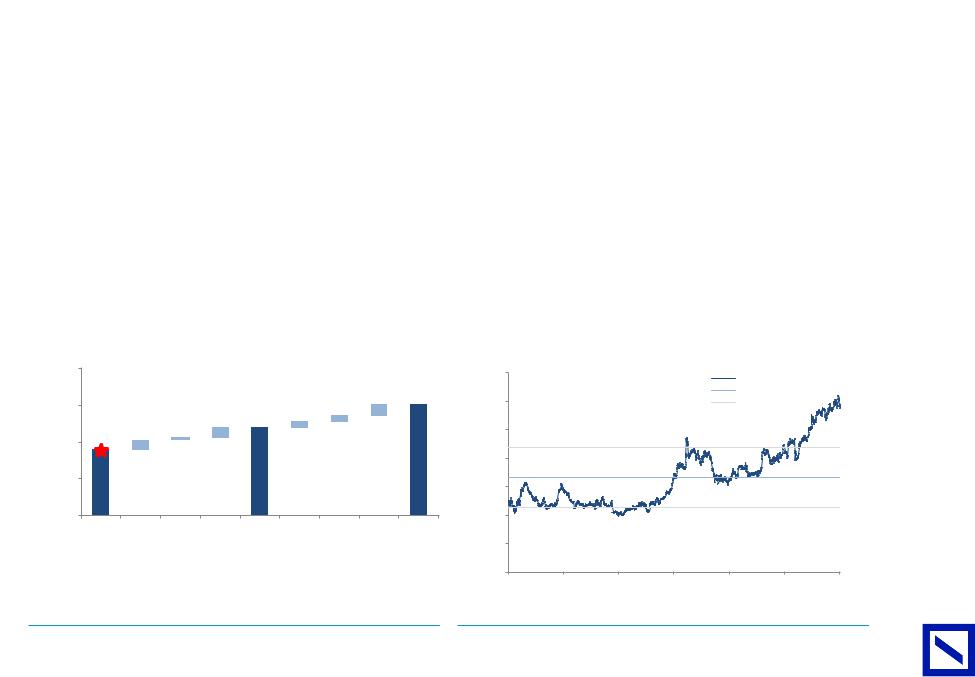
Figure 38: Bull/Bear case target price impact (GBp/share) |
|
Figure 39: PE Company vs. EU Pharma – 1 yr FWD PE |
|
|
|
|
|
8,500 |
|
|
|
|
|
|
|
|
|
1.6x |
|
|
|
|
|
|
|
|
|
|
|
|
|
|
|
|
|
|
|
|
|
Rel. PE |
|
|
|
|
|
|
|
|
|
|
|
|
|
|
|
|
|
|
|
|
|
|
|
|
|
|
|
|
|
|
|
|
311 |
7,528 |
|
|
|
|
10yr Ave |
|
|
|
|
|
|
|
|
|
|
|
|
|
|
|
|
|
|
|
||
|
|
7,500 |
|
|
|
|
|
|
159 |
|
|
1.4x |
|
|
|
+/- 1 s.d. |
|
|
|
(GBp)price |
|
|
|
6,900 |
|
159 |
|
|
|
|
|
|
|
|
|
||
|
|
|
|
276 |
|
|
|
fwd1yr(x), |
|
|
|
|
|
|
|
|||
|
|
|
|
|
|
|
|
|
|
|
|
|
|
|
|
|||
|
|
|
|
|
|
|
|
|
|
|
|
|
|
|
|
|
|
|
|
|
6,314 |
242 |
69 |
|
|
|
|
|
|
|
1.2x |
|
|
|
|
|
|
|
|
|
|
|
|
|
|
|
|
|
|
|
|
|
|
|||
|
|
|
|
|
|
|
|
|
|
|
|
|
|
|
|
|
|
|
|
|
6,500 |
|
|
|
|
|
|
|
|
|
|
|
|
|
|
|
|
|
Share |
|
|
|
|
|
|
|
|
|
tosector |
1.0x |
|
|
|
|
|
|
|
5,500 |
|
|
|
|
|
|
|
|
0.8x |
|
|
|
|
|
|
||
|
|
|
|
|
|
|
|
|
|
|
|
|
|
|
|
|
||
|
|
|
|
|
|
|
|
|
|
|
PE rel. |
|
|
|
|
|
|
|
|
|
|
|
|
|
|
|
|
|
|
|
|
|
|
|
|
|
|
Deutsche |
|
4,500 |
|
ve-Lynparza |
-Roxadustat ve |
|
|
Roxadustat |
+veLynparza |
+ve IO |
|
0.6x |
|
|
|
|
|
|
|
Bear |
veIO |
Base |
+ve |
Bull |
0.4x |
|
|
|
|
|
|
||||||
|
|
|
|
|
|
|
|
|
|
|
|
0.2x |
|
|
|
|
|
|
|
|
|
|
|
|
|
|
|
|
|
|
Jan 09 |
Aug 10 |
Apr 12 |
Dec 13 |
Aug 15 |
Apr 17 |
Dec 18 |
Bank |
Source: Deutsche Bank estimates, * - current share price |
|
|
|
|
|
|
Source: Deutsche Bank, Factset |
|
|
|
|
|
|||||
AG/London |
|
|
|
|
|
|
|
|
|
|
|
|||||||
|
|
|
|
|
|
|
|
|
|
|
|
|
|
|
|
|
|
|
2018 December 10 Pharmaceuticals Pharmaceuticals European

vk.com/id446425943
Deutsche |
|
Focus for 2019 |
|
|
|
|
■ |
Margin leverage key to share price performance. Our forecasts suggest AZN will deliver ~$3bn of additional high margin sales from its new portfolio |
|||
|
|
||||
Bank |
|
|
in 2019. Our discussions with management have suggested that top-line growth will largely be allowed to drop to the bottom line going forward, |
||
|
|
which should allow the company to guide to double digit EPS growth despite a headwind from likely lower overall externalisation and other operating |
|||
AG/London |
|
|
inhibitor roxadustat confirm the drug's e cacy in treating anemia associated with kidney disease. Although safety needs to be confirmed, we believe |
||
|
|
|
income. We expect margin expansion to improve thereafter reaching a 30% Group EBIT margin in 2020 and driving a 2018-22E EPS CAGR of ~18%. |
||
|
|
■ |
Roxadustat readout could open multi-blockbuster opportunity. We see a high probability that upcoming Phase III trials of AZN's first-in-class HIF-PH |
||
|
|
|
AZN sales could reach $1-3bn vs current consensus of ~$800m. This implies high single digit upside to '23E consensus EPS with ~3% downside. |
||
|
|
|
Demonstration of superior cardiovascular outcomes in dialysis-dependent chronic kidney disease would secure the class as a new standard-of-care. |
||
|
|
|
However, we believe the class could still have su cient di erentiation to ultimately justify blockbuster sales even without this data at the time of |
||
|
|
|
launch. |
|
|
|
|
■ |
IO portfolio and Lynparza still offer optionality; pipeline backfilling likely to gain momentum. Although the next 12 months will see the pace of key |
||
|
|
|
pipeline data readouts at AZN slow, we continue to see optionalty from trials of Lynparzi in new potential indications, with results of the PAOLO-1 trial |
||
|
|
|
(1L ovarian) and PROFOUND trials (prostate) potentially opening up >$2bn and ~$1bn market opportunities respectively. In addition, trials of Imfinzi/ |
||
|
|
|
tremelimumab in head and neck, bladder and small cell cancer and the POSEIDON trial in 1L NSCLC (+chemo) o er optionality given now very low |
||
|
|
|
expectations. Finally, we expect AZN to begin to work to backfill its late stage pipeline with multiple mid stage assets potentially moving into Phase |
||
|
|
|
III/pivotal trials including AKT inhibitor capivasertib (triple negative breast cancer) and monalizumab (head and neck/colorectal cancer). |
||
|
|
|
|
|
|
|
|
Key news flow |
|
|
|
|
|
|
|
|
|
|
|
Figure 40: Potential key news flow |
|
|
|
|
|
Timing |
Event |
Description |
|
|
|
4Q18 |
Roxadustat |
Results from ROCKIES and OLYMPUS Phase III trials (AZN sponsored) |
|
|
|
1Q19 |
Lynparza |
PDUFA for 1L BRCAm ovarian cancer |
|
|
|
1H19 |
Imfinzi/tremelimumab |
Results KESTREL Phase III trial in SCCHN (1L) |
|
|
|
1H19 |
Roxadustat |
Pooled CV safety data |
|
|
|
1H19 |
Roxadustat |
Planned FDA filing |
|
|
|
1H19 |
Lynparza |
Results of Phase III POLO trial in BRCAm pancreatic cancer |
|
|
|
1H19 |
Imfinzi/tremelimumab |
Results of NEPTUNE Phase III trial in 1L NSCLC (survival) |
|
|
|
1H19 |
Brilinta |
Data from THEMIS trial in type II diabetes and previous MI/stroke |
|
|
|
2H19 |
Imfinzi/Lynparza |
Primary completion of BAYOU Phase II trial in 1L cisplatin ineligible urothelial cancer |
|
|
|
2H19 |
Tagrisso |
1L OS data |
|
|
|
2H19 |
Lynparza |
Data from Phase III PAOLA-1 trial in 1L ovarian cancer |
|
|
|
2H19 |
Lynparza |
Data from Phase III PROFOUND trial in 2L prostate cancer |
|
|
|
2H19 |
Imfinzi/tremelimumab/chemo |
Data from POSEIDON Ph III trial in 1L NSCLC |
|
|
|
2H19 |
Imfinzi/tremelimumab/chemo |
Data from CASPIAN PhIII in SCLC |
|
|
|
2H19 |
Imfinzi/tremelimumab |
Results of DANUBE Phase III trial in 1st line bladder cancer |
|
|
|
2H19 |
PT010 |
Results from ETHOS Phase III trial of triple combo in COPD (exacerbations) |
|
|
|
2H19 |
Calquence |
Results of Phase III trial in 1L CLL with and without Gazyva |
|
|
|
2H19 |
Calquence |
Data from head-to-head Ph III trial vs Rituxan in r/rCLL |
|
25Page |
2019 |
Epanova |
CVOT data |
||
|
Source: Deutsche Bank |
|
|
||
|
|
|
|||
|
|
|
|
||
|
|
|
|
|
|
|
|
|
|
|
|
2018 December 10 Pharmaceuticals Pharmaceuticals European

vk.com/id446425943
26 Page |
Summary model |
|
|
|
|
|
|
|
|
|
|
|
|
|
|
|
|
|
|
|
|
Figure 41: AstraZeneca summary P&L |
|
|
|
|
|
|
|
|
|
|
|
|
|
|
|
|
|
|
|
|
|
|
USDm ex-per share |
2016A |
2017A |
|
2018E |
2019E |
2020E |
2021E |
2022E |
2023E |
|
|
|
|
|
|
|
|
|
|
|
|
Product sales |
21,319 |
20,152 |
21,092 |
22,716 |
25,790 |
28,174 |
30,198 |
31,379 |
|
|
Externalisation revenues |
1,683 |
2,313 |
1,000 |
1,100 |
900 |
750 |
750 |
750 |
|
|
Total revenues |
23,002 |
22,465 |
22,092 |
23,816 |
26,690 |
28,924 |
30,948 |
32,129 |
|
|
Gross profit |
19,130 |
18,477 |
17,861 |
19,515 |
22,027 |
23,824 |
25,314 |
26,161 |
|
|
Gross margin % |
83% |
82% |
81% |
82% |
83% |
82% |
82% |
81% |
|
|
Other op. income |
1,717 |
1,953 |
2,236 |
1,100 |
900 |
700 |
700 |
700 |
|
|
Operating profit |
6,721 |
6,855 |
5,993 |
6,543 |
8,196 |
9,589 |
10,860 |
11,480 |
|
|
Profit before tax |
6,027 |
6,150 |
5,108 |
5,671 |
7,352 |
8,739 |
10,056 |
10,726 |
|
|
Tax expense |
(658) |
(860) |
(919) |
(992) |
(1,287) |
(1,529) |
(1,760) |
(1,877) |
|
|
Tax rate % |
11% |
14% |
18% |
18% |
18% |
18% |
18% |
18% |
|
|
Core net income |
5,455 |
5,423 |
4,308 |
4,798 |
6,185 |
7,210 |
8,296 |
8,849 |
|
|
Core EPS |
4.31 |
4.28 |
3.41 |
3.79 |
4.89 |
5.70 |
6.56 |
7.00 |
|
|
Source: Deutsche Bank, Company data |
|
|
|
|
|
|
|
|
|
|
|
|
|
|
|
|
|
|
|
|
|
|
|
|
|
|
|||||
|
|
|
|
|
|
|||||
|
Figure 42: Rebased change in 2019E consensus earnings forecasts |
|
Figure 43: Sales and EPS growth 2016A-2023E |
|
|
|||||
|
|
1.10 |
|
|
|
|
|
|
|
|
35,000 |
|
|
|
|
|
|
|
|
7 |
|
|
change |
|
|
|
|
|
|
|
|
|
|
|
|
|
|
|
|
|
|
||
|
1.00 |
|
|
|
|
|
|
|
|
30,000 |
|
|
|
|
|
|
8% |
7% |
6 |
|
|
|
rebasedEPSconsensus |
|
|
|
|
|
|
|
|
(USDm)Revenue |
10,000 |
|
23% |
|
22% |
|
8% |
|
|
2 |
(USD)EPSCore |
|
|
|
|
|
|
|
|
|
|
|
25,000 |
|
|
|
|
10% |
|
|
|
5 |
|
|
|
0.90 |
|
|
|
|
|
|
|
|
|
|
|
|
12% |
|
|
45% |
46% |
|
|
|
|
|
|
|
|
|
|
|
|
|
20,000 |
|
|
|
|
|
|
4 |
|
||
|
|
|
|
|
|
|
|
|
|
|
24% |
|
17% |
|
|
43% |
|
|
|
||
|
|
|
|
|
|
|
|
|
|
|
|
21% |
|
41% |
|
|
|
|
|
||
|
|
|
|
|
|
|
|
|
|
|
|
|
|
|
|
|
|
|
|||
|
|
|
|
|
|
|
|
|
|
|
|
|
|
|
|
|
|
|
|
||
|
|
0.80 |
|
|
|
|
|
|
|
|
15,000 |
16% |
|
29% |
35% |
|
|
|
|
3 |
|
|
|
|
|
|
|
|
|
|
|
20% |
|
|
|
|
|
|
|||||
|
|
|
|
|
|
|
|
|
|
|
|
|
|
|
|
|
|
|
|
|
|
|
|
|
|
|
|
|
|
|
|
|
|
|
|
|
|
|
19% |
17% |
17% |
|
|
|
|
|
|
|
|
|
|
|
|
|
|
22% |
|
|
|
|
|
|
|
||
|
|
|
|
|
|
|
|
|
|
|
|
|
|
|
20% |
|
|
|
|
||
|
|
|
|
|
|
|
|
|
|
|
|
|
23% |
|
|
|
|
|
|
||
|
2020E |
0.70 |
|
|
|
|
|
|
|
|
|
|
|
|
|
|
|
|
|
|
|
|
|
|
|
|
|
|
|
|
|
|
|
|
|
|
|
|
|
|
|
||
|
|
|
|
|
|
|
|
|
|
5,000 |
38% |
36% |
31% |
31% |
30% |
30% |
30% |
30% |
1 |
|
|
|
|
|
|
|
|
|
|
|
|
|
|
|
|
|
|
|
|
||||
|
|
0.60 |
|
|
|
|
|
|
|
|
- |
|
|
|
|
|
|
|
|
0 |
|
|
|
Feb-15 |
Jul-15 |
Dec-15 |
May-16 |
Oct-16 |
Mar-17 |
Aug-17 |
Jan-18 |
Jun-18 Nov-18 |
|
|
|
|
|
|
|
|
|
||
|
|
|
2016A |
2017A |
2018E |
2019E |
2020E |
2021E |
2022E |
2023E |
|
|
|||||||||
Deutsche |
|
|
|
|
|
|
|
|
|
|
|
|
|
||||||||
Source: Deutsche Bank, Bloomberg Finance LP |
|
|
|
|
|
Source: Deutsche Bank, Company data |
|
|
|
Respiratory & Inflammation |
|
||||||||||
|
|
|
|
|
|
AstraZeneca |
|
|
|
|
Cardiovascular |
|
|
|
|
||||||
|
|
|
|
|
|
|
|
|
|
|
|
Oncology |
|
|
|
GI/other |
|
|
|
|
|
AG/London Bank |
|
|
|
|
|
|
|
|
|
|
|
|
|
|
|
|
|
|
|
|
|
2018 December 10 Pharmaceuticals Pharmaceuticals European

vk.com/id446425943
Bank Deutsche |
Bayer (Buy; PT €115) |
|
|
||
A special situation: the questions is how to realise the significant value potential |
||
AG/London |
|
view, management has struggled to provide a convincing message as to what Bayer is, why it exists in its current form, and of the superior returns |
|
■ |
Equity story muddled but slanting to crops. The acquisition of Monsanto has resulted in fears of significant product liability risk and earnings |
|
|
downgrades. As a result, Bayer's shares trade on 8.5x 2020 PE, a significant 40% discount to peers despite a better mid-term growth potential. In our |
|
|
investors could expect. For the shares to perform, we believe investors need to see a confident and consistent message from management, gain more |
|
|
clarity on the likely glyphosate based liability (albeit a significant risk, ahead of most past precedents is already priced in) and a see more favourable |
|
|
performance from the higher value crop business. While Bayer has announced cost savings measures and small divestments, should performance |
|
|
(and the share price) not improve, shareholder activism could become more vocal. This makes Bayer a special situation in the near term. |
|
■ |
Litigation. Unpredictable but extremes priced in. With limited Pharma newsflow expected and CropScience awaiting a improvement in the cycle |
|
|
(weather), 1H19 is likely to be dominated by glyphosate litigation news. The first of the federal bellwether trials starts in February and we expect |
|
|
volatility on the verdict. Unfortunately, precedent suggests a potential announced headline settlement of the near 10,000 current outstanding claims |
|
|
is unlikely to be reached in 1H19 so trial outcomes (and the volatility they come with) will direct the shares. As any individual trial outcome is unlikely |
|
|
to predict the final outlook, timing of investments on this theme is di cult. Longer-term however, our work shows that past precedent cases result |
|
|
in settlements of 100-300k per claimant despite larger initial headline awards. Based on this analysis, it can be argued that the share price reflects |
|
|
more than ten fold this precedent liability, suggestive of a positive risk/reward profile for the shares. |
Figure 44 : Bull/Bear case price target impact (€/share) |
|
Figure 45 : PE Company vs. EU Pharma – 1 yr FWD PE |
|
|||||||||||||||
|
140 |
|
|
|
|
|
|
|
|
1.1 |
131 |
1.4x |
|
|
|
|
|
|
|
|
|
|
|
|
|
|
|
1.7 |
|
|
|
|
|
|
|||
|
|
|
|
|
|
|
|
13.1 |
|
|
|
|
|
Rel. PE |
|
|||
|
130 |
|
|
|
|
|
|
|
|
|
|
|
|
|
|
|
||
|
|
|
|
|
|
|
115 |
|
|
|
|
|
|
|
|
|
10yr Ave |
|
|
120 |
|
|
44.2 |
0.9 |
|
|
|
|
|
|
|
|
|
|
|
|
|
|
|
|
|
|
|
|
|
|
|
|
|
|
|
+/- 1 s.d. |
|
|||
|
|
|
|
|
|
|
|
|
|
|
|
1.2x |
|
|
|
|
|
|
|
110 |
|
|
|
|
|
|
|
|
|
fwd |
|
|
|
|
|
|
|
(€) |
|
|
|
|
|
|
|
|
|
|
|
|
|
|
|
|
||
|
|
|
|
|
|
|
|
|
|
|
|
|
|
|
|
|
||
priceShare |
100 |
|
|
|
|
|
|
|
|
|
1yr(x),sector |
|
|
|
|
|
|
|
|
|
|
|
|
|
|
|
|
|
|
|
|
|
|
|
|
|
|
|
90 |
|
|
|
|
|
|
|
|
|
|
1.0x |
|
|
|
|
|
|
|
80 |
|
1.1 |
|
|
|
|
|
|
|
|
|
|
|
|
|
|
|
|
|
69 |
|
|
|
|
|
|
|
to |
|
|
|
|
|
|
|
|
|
70 |
|
|
|
|
|
|
|
|
|
|
|
|
|
|
|
||
|
|
|
|
|
|
|
|
|
|
rel. |
0.8x |
|
|
|
|
|
|
|
|
|
|
|
|
|
|
|
|
|
|
|
|
|
|
|
|
||
|
60 |
|
|
|
|
|
|
|
|
|
PE |
|
|
|
|
|
|
|
|
|
|
|
|
|
|
|
|
|
|
|
|
|
|
|
|
|
|
|
50 |
Bear |
Finerenone failure |
Glyphosate:Settle 50,000claims at $1meach |
Glyphosate: Settle20,000 claimsat $300k |
each |
Base(includes $5bnof G liabilities) |
Removalof conglomerate discount |
Daralutamide $2bnat peak |
Finerenone PhaseIII (moderate success) |
Bull |
|
|
|
|
|
|
|
|
|
Jan 09 |
Aug 10 |
Apr 12 |
Dec 13 |
Aug 15 |
Apr 17 |
Dec 18 |
||||||||||
|
|
|
|
|
|
|
|
|
|
|
|
0.6x |
|
|
|
|
|
|
|
|
|
|
|
|
|
|
|
|
|
|
0.4x |
|
|
|
|
|
|
Source: Deutsche Bank estimates, * - current share price |
Source: Deutsche Bank, Factset |
|
|
|
|
27 Page
2018 December 10 Pharmaceuticals Pharmaceuticals European

vk.com/id446425943
28 Page |
|
Focus for 2019 |
|
|
|
|
|
■ |
Litigation. A number of glyphosate related product liability trials are due to commence in 1Q19. Highest profile is likely to be the first Federal trial |
||||
|
|
|||||
|
|
|
(Hardeman vs Monsanto) held in California with Judge Chaabria. This will likely act as a bellwether trial to help both sides figure out options for |
|||
|
|
|
damages and settlements. Another State trial, again in California, is due to commence in March. A third trial in St Louis, Missouri is also in the process |
|||
|
|
|
of being scheduled for early next year. Outcomes from these trials will likely set the tone for the Bayer shares in 2019. |
|||
|
|
■ |
Looking to the skies. Bayer's CropScience division is clearly an attractive asset with a market leading position in a long term growth area. However, |
|||
|
|
|
with low soft commodity prices driven by repeated strong harvests, the division is currently operating at 'trough' levels. We see a potential improvement |
|||
|
|
|
in fortune as the market tightens due to trade tensions between the US and China. Furthermore, we expect Bayer's share price to be driven should |
|||
|
|
|
there be for cues from the weather, and/or farmer's planting behavior as the year progresses. Once investors believe Crop is out of its trough cycle, |
|||
|
|
|
we expect this to be the primary sentiment driver for the shares. |
|||
|
|
■ |
2019 a year of pipeline? We expect: 1) the roll out of Vitrakvi for TRK fusion cancers in early 2019 (not share price moving until Bayer can demonstrate |
|||
|
|
|
patient capture in this di use group of patients): 2) presentation of daralutamide's ARAMIS trial in castration resistant prostate cancer at a medical |
|||
|
|
|
conference in 1H19 (share price moving if it demonstrates an e cacy advantage or clear safety benefit vs already launched competitors); 3) We do |
|||
|
|
|
not expect Bayer to announce results of the finerenone diabetic kidney disease trials during 2019, albeit primary completion of the FIDELIO-DKD |
|||
|
|
|
trial is currently listed for October. |
|
|
|
|
|
|
|
|
|
|
|
|
Key news flow |
|
|
|
|
|
|
|
|
|
|
|
|
|
Figure 46 : Potential key news flow |
|
|
|
|
|
|
Timing |
Event |
Description |
|
|
|
|
Feb-19 |
Glyphosate trial |
First federal 'bellwether' trial starts |
||
|
|
Mar-19 |
Glyphosate trial |
Second state trial |
||
|
|
Mar-19 |
copanlisib |
Safety data from monotherapy trial in rituximab-refractory iNHL (CHRONOS-2) |
||
|
|
Mid-19 |
Portfolio disposals |
Progression of plans to dispose of assets, including Animal Health & certain Consumer Health |
||
|
|
brands |
||||
|
|
|
|
|||
|
|
1Q19 |
Manufacturing inspection |
FDA re-inspection of Leverkusen manufacturing facility |
||
|
|
Oct-19 |
vericiguat |
Results from Phase III VITALITY trial in HFpEF |
||
|
2019 |
darolutamide (ODM-201) |
Presentation of ARAMIS Phase III results in non-metastatic castration-resistant prostate cancer |
|||
|
2019 |
darolutamide (ODM-201) |
Expected regulatory filing and approval decision |
|||
|
|
Source: Deutsche Bank, Company data |
|
|
|
|
|
|
|
|
|
||
AG/London Bank Deutsche |
|
|
|
|
|
|
|
|
|
|
|
|
|
2018 December 10 Pharmaceuticals Pharmaceuticals European

vk.com/id446425943
Deutsche |
Summary model |
|
|
|
|
|
|
|
|
|
|
|
|
|
|
|
|
|
|
|
|
Figure 47 : Bayer summary P&L |
|
|
|
|
|
|
|
|
|
|
Bank |
€m (EPS €) |
2016A |
2017A |
|
2018E |
2019E |
2020E |
2021E |
2022E |
2023E |
|
|
|||||||||
|
|
|
|
|
|
|
|
|
|
|
AG/London |
Sales |
34,943 |
35,015 |
39,124 |
45,918 |
47,347 |
49,014 |
50,605 |
52,424 |
|
Reported EBIT |
5,738 |
5,903 |
5,157 |
5,951 |
7,101 |
8,138 |
9,346 |
10,615 |
||
|
Gross profit |
23,187 |
23,633 |
25,843 |
30,292 |
31,612 |
33,032 |
34,473 |
36,078 |
|
|
Gross margin |
66% |
67% |
66% |
66% |
67% |
67% |
68% |
69% |
|
|
Underlying EBIT |
6,826 |
7,130 |
6,536 |
8,210 |
8,860 |
9,647 |
10,475 |
11,244 |
|
|
Margin % |
20% |
20% |
17% |
18% |
19% |
20% |
21% |
21% |
|
|
PBT |
4,773 |
4,577 |
3,828 |
4,081 |
5,329 |
6,502 |
7,846 |
9,257 |
|
|
Net income before MI |
3,756 |
3,248 |
2,963 |
3,142 |
4,103 |
5,006 |
6,042 |
7,128 |
|
|
Net income from discontinued operations, to Baye |
788 |
4,087 |
0 |
0 |
0 |
0 |
0 |
0 |
|
|
Net income |
4,531 |
7,336 |
2,948 |
3,127 |
4,088 |
4,991 |
6,027 |
7,113 |
|
|
Basic EPS |
5.44 |
8.41 |
3.13 |
3.18 |
4.16 |
5.08 |
6.14 |
7.24 |
|
|
Core EPS |
6.67 |
6.64 |
5.80 |
6.92 |
7.75 |
8.53 |
9.30 |
10.00 |
|
|
Source: Deutsche Bank, Company data. |
|
|
|
|
|
|
|
|
|
|
|
|
|
|
|
|
|
|
|
|
|
|
|
|
|
|
|||||
|
|
|
|
|
|
|||||
|
Figure 48 : Rebased change in 2019E consensus earnings forecasts |
|
Figure 49 : Sales and EPS growth 2016A-2023E |
|
|
|||||
|
|
|
|
|
|
|
|
|
|
|
|
1.10 |
|
|
|
|
|
|
|
|
60,000 |
|
|
|
|
|
|
|
|
12 |
|
change |
|
|
|
|
|
|
|
|
|
|
|
|
|
|
|
|
|
|
||
1.00 |
|
|
|
|
|
|
|
|
50,000 |
|
|
|
|
|
|
3% |
3% |
10 |
|
|
rebasedEPSconsensus |
|
|
|
|
|
|
|
|
|
|
|
|
|
|
3% |
3% |
|
|
|
|
|
|
|
|
|
|
|
|
(EURm)Revenue |
|
|
|
|
3% |
|
|
|
|
(EUR)EPSCore |
||
|
|
|
|
|
|
|
|
|
|
|
|
|
|
|
|
|
||||
|
0.90 |
|
|
|
|
|
|
|
|
40,000 |
|
|
4% |
|
|
|
45% |
45% |
8 |
|
|
|
|
|
|
|
|
|
|
|
|
|
|
|
44% |
|
|
|
|||
|
|
|
|
|
|
|
|
|
|
3% |
3% |
|
44% |
44% |
|
|
|
|||
|
|
|
|
|
|
|
|
|
|
|
|
|
|
|
|
|
||||
|
|
|
|
|
|
|
|
|
|
|
|
|
|
|
|
|
|
|||
|
|
|
|
|
|
|
|
|
|
30,000 |
28% |
27% |
36% |
|
|
|
|
|
6 |
|
|
|
|
|
|
|
|
|
|
|
|
|
|
|
|
|
|
|
|
||
|
0.80 |
|
|
|
|
|
|
|
|
|
|
|
|
|
3% |
3% |
3% |
3% |
|
|
|
|
|
|
|
|
|
|
|
|
4% |
4% |
4% |
3% |
|
|
|
||||
|
|
|
|
|
|
|
|
|
|
|
|
|
11% |
|
|
|||||
|
|
|
|
|
|
|
|
|
|
20,000 |
12% |
12% |
12% |
4 |
|
|||||
|
|
|
|
|
|
|
|
|
|
17% |
17% |
14% |
12% |
|
|
|||||
|
|
|
|
|
|
|
|
|
|
|
|
|
|
|||||||
2020E |
0.70 |
|
|
|
|
|
|
|
|
|
|
|
|
|
|
|
|
|
|
|
|
|
|
|
|
|
|
|
|
10,000 |
47% |
48% |
43% |
38% |
37% |
37% |
37% |
37% |
2 |
|
|
|
|
|
|
|
|
|
|
|
|
|
|
|
|
|
||||||
|
0.60 |
|
|
|
|
|
|
|
|
0 |
|
|
|
|
|
|
|
|
0 |
|
|
Feb-15 |
Jul-15 |
Dec-15 |
May-16 |
Oct-16 |
Mar-17 |
Aug-17 |
Jan-18 |
Jun-18 Nov-18 |
|
2016A |
2017A |
2018E |
2019E |
2020E |
2021E |
2022E |
2023E |
|
|
|
|
|
|
|
|
|
|
|
|
|
|
|
||||||||
|
|
|
|
|
Bayer |
|
|
|
|
Pharma (incl. Radiology) |
Consumer Health |
|
Animal Health |
|
|
|||||
|
|
|
|
|
|
|
|
|
|
|
|
|
|
|
|
|
|
|
|
|
|
|
|
|
|
|
|
|
|
|
CropScience |
|
|
Reconciliation |
|
Core EPS |
|
|
|||
Source: Deutsche Bank, Bloomberg Finance LP |
Source: Deutsche Bank, Company data |
|
|
|
|
29 Page
2018 December 10 Pharmaceuticals Pharmaceuticals European

vk.com/id446425943
Page |
GlaxoSmithKline (Hold; PT 1,520p) |
30 |
|
Dividend secure (for now) but growth prospects under pressure
■GSK's shares have recovered from lows as investors have grown more confident over sustainability of its dividend. We continue to view the shares' 5% yield as its key attraction. In theory this should be sustainable. However, we continue to see a risk more aggressive business development strategy is ultimately required to turn around GSK's Pharma R&D and the recent Tesaro acquisition seems to increase the risk management may at some point be willing to sacrifice this if it is in the best interests of the company. With the shares trading in line with the sector, despite lower growth potential and greater pipeline uncertainty, we see limited share price upside. Hold.
■Restrained growth likely near-term. GSK will likely have to absorb a meaningful drag to profits given expected entry of a US generic to Advair in the near term. The extent to which this will result in spillover pricing pressure on its newer respiratory portfolio is unclear. In addition, we continue to expect ViiV and Nucala to see a significant growth slowdown. As a result, delivery of underlying EPS growth in '19 looks challenging. On top of this, the recent acquisition of Tesaro is expected to be mid to high single digit dilutive.
■We expect GSK's Vaccines and Consumer divisions to deliver solid sales growth over 18-22E with a CAGR of 5% and 3% respectively. However, with overall growth in Pharma revenues likely modest (~2%) and with reinvestment required in Pharma R&D, we expect EPS growth to be an unspectacular ~3% CAGR. Beyond this, we see GSK's ability to restock its Pharma pipeline organically ahead of the dolutegravir patent expiry ('27-29) as a continued major uncertainty and we retain a cautious stance on it's most high profile late-stage asset (BCMA-ADC) given a risk of cumulative ocular toxicity.
Figure 50 : Bull/Bear case price target impact (UKp/share) |
|
Figure 51 : PE Company vs. EU Pharma – 1 yr FWD PE |
|
|
|
|
|
|
|
|
|
|
|
1,670 |
1.2x |
|
|
Rel. PE |
|
|
|
|
|
|
|
|
|
|
100 |
|
|
|
|
|
|
||
|
|
|
|
|
|
|
|
|
|
10yr Ave |
|
|
|
||
|
|
|
|
|
|
|
|
|
|
|
|
|
|
||
|
|
|
|
|
|
|
|
|
|
|
|
|
|
|
|
|
|
1,600 |
|
|
1,520 |
50 |
|
|
1.1x |
|
|
+/- 1 s.d. |
|
|
|
|
|
|
75 |
|
|
|
|
|
|
|
|
|
|
||
|
|
|
|
|
|
|
|
|
|
|
|
|
|
|
|
|
(GBp)price |
1,500 |
60 |
|
|
|
|
|
1yr(x),sectorfwd |
|
|
|
|
|
|
|
1,385 |
|
|
|
|
|
|
|
|
|
|
|
|||
|
|
|
|
|
|
|
1.0x |
|
|
|
|
|
|
||
|
|
|
|
|
|
|
|
|
|
|
|
|
|
|
|
|
|
1,400 |
|
|
|
|
|
|
|
|
|
|
|
|
|
|
Share |
1,300 |
|
|
|
|
|
|
0.9x |
|
|
|
|
|
|
|
1,200 |
|
|
|
|
|
|
rel.PEto |
|
|
|
|
|
|
|
|
|
|
|
|
|
|
|
|
|
|
|
|
|
|
|
|
|
|
|
|
|
|
|
|
0.8x |
|
|
|
|
|
|
Deutsche |
|
1,100 |
|
|
|
|
|
|
|
|
|
|
|
|
|
|
1,000 |
|
|
|
|
|
|
0.7x |
|
|
|
|
|
|
|
|
|
|
|
|
|
|
|
|
|
|
|
|
|
|
|
|
|
Bear |
ViiV |
Price |
Base |
Strong |
Strong |
Bull |
|
|
|
|
|
|
|
|
|
|
declining |
pressure |
|
BCMA |
Shingrix |
|
0.6x |
|
|
|
|
|
|
Bank |
|
|
|
|
|
sales |
|
|
|
|
|
|
|
|
|
|
|
|
|
|
|
|
Jan 09 |
Aug 10 |
Apr 12 |
Dec 13 |
Aug 15 |
Apr 17 |
Dec 18 |
||
|
|
|
|
|
|
|
|
||||||||
AG/London |
|
|
|
|
|
|
|
|
|||||||
Source: Deutsche Bank estimates, * - current share price |
|
|
|
|
Source: Deutsche Bank, Factset |
|
|
|
|
|
|||||
2018 December 10 Pharmaceuticals Pharmaceuticals European