

ppl_05_e2
.pdfID: 3658
Customer: Oleg Ostapenko E-mail: ostapenko2002@yahoo.com
Customer: Oleg Ostapenko E-mail: ostapenko2002@yahoo.com
CHAPTER 4: EN-ROUTE PERFORMANCE
ENDURANCE.
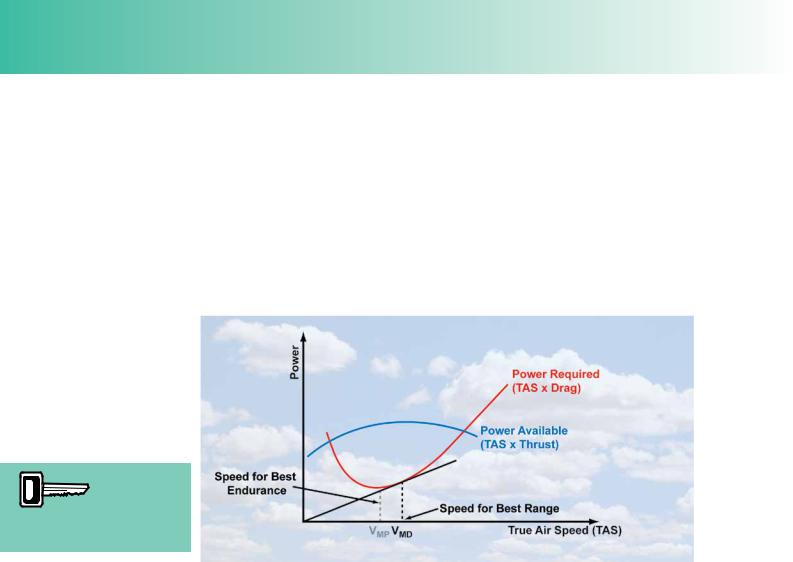
An aircraft’s endurance is the maximum possible time that it can remain airborne. To remain airborne for as long as possible, the aircraft must consume fuel at as low a rate as possible. Rate of fuel consumption is a function of power required, and fuel consumption will be a minimum when the power required to maintain level fight is a minimum. Minimum rate of fuel consumption, then, will be achieved at the speed for minimum power. The minimum power speed is the speed that corresponds to the lowest point on the power required graph, and may be labelled as VMP. (See Figure 4.3) VMP for the PA28-161 Warrior is about 65 knots.
For a
propeller driven aircraft
the speed
for maximum endurance is minimum power speed, VMP.
Increased weight decreases endurance.
Use of flaps decreases endurance.
Figure 4.3 The level-flight speed which requires minimum power (VMP) is the speed for maximum endurance.
Any increase in weight or use of faps, both of which will increase drag for any given level-fight speed, will require more power to maintain level fight and decrease an aircraft’s endurance.
RANGE.
Most often, pilots are concerned to be able to cover the maximum distance for minimum fuel consumption. The maximum distance an aircraft can fy for a given quantity of fuel consumed is called the aircraft’s range. Several factors, not the least being wind speed and direction, affect an aircraft’s range. The frst factor we will consider is engine power.
Power and Range.
The speed for maximum endurance is not the speed to use when we wish to fy as far as possible. In other words, maximum endurance speed is not the speed for maximum range. To achieve maximum distance on a given quantity of fuel, we must fy at a speed which gives us the best compromise between speed and fuel consumption. This speed is that at which the ratio between speed achievable and power required is the least. In order to fnd the speed at which the power/speed ratio is most favourable, a line is drawn from the origin of the axes of the power available - power required graph to touch the power required curve at a tangent (see Figure 4.4). A vertical line dropped from the tangent to the curve, to intersect the horizontal axis, allows us to read the speed for maximum range directly. If the gradient of the
423
Order: 6026
Customer: Oleg Ostapenko E-mail: ostapenko2002@yahoo.com
Customer: Oleg Ostapenko E-mail: ostapenko2002@yahoo.com
CHAPTER 4: EN-ROUTE PERFORMANCE
straight line were to meet the curve at any other point than the tangent (it would then, of course, cut the power required curve in two places), the line would be steeper and, therefore, the power/airspeed ratio would be less favourable.
Though it is beyond the scope of this book, it can be shown that the speed for maximum range for any propeller-driven aircraft is also the speed for minimum drag, often represented as VMD. Minimum drag occurs at the best lift/drag ratio with the aircraft fying at an angle of attack of about 4°.
You will note that the speed for maximum range (minimum drag), VMD, is a little higher than the speed for maximum endurance (minimum power), VMP.
The speed for maximum
range is minimum drag
speed, VMD .
Figure 4.4 The speed at which the aircraft achieves the most advantageous compromise between speed and power required is the speed for maximum range. This is also the speed for minimum drag.
FACTORS WHICH AFFECT FLYING FOR RANGE.
The key point about fying for maximum range in a propeller-driven aircraft is that the aircraft fies at the speed for minimum drag; that is, at the speed and angle of attack for the most favourable lift/drag ratio. This angle of attack is about 4° in a typical general aviation aircraft, and, as we have seen, in the PA28 Warrior, the speed for this angle of attack, giving best lift/drag ratio and maximum range, is 75 kts. At this speed and angle of attack, the aircraft is fying at its most effcient, aerodynamically speaking.
There are four principal factors which affect an aircraft’s range and speed for maximum range: aircraft mass (weight), aircraft confguration, altitude and wind speed and direction. By aircraft confguration we mean whether the faps and/or undercarriage are deployed or not. We will examine these four factors, one by one.
424
ID: 3658
Customer: Oleg Ostapenko E-mail: ostapenko2002@yahoo.com
Customer: Oleg Ostapenko E-mail: ostapenko2002@yahoo.com
CHAPTER 4: EN-ROUTE PERFORMANCE
Aircraft Weight.
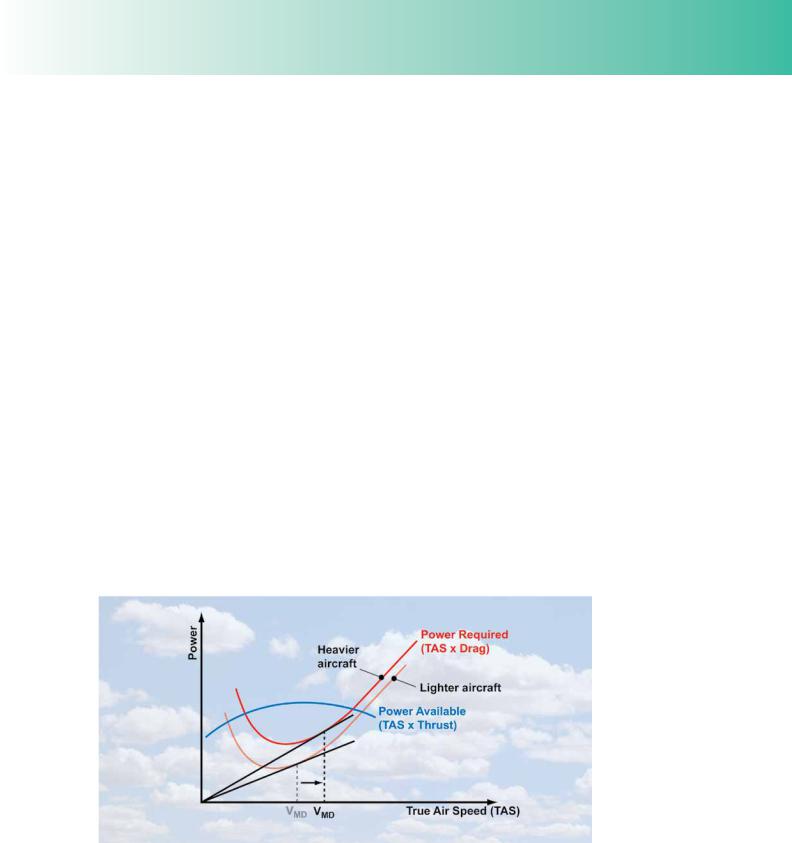
As we have seen, in order to achieve maximum range the aircraft must fy at the speed for minimum drag. It must also, however, fy at minimum load. If greater load is carried, the maximum achievable range will decrease, while the speed at which the lower maximum range is achieved will increase.
Increasing an aircraft’s weight means that the wings of the aircraft must generate extra lift to support the higher weight. Consequently, as an aircraft’s weight increases the aircraft must fy faster to maintain any given angle of attack, or it must fy at a greater angle of attack for any given airspeed.
An increase in lift at any speed results in an increase in induced drag at that speed. More power will be required to overcome the extra drag, the greater power will raise fuel consumption, and so the best power required/speed ratio will be less favourable at a higher aircraft weight than at a lower weight. Consequently, maximum range will be less at the higher weight.
On the other hand, the angle of attack for the best lift/weight ratio remains unaffected by weight and will remain at about 4°. As we have just stated, a heavier aircraft must fy faster to maintain a given angle of attack. Therefore, the speed for maximum achievable range will increase.
The effect of increasing weight just described means that the power required curve in our graph moves up and to the right. The speed for maximum range is, as before, given by dropping a vertical line from the tangent to the power required curve formed by a straight line drawn from the origin of the graph’s axes, and reading the new maximum range (minimum drag) speed, VMD, from the horizontal axis. (See Figure 4.5.)
Figure 4.5 At higher weights, lift and drag increase and the power required to overcome the drag increases. The power required curve moves up and to the right. Maximum range decreases and the speed for best achievable maximum range increases.
Aircraft Configuration.
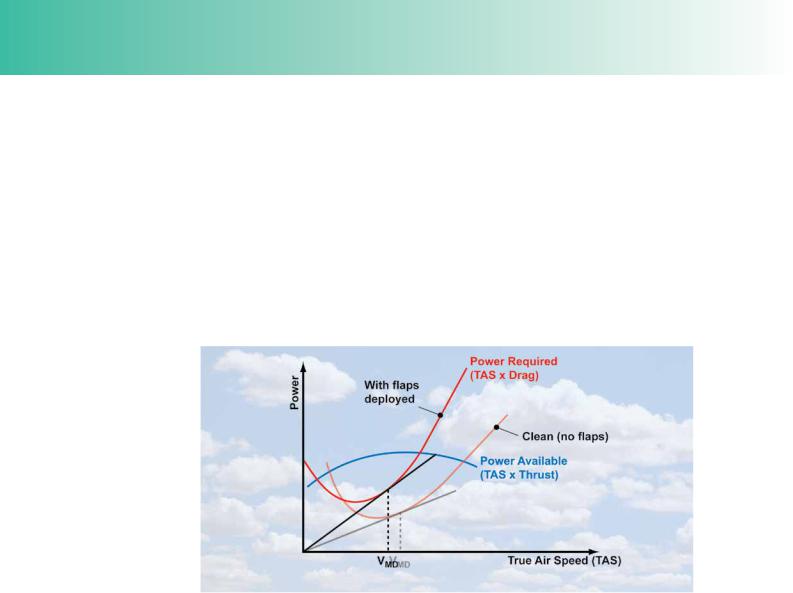
If faps and/or undercarriage are down, there is a signifcant increase in drag. Considering faps alone (most light aircraft having fxed undercarriages anyway), when they are lowered more lift and associated drag is generated.
425
Order: 6026
Customer: Oleg Ostapenko E-mail: ostapenko2002@yahoo.com
Customer: Oleg Ostapenko E-mail: ostapenko2002@yahoo.com
CHAPTER 4: EN-ROUTE PERFORMANCE
Drag and power required are higher at all speeds because of the increase in the coeffcient of drag, CD, engendered by the change in the effective shape and camber of the wing cross section (aerofoil). Consequently, the value of minimum drag will increase, and require increased power to balance that drag. Increased power means a higher rate of fuel consumption and a decrease in maximum range compared to a more lightly loaded aircraft.
Selecting any angle of fap increases drag by a greater proportion than lift. Therefore, the best achievable lift/drag ratio will also be lower when fap is down. Also in Figure 4.6.
The result of all the above considerations is that the power required curve moves upward and to the left, as shown in Figure 4.6.
Figure 4.6 With flaps extended, drag and power required increase at all speeds. The power required curve moves up and to the right. Maximum range decreases and the speed for best achievable maximum range increases.
The speed for maximum range is, as before, given by dropping a vertical line from the tangent to the power required curve formed by a straight line drawn from the origin of the graph’s axes, and reading the new maximum range (minimum drag) speed, VMD, from the horizontal axis. You will see that the best attainable power/ speed ratio is less favourable than for a “clean” aircraft, and that the speed which gives the best power/speed ratio (i.e. the speed for the maximum attainable range) is lower than for an aircraft with faps up.
Altitude.
If we were considering the aircraft alone (i.e. its aerodynamic properties) and not the engine, we would get the same maximum range by fying at the same indicated maximum range speed, (speed for best lift/drag ratio) whatever altitude we few at.
Indicated airspeed is a function of dynamic pressure (½ ρv2), and so is drag, so (still considering the aircraft only) as long as we few at indicated airspeed for best lift/drag ratio, the drag would be the same. One might naturally think that the power required to overcome the drag at that speed would also be the same. However, the power required is not the same. Power required is a function of true airspeed, not indicated airspeed, and, as you know (see Chapter 4 of Principles of Flight), the higher an
426

ID: 3658
Customer: Oleg Ostapenko E-mail: ostapenko2002@yahoo.com
Customer: Oleg Ostapenko E-mail: ostapenko2002@yahoo.com
CHAPTER 4: EN-ROUTE PERFORMANCE
aircraft fies the greater is its true airspeed for a given indicated airspeed, and the greater the power required at that airspeed. Also, at the higher altitude, air density is lower which further increases the power required for level fight while reducing the power available from the engine.
In order to get the maximum range from an aircraft, both the aircraft and the engine must be operated to best advantage. It follows, then, that the correct altitude to fy is the altitude at which the indicated minimum drag (maximum lift/drag ratio) airspeed is also the true airspeed which permits the engine-propeller combination to operate at its most effcient. This reasoning explains why some Pilot’s Operating Handbooks
(but not all) give an altitude alongside the aircraft’s maximum range speed. If the aircraft is fown at higher altitudes than the optimum altitude, more and more power will be required to achieve the speed for minimum drag (best lift/drag ratio).
Reducing
air density reduces an
aircraft’s
overall performance.
Therefore, to maximize range at high altitude we must either reduce speed, meaning we are using the aircraft less effciently, aerodynamically speaking, or open the throttle fully (or maybe enrichen the mixture), meaning that we are using the engine uneconomically.
Consequently, for all aircraft there is a best altitude at which to fy for range. That altitude is determined by the effciency of the engine-propeller combination, not by the aerodynamic properties of the aircraft which would be equally as effcient at all altitudes.
In practice, for light, piston-engine powered aircraft with a fxed-pitch propeller and without a supercharger, which tend to operate at low altitudes, the best height for maximum range at those low altitudes is not very critical.
Wind considerations are usually far more critical to a light aircraft’s best achievable range.
Effects of Wind on Range.
Wind of any strength and any direction will affect an aircraft’s range.
When no wind is blowing; that is, when the wind is calm, an aircraft’s true airspeed will be the same as its speed over the ground. Speed over the ground is known as groundspeed.
An aircraft fying with a the wind behind it, i.e. a tailwind, will have a higher groundspeed than an aircraft fying at the same true airspeed when no wind is blowing or if it is fying into a headwind. With a tailwind, the speed of the wind itself is added to the aircraft’s true airspeed to give the aircraft’s groundspeed. Consequently, with a tailwind, the aircraft is covering a greater distance for any given rate of fuel consumption, than if it were fying in calm conditions or against a headwind. A tailwind, then, will increase an aircraft’s range.
An aircraft fying into a headwind will have a lower speed over the ground than an aircraft fying at the same true airspeed when the wind is calm, or if there is a tailwind.
With a headwind, the speed of the wind itself is subtracted from the aircraft’s true airspeed to give its groundspeed. Consequently, with a headwind, the aircraft is covering a smaller distance for any given rate of fuel consumption, than if it were fying in calm conditions or with a tailwind. A headwind, then, will reduce an aircraft’s range.
Maximum
range speed is the speed
for the best
lift/drag ratio, unless flying at high altitude when power considerations have to be taken into account.
427

Order: 6026
Customer: Oleg Ostapenko E-mail: ostapenko2002@yahoo.com
Customer: Oleg Ostapenko E-mail: ostapenko2002@yahoo.com
CHAPTER 4: EN-ROUTE PERFORMANCE
When taking into consideration the effect of the wind on the fuel consumed over a given distance for a track that you have planned to fy on a cross-country route, you will very often fnd that the direction of the wind is such that it is blowing obliquely to your planned track, at a greater or lesser angle. A crosswind of this nature will mean that you will experience either a headwind or tailwind component when tracking along the ground. Volume 3 of this series, Navigation & Radio Aids, teaches you how to take account of crosswinds to calculate your heading and groundspeed. Wind strength and direction may change signifcantly over time and with altitude. In fying cross-country, therefore, the pilot-navigator needs to be very aware of deviations in wind strength and direction from those forecast.
When fying into a headwind, the speed for maximum range will be a little higher than the speed derived from the power required – power available graph, and the speed given in the Pilot’s Operating Handbook. The increased fuel consumption resulting from the higher power setting is compensated for by the fact that the higher speed will mean that less time is spent fying against the headwind, on the track concerned.
When fying with a tailwind, the speed for maximum range is lower than that given in the Pilot’s Operating Handbook. The reduction in best range speed is lower so that the aircraft can beneft from the higher groundspeed and, at the same time, reduce fuel consumption. In a strong tailwind, the speed to choose for maximum range will probably be not far different from the speed for best endurance.
CRUISE PERFORMANCE GRAPHS.
In the Pilot’s Operating Handbook (POH) for your aircraft, you will probably not fnd any theoretical treatment of fying the aircraft for range or endurance. The POH generally contains graphs of the type depicted in Figures 4.7, and 4.8, allowing the pilot to carry out practical range and endurance calculations.
Endurance Graphs.
Figure 4.7 depicts a typical endurance graph for a light aircraft. The method of calculating endurance from the graph is similar to the method that you learnt in the previous chapter for extracting performance fgures for the climb.
428
ID: 3658
Customer: Oleg Ostapenko E-mail: ostapenko2002@yahoo.com
Customer: Oleg Ostapenko E-mail: ostapenko2002@yahoo.com
CHAPTER 4: EN-ROUTE PERFORMANCE
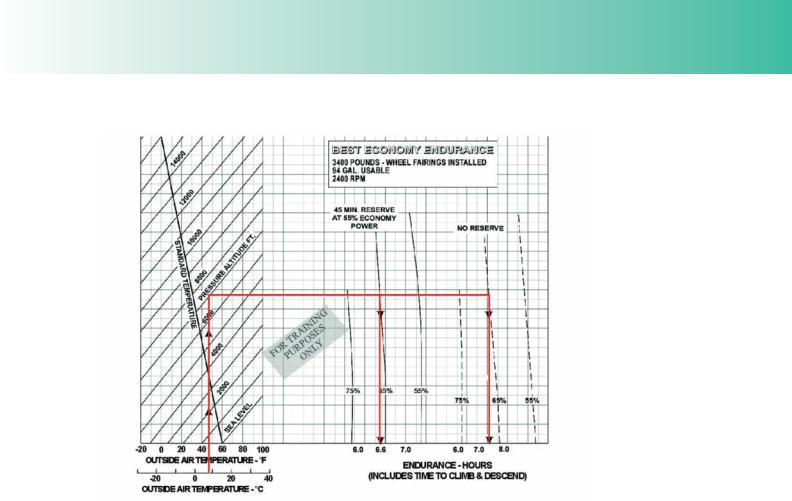
Figure 4.7 A Typical Endurance Graph for a light aircraft.
The red lines on the graph depict how endurance is extracted from the graph for a given set of atmospheric and aircraft parameters.
The example assumes that an aircraft is to cruise at a pressure altitude of 7 000 feet with an outside air temperature of 7°C. The power setting is assumed to be
2 400 revolutions per minute, and the pilot wishes to have 45 minutes of reserve fuel in his aircraft’s tanks, at the end of the planned fight. Given these assumptions,
Figure 4.7 shows how the corresponding endurance is extracted from the graph. Outside air temperature and pressure altitude are entered at the left hand end of the graph by drawing a vertical line from the temperature scale to the curve representing the pressure altitude. A horizontal line is then drawn across to the curve representing
45 minutes reserve (note that reserve fgures assume the power setting to be 55% of maximum power). A vertical line is dropped from this curve to cut the horizontal axis at a point which gives the aircraft’s endurance in hours (6.6 hours in the example illustrated). The endurance given also takes into consideration the climb to height, and the descent.
Note that the example also shows that the endurance with no reserves of fuel would be approximately 7½ hours.
429
Order: 6026
Customer: Oleg Ostapenko E-mail: ostapenko2002@yahoo.com
Customer: Oleg Ostapenko E-mail: ostapenko2002@yahoo.com
CHAPTER 4: EN-ROUTE PERFORMANCE
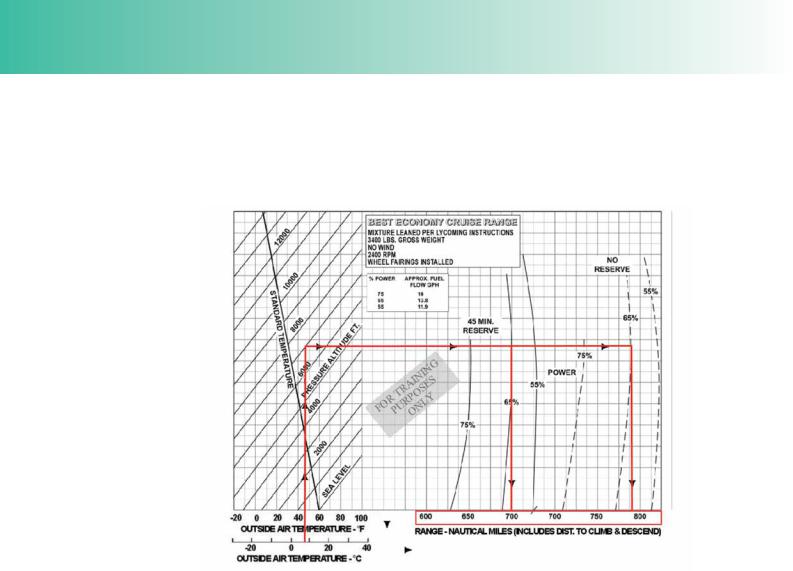
Range Graphs.
Figure 4.8, below, depicts a typical range graph for a light aircraft. The method of calculating range from the graph is exactly the same as that used for the endurance graph.
Figure 4.8 A typical range graph for a light aircraft.
The example assumes that an aircraft is to cruise at a pressure altitude of 7 000 feet with an outside air temperature of 7°C and 65% power set.
You can see that, allowing for 45 minutes of reserve fuel, the achievable range will be 700 nautical miles, while, if no reserve fuel is assumed, the range will be just over 780 nautical miles.
When using Cruise Performance Graphs, be sure to follow the instructions in the Pilot’s Operating Handbook carefully. Be sure, too, to take note of all the assumptions made in the calculations; the assumptions will most probably need to be taken into consideration to refne the fgures extracted from the graphs.
430
ID: 3658
Customer: Oleg Ostapenko E-mail: ostapenko2002@yahoo.com
Customer: Oleg Ostapenko E-mail: ostapenko2002@yahoo.com
CHAPTER 4: EN-ROUTE PERFORMANCE
THE DESCENT.
The descent may be regarded as the fnal part of the en-route of fight.
There are two ways of assessing the descent performance of an aircraft: angle of descent, sometimes called descent range, or rate of descent, sometimes called descent endurance.
Angle of Descent (Descent Range).
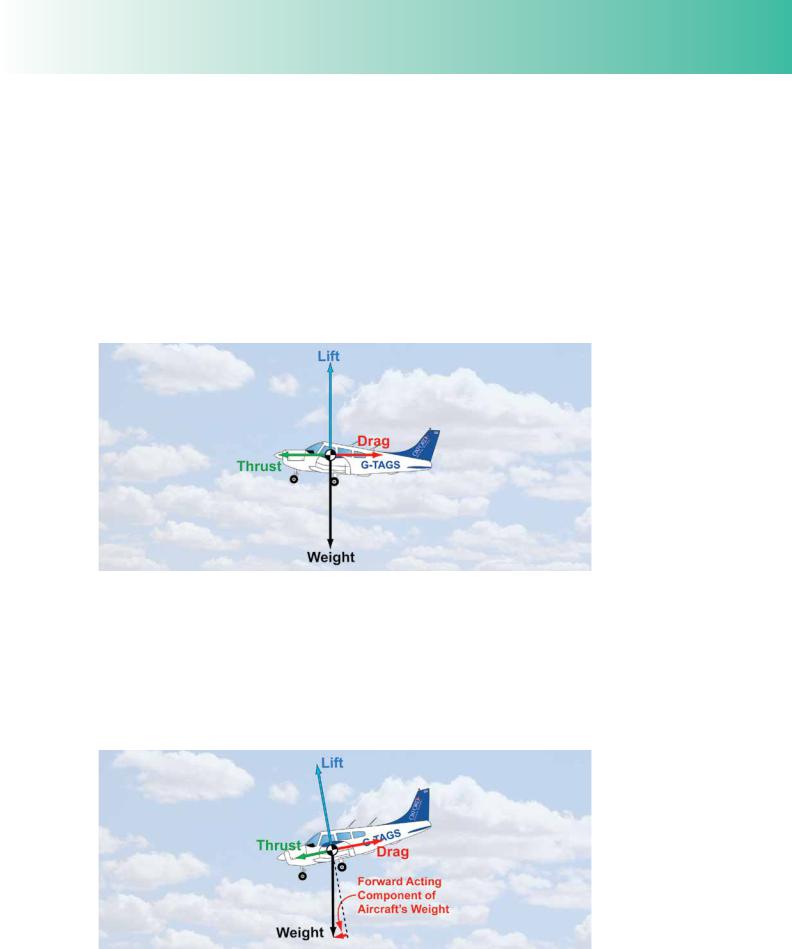
Figure 4.9 depicts an aircraft in level, cruising flight at constant speed, with the four principal flight forces in equilibrium. As you have learnt, one of the main conditions for level flight at constant speed is that thrust must balance drag.
Figure 4.9 In straight and level flight at constant speed, the four principal flight forces are in equilibrium.
In order to initiate a steady descent, thrust is normally reduced by the pilot reducing power. Drag now exceeds thrust. In order to keep the fight forces in equilibrium and maintain speed, the nose of the aircraft must be lowered until the forward-acting component of the aircraft’s weight increases the forward-acting forces to the point where the aerodynamic drag is again balanced. The aircraft is now descending at the same constant speed that it had in level flight, with all flight forces again in equilibrium.
Figure 4.10 A constant-speed descent, with all principal flight forces in equilibrium.
431
Order: 6026
Customer: Oleg Ostapenko E-mail: ostapenko2002@yahoo.com
Customer: Oleg Ostapenko E-mail: ostapenko2002@yahoo.com
CHAPTER 4: EN-ROUTE PERFORMANCE
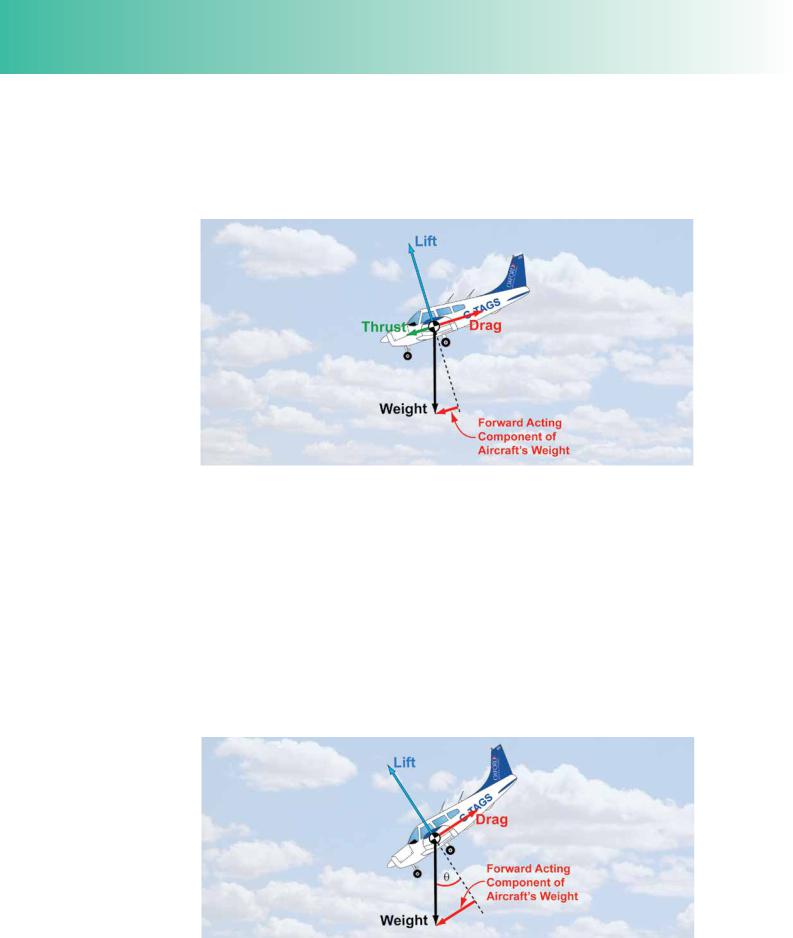
If the pilot closes the throttle further, propeller thrust is again reduced, and the aircraft’s nose must be lowered even more so that the forwards-acting component of weight can maintain the fight forces in equilibrium and maintain speed. This action will further steepen the descent angle. In fact, the greater the margin of drag force over the thrust force, the greater will be the descent angle.
Figure 4.11 The more thrust is reduced, the greater must be the forward-acting component of weight in order to balance aerodynamic drag, and the steeper will be the descent required to maintain a given speed.
Obviously, to descend at a shallower descent angle while maintaining cruising speed, the pilot should reduce power by only a small amount. To descend more steeply while maintaining cruising speed, power should be reduced further.
Glide Angle.
Even though modern engines are extremely reliable, a pilot should always be prepared for an engine-failure. If an engine-failure should occur while on a crosscountry fight, an important consideration for the pilot is that he should quickly identify a suitable feld in which to land. In order to give himself the greatest chance of fnding and reaching a suitable feld, the pilot should aim to fy the aircraft at its best
(shallowest) glide angle. By doing this, a greater distance will be covered before the aircraft descends to ground level.
Figure 4.12 In a steady glide, at constant speed, lift and drag and weight are in equilibrium.
The only propulsive force is the forward-acting component of the aircraft’s weight.
432