

ppl_04_e2
.pdfCustomer: Oleg Ostapenko E-mail: ostapenko2002@yahoo.com
CHAPTER 19
LOW-LEVEL
FORECAST CHARTS
247

Order: 6026
Customer: Oleg Ostapenko E-mail: ostapenko2002@yahoo.com
Customer: Oleg Ostapenko E-mail: ostapenko2002@yahoo.com
C H A P T ER 1 9 : L O W - L EV EL F O R EC A S T C H A R T S
248
ID: 3658
Customer: Oleg Ostapenko E-mail: ostapenko2002@yahoo.com
Customer: Oleg Ostapenko E-mail: ostapenko2002@yahoo.com
C H A P T ER 1 9 : L O W - L EV EL F O
INTRODUCTION.
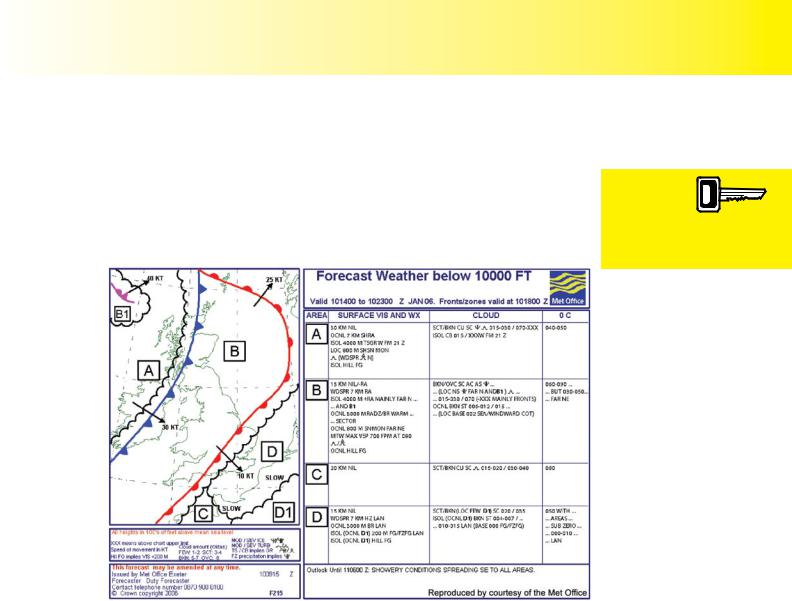
Low level significant weather charts are a valuable aid to successful flight planning for flights which take place below 10 000 feet. These charts indicate, in a precise and very structured format, the meteorological phenomena which are anticipated during a specified time period. In the United Kingdom, this type of chart is commonly referred to as the Form 215. It is produced every 6 hours, 365 days a year for aircraft flying below 10 000 feet over the British Isles.
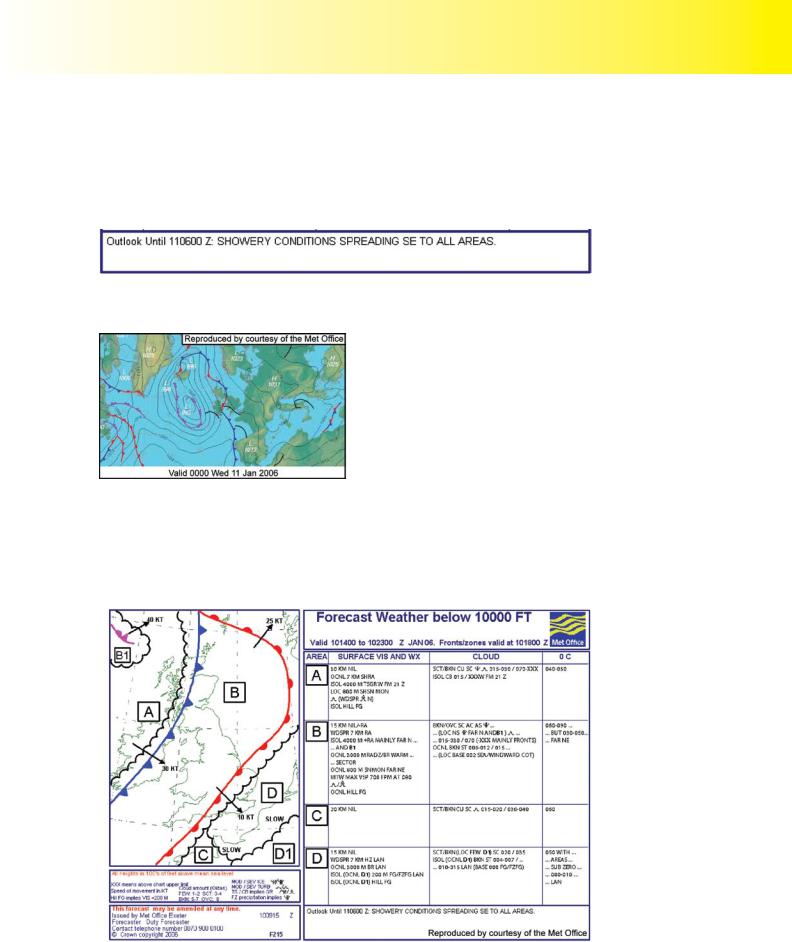
Figure 19.1 Low Level Significant Weather Chart (Form 215).
The example low level forecast chart shown at Figure 19.1 was issued by the United
Kingdom Met Office at 0915 on the 10th day of the month. This fact is indicated in the box at the bottom left of the chart, by the date-time group 100915. In the main title box at the head of the chart, the month is identified as January 2006. As you can see from Figure 19.1, the chart is issued approximately five hours before the start of the validity period, and is valid for a period of nine hours. The precise period of validity of the forecast is clearly identified at the top of each chart. In the example chart, the validity period is between 1400 UTC (indicated by the code letter Z) on the 10th of January, and 2300 UTC, on the same day.
Also marked in the title box is the fact that the frontal systems shown are predicted to be positioned on the chart as at 1800Z.
Currently, in the United Kingdom, Low Level Forecast Charts (Form 215) can be accessed, free of charge, from the UK Met Office website (www.metoffice.gov.uk) under Services for General Aviation.
THE MAP.
The left hand side of the low-level forecast chart features a schematic map showing the positions of any fronts for the specified forecast time, with the different significant weather phenomena divided into areas delineated by black scalloped lines, and identified by letters of the alphabet. Sub areas may have numbers attached to the letters. (See Figure 19.1.)
Form 215 is
issued every 6 hours,
forecasting the
weather up to 10 000 ft. Each issue is valid for 9 hours.
249
Order: 6026
Customer: Oleg Ostapenko E-mail: ostapenko2002@yahoo.com
Customer: Oleg Ostapenko E-mail: ostapenko2002@yahoo.com
C H A P T ER 1 9 : L O W - L EV EL F O R EC A S T C H A R T S
In the Meteorology
Examination there may
be questions requiring the identification of one or more of the labelled features on the Form 215.
The chart uses standard weather symbols, with which you should be familiar.
Any high pressure centres are identified on the map by a small circle and the letter H. Any low pressure centres are identified by a small cross and the letter L.
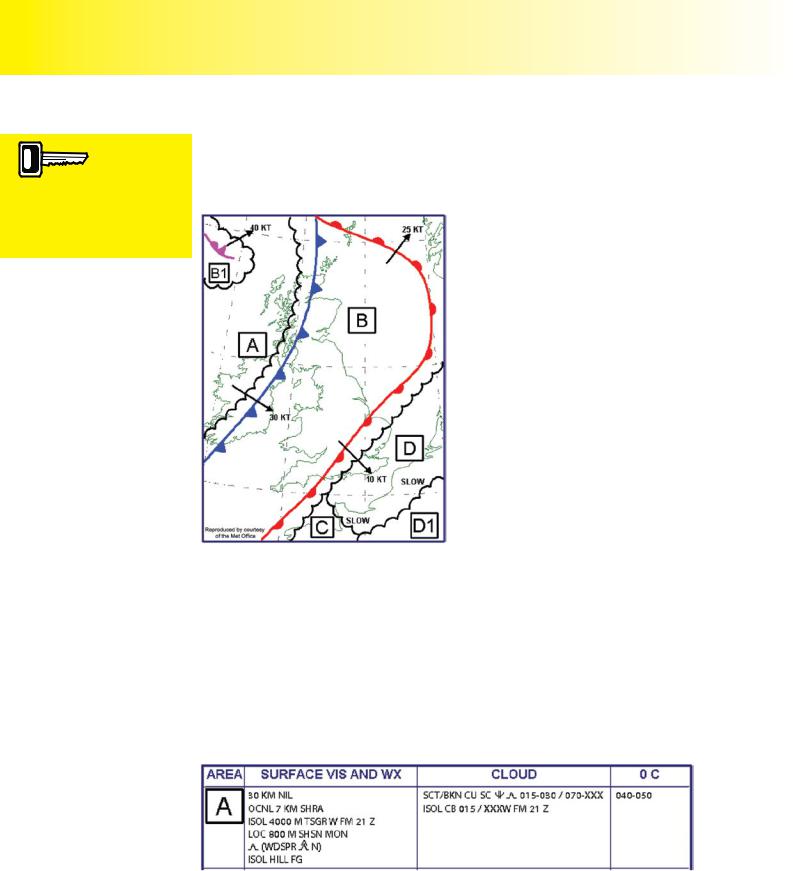
Figure 19.2 Forecast Map at a single forecast time.
Frontal boundaries and areas of weather are clearly displayed using standard symbology. In our example, you can see a warm front running North East - South West, over South East England, and a cold front behind it, of the same orientation, over Northern Scotland and Ireland.
The Form 215 map in Figure 19.2 is divided up into 6 different areas. Each area is linked to the text contained in the main body of the chart by the area letter. The movement of fronts and area boundaries is identified by arrows which indicate the direction of movement.
The numbers which appear beside the arrows indicate the speed in knots at which the feature is moving. If a front or area boundary is stagnant, or moving at less than 5 knots, the word SLOW appears alongside the feature. (See Figure 19.2.)
WEATHER AREA INTERPRETATION.
Let us now look at the textual information which appears in the boxes on the right of the low level significant weather chart. (See Figure 19.1.) As we have mentioned, this forecast information is linked to the different areas of the map by area letters. For each area there are 3 different columns of textual information. Figure 19.3 shows the textual information describing the meteorological conditions in Area A, and we will refer to Area A to begin our examination of the meaning of the text. The textual information is designed to follow the codes used in Terminal Area Forecasts (TAFs), with information appearing in the same order: visibility, weather, cloud.
Figure 19.3 Area A Surface Visibility and Weather.
S u r f a c e V i s i b i l i t y a n d W e a t h e r ( S U R F A
The first text column, (SURFACE VIS AND WX) of the Low Level Forecast Chart, describes the surface visibility and weather phenomena as well as the frequency and distribution of that weather. The codes VIS and WX stand for visibility and weather
250
ID: 3658
Customer: Oleg Ostapenko E-mail: ostapenko2002@yahoo.com
Customer: Oleg Ostapenko E-mail: ostapenko2002@yahoo.com
C H A P T ER 1 9 : L O W - L EV EL F O
respectively. The second column contains the forecast cloud and any associated hazard. The third column details the forecast freezing levels.
The first line of text details the general conditions that are forecast to occur in a weather area. In this case, the general conditions will feature a surface visibility of 30 kilometres with nil weather.
However, some variation in conditions are forecast, within Area A, which may differ from the general conditions in the area. More detail on these variations is provided underneath the general information using the abbreviations OCNL (occasional),
ISOL (isolated), LOC (localised), WDSPR (widespread), and FRQ (frequent).
The variations in the weather include the visibility, the weather phenomena themselves, and further precise detail on when, or where, the weather phenomena will occur, such as on or near coasts, or over land, hills and mountains. These locations are abbreviated to COT (coast), LAN (land), HILL and MON (mountain) respectively. As we have mentioned, the coding used is similar to that used in the TAFs and METARS.
From Figure 19.3, then, we can see the general conditions in Area A are: 30 kilometres visibility with nil weather. However, occasionally the visibility will be 7 kilometres with moderate showers of rain. In isolated areas in the West, expect 4 000 metres visibility with thunderstorms (TS) and moderate hail (GR) from 2100 Zulu. Locally, around the mountains, visibility will be down to 800 metres with moderate snow showers (SHSN). There will, generally, be moderate turbulence ( ), but widespread severe turbulence (WDSPR
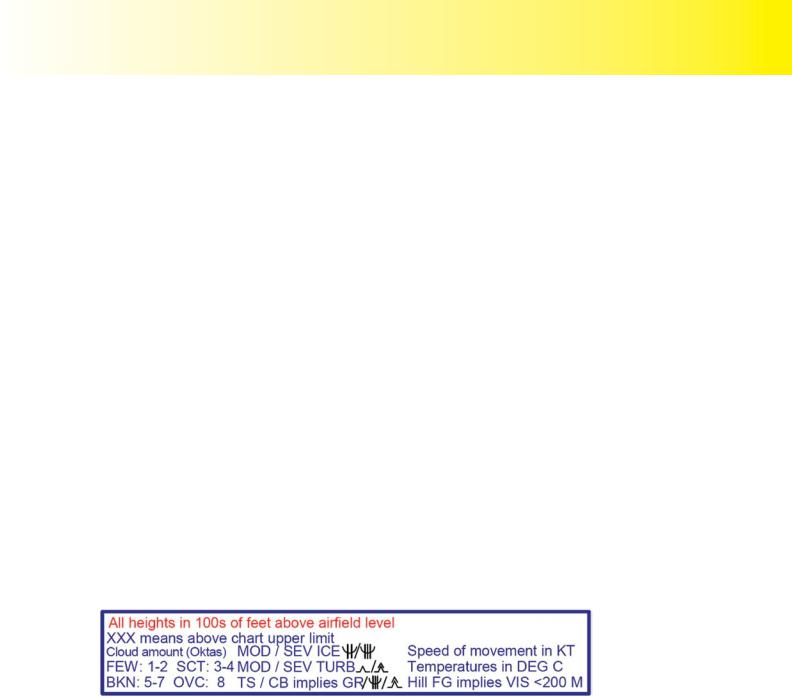
  ) to the North. Lastly, in isolated areas, there will be hill fog. Hill fog implies a visibility of less than 200 metres, as shown by the information in the chart legend. (See Figure 19.4.)
Figure 19.4 Chart Legend.
C l o u d .
The second column of information in the low-level forecast chart relates to the forecast cloud and associated weather hazards. The first line gives the general cloud conditions for the area, with variations detailed in the following lines of text.
The first element in the forecast is always the cloud amount expressed as FEW, SCT (scattered), BKN (broken) or OVC (overcast). Next follows the type of cloud, using the standard cloud abbreviations. Following the cloud type any icing and/or turbulence hazard is given.
Cloud heights come next, indicated as 100s of feet, in the format 030/060 (meaning a base of 3 000 feet with tops at 6 000 feet). If cloud tops exceed 10 000 feet, the code XXX is used.
251
Order: 6026
Customer: Oleg Ostapenko E-mail: ostapenko2002@yahoo.com
Customer: Oleg Ostapenko E-mail: ostapenko2002@yahoo.com
C H A P T ER 1 9 : L O W - L EV EL F O R EC A S T C H A R T S
Severe turbulence,
severe icing and hail are automatically assumed to be
associated with cumulonimbus cloud.
Below, we decode the cloud information for weather Area A, in Figure 19.3.
Generally, throughout the area, there will be scattered to broken cumulus (CU) and stratocumulus (SC) clouds. There will be a risk of moderate icing and moderate turbulence within the cloud. Cloud bases range from 1 500 feet to 3 000 feet above mean sea-level (AMSL), and cloud tops range from 7 000 feet to above 10 000 feet AMSL.
In isolated areas, there may be cumulonimbus clouds with bases of 1 500 feet, and tops extending to above the 10 000 feet chart level, anytime from 2100 UTC.
You should note, especially, that when cumulonimbus clouds are indicated, it is implicit that there will be associated severe icing, severe turbulence and hail.
F r e e zi n g L e v e l .
The last column of information in the low-level forecast chart relates to the freezing level, which is given in hundreds of feet above sea level.
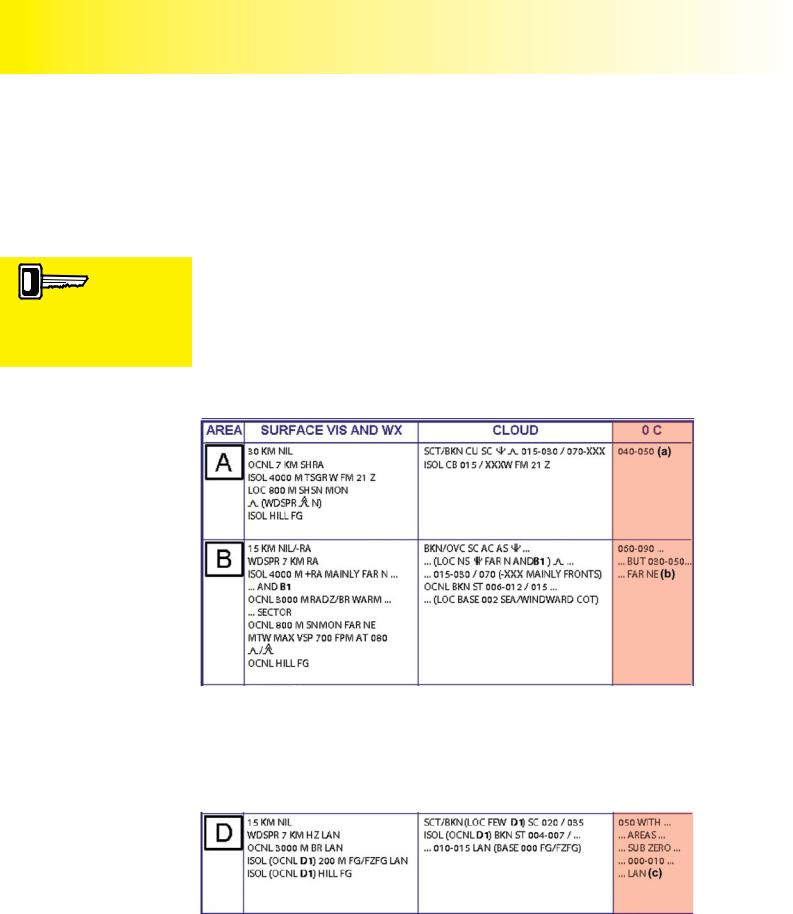
Figure 19.5 Freezing Levels for Area A and B.
In Area A, the freezing level is forecast to be between 4 000 and 5 000 feet.
Moving on to Area B, we see that the freezing level will be between 6 000 and 9 000 feet, but as low as 3 000 to 5 000 feet to the far North-East of the area.
(See Figure 19.5.)
Figure 19.6 Freezing Levels for Area D.
In Area D, the main freezing level is at 5 000 feet, but, over land (LAN), there are sub zero layers of air from the ground to 1 000 feet. (See Figure 19.6.)
252
ID: 3658
Customer: Oleg Ostapenko E-mail: ostapenko2002@yahoo.com
Customer: Oleg Ostapenko E-mail: ostapenko2002@yahoo.com
C H A P T ER 1 9 : L O W - L EV EL F O
THE OUTLOOK.
At the bottom of the chart (Figure 19.7) is the outlook for the 12 hours following the expiry of the main chart, at 1800 Zulu. The outlook does not go into precise detail about cloud heights and weather phenomena, but gives an indication of how the synoptic situation is expected to change.
Figure 19.7 The weather outlook for the 12 hours following the expiry of the main chart.
THE PROGNOSIS.
An additional element of the low-level forecast chart which is not shown on Form 215, itself, but can be found beneath the chart on the Met Office website: www.metoffice.gov.uk, is the prognosis chart. (See Figure 19.8.) The prognosis is a surface pressure chart, showing conditions six hours on from the time given in the main chart for the surface position of the fronts and zones. In the case of our example map,
six hours on from 1800 Zulu, on Tue 10 Jan 06, is midnight. Therefore the chart time for the prognosis would be 0000 UTC on Wed 11 Jan 2006.
SUB AREAS.
Occasionally, when conditions suit, an area will be divided into sub areas.
Figure 19.9 The low-level forecast chart.
253
Order: 6026
Customer: Oleg Ostapenko E-mail: ostapenko2002@yahoo.com
Customer: Oleg Ostapenko E-mail: ostapenko2002@yahoo.com
C H A P T ER 1 9 : L O W - L EV EL F O R EC A S T C H A R T
On our example map, in Figure 19.9, you can see Area B and Sub-Area B1, in the top left hand corner of the chart. A sub area is shown when an area shares many weather characteristics of the main area, but may display one or two important differences.
For example, the first column for Area B on the chart at Figure 19.9 tells us that the general conditions for Area B and, therefore, B1, are 15 km visibility, with possibly nil weather, or light rain. However, with this rain being widespread throughout the area, the visibility will reduce to 7 km with moderate rain.
In isolated areas, in Area B, the visibility will be as low as 4 000 metres in heavy rain, but this visibility will mainly be to the far North of Area B, while it will exist throughout Area B1.
The next few forecast lines do not apply to Area B1 since Area B1, is not in the warm sector, nor does it have mountains or hills.
Looking at the cloud section forArea B, notice that there are local areas of nimbostratus giving a severe icing risk to the North of Area B, and throughout Area B1.
USING LOW-LEVEL FORECAST CHARTS.
Low level forecast charts represent one of the best self-briefing tools for the general aviation pilot and should always form part of pre-flight weather briefing.
As we have mentioned, low level forecast charts can be accessed on the UK Met
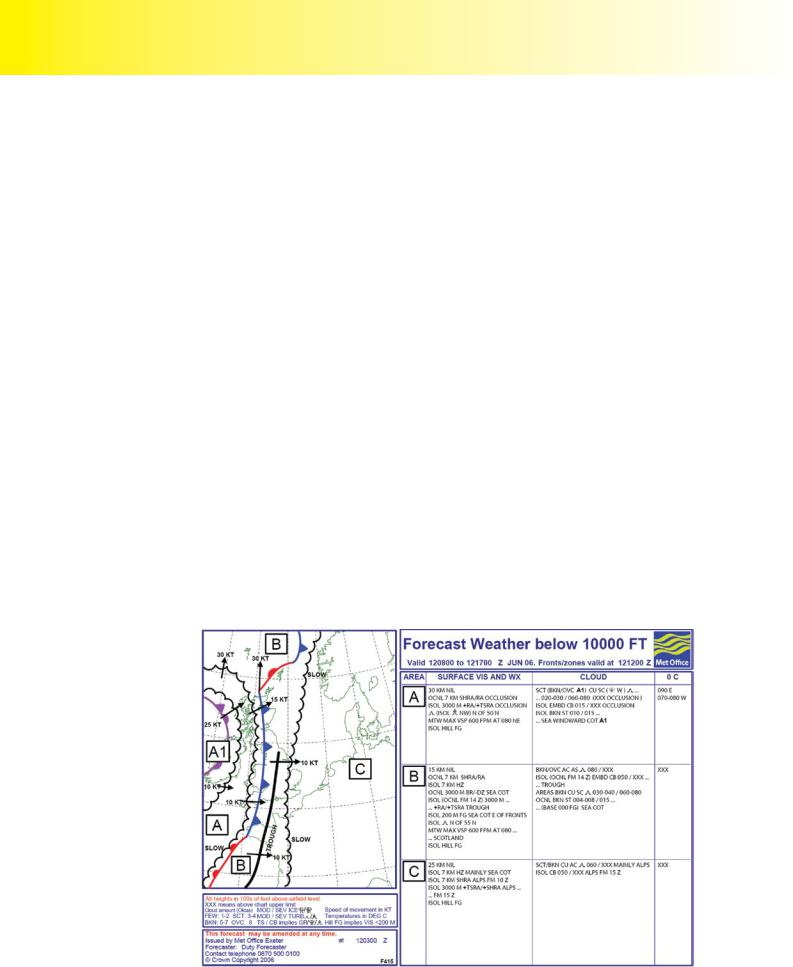
Office website, free of charge. General aviation pilots who plan to fly to Europe may also obtain from the UK Met Office website a chart which encompasses a larger area of the near-continent, called Form 415. An example of a Form 415 is shown at Figure 19.10. Always ensure that you select the appropriate chart to cover the time period for your planned flight. There are four charts produced each day, all of which have different validity periods.
Figure 19.10 Low Level Forecast Chart for the UK and near Continent (Form 415).
254

ID: 3658
Customer: Oleg Ostapenko E-mail: ostapenko2002@yahoo.com
Customer: Oleg Ostapenko E-mail: ostapenko2002@yahoo.com
C H A P T ER 1 9 : L O W - L EV EL F O R EC A
R e p r e s e n t a t i v e P P L - t y p e q u e s t i o n s t o k n o w l e d g e o f L o w - L e v e l F o r e c a s t C h a r t s .
1.Referring to the Form 215 at Chart 1 on Page 257, what is the height of the freezing level over South West England?
a.3 000 feet
b.5 000 feet
c.Between 6 000 feet and 9 000 feet
d.Between 4 000 feet and 5 000 feet
2.Referring to Chart 1 on Page 257, what is the lowest forecast cloud base in weather Area A?
a.3 000 feet
b.7 000 feet
c.>10 000 feet
d.1 500 feet
3.Referring to Chart 1 on Page 257, what is the worst turbulence and icing hazard associated with clouds that is forecast to occur in Area A?
a.Severe icing and severe turbulence
b.Widespread severe turbulence and moderate icing
c.Moderate icing and moderate turbulence
d.Moderate icing
4.Referring to Chart 1 on Page 257 in Area A, to what height above mean sea level are the cumulonimbus cloud tops forecast?
a.10 000 feet
b.15 000 feet
c.>10 000 feet
d.8 000 feet
5.Referring to Chart 1 on Page 257, what will be the general weather situation in Area B?
a.Broken or overcast stratocumulus
b.Nil weather with 30 kilometres visibility
c.Nil weather but occasional hill fog
d.Generally either nil weather or light rain with widespread outbursts of rain with isolated heavy showers in the far North
6.Referring to Chart 2 on Page 258, what is the lowest forecast surface visibility over central France?
a.7 km
b.2 000 m
c.300 m
d.<200 m on the hills
255

Order: 6026
Customer: Oleg Ostapenko E-mail: ostapenko2002@yahoo.com
Customer: Oleg Ostapenko E-mail: ostapenko2002@yahoo.com
C H A P T ER 1 9 : L O W - L EV EL F O R EC A S T C H A R T S Q U
7.Referring to Chart 1 on Page 257, in Area D what would be the surface visibility and weather for a flight over the English Channel?
a.15 km visibility with nil weather
b.Widespread 7 km visibility in haze
c.Occasional 3 000 m visibility in fog
d.Isolated 200 m visibility in fog
8.Referring to Chart 2 on Page 258, what are the general weather and visibility conditions expected in the Southern part of the North Sea, just off the German and Danish coast?
a.Showers
b.Nil weather, 20 kilometres visibility
c.Widespread rain and drizzle
d.Isolated hill fog
Question |
1 |
2 |
3 |
4 |
5 |
6 |
7 |
8 |
|
|
|
|
|
|
|
|
|
Answer |
|
|
|
|
|
|
|
|
T h e a n s w e r s t o t h e s e q u e s t i o n s c a n b e
256