

Table 1.1 Summary of long-term clinical outcome studies in schizophrenia.
Table reproduced with permission from Frangou S, Murray RM. Schizophrenia. London: Martin Dunitz, 1997
|
Years of |
Number of |
Good clinical |
Poor clinical |
Social recovery |
Study |
follow-up |
patients |
outcome (%) |
outcome (%) |
(%) |
|
|
|
|
|
|
|
|
|
|
|
|
Ciompi 198011,12 |
37 |
289 |
27 |
42 |
39 |
Bleuler 197813 |
23 |
208 |
20 |
24 |
51 |
Bland & Orne 197814 |
14 |
90 |
26 |
37 |
65 |
Salokangas 198315 |
8 |
161 |
26 |
24 |
69 |
Shepherd et al., 198916 |
5 |
49 |
22 |
35 |
45 |
|
|
|
|
|
|
to 10% and the overall rate of suicide in schizophrenia is estimated to be in the region of 10% (Figure 1.20).
FACTORS AFFECTING PROGNOSIS
Certain clinical features are associated with a poor prognosis: early or insidious onset, male sex, negative symptoms19,20 (Figure 1.8), lack of a prominent affective component or clear precipitants, family history of schizophrenia, poor premorbid personality, low IQ, low social class, social isolation, and significant past psychiatric history.
Several studies have demonstrated an association between longer duration of untreated illness and poorer outcome. For example, Loebel and colleagues21 found that a longer duration of both psychotic and prodromal symptoms prior to treatment was associated with a lesser likelihood of remission. The longer the duration of pretreatment psychotic symptoms, the longer the time to remission. These data suggest that early detection and intervention in schizophrenia may be important in minimizing subsequent disability.
COURSE OF SCHIZOPHRENIA (THEORETICAL MODEL)
Course |
|
|
|
|
|
|
Deteriorating |
|
Stable |
|
Improving |
|
|
10 |
20 |
30 |
40 |
50 |
60 |
70 |
|
|
|
Years |
|
|
|
Figure 1.19 Breier and colleagues18 among others have suggested that, despite the heterogeneity of schizophrenia, a model of a common course of illness can be derived. Based on evidence from their own studies and other longterm follow-up studies they describe an earlier deteriorating phase usually lasting some 5 years. During this time there is a deterioration from premorbid levels of functioning, often characterized by frank psychotic relapses. After this phase much less fluctuation can be expected and the illness enters a ‘stabilization’ or ‘plateau’ phase. This period may continue into the fifth decade, when there is a third ‘improving’ phase for many patients. Figure reproduced with permission from Breier A, Schreiber JL, Dyer J, Pickar D. National Institute of Mental Health longitudinal study of chronic schizophrenia. Prognosis and predictors of outcome. Arch Gen Psychiatry 1991;48:239–46
©2002 CRC Press LLC

Self-portrait 11–16 April 1991
May 6: has turned himself into a dartboard. ‘I feel like a target for people’s cruel remarks. What is going on? I have sweet talked a girl to suicide because I had no tongue, no real tongue and could only flatter.’
April 20: ‘Very paranoid...The person upstairs is reading my mind and speaking back to me in a sort of ego crucifixion...The large rabbit ear is because I am confused and extremely sensitive to human voices, like a wild animal.’
May 18: acutely disturbed. ‘My mind seems to be thought-broadcasting very severely and it is beyond my will to do anything about it...I have summed this up by painting my brain as an enormous mouth.’
June 27 (left): This is Bryan’s most complex picture. He feels he is ‘closing in’ on the essential image of schizophrenia. He feels transparent. ‘I make crazy attempts at some sort of control over what has become an impossible situation (the man with the control stick). My brain, my ego is transfixed by nails as the Christ who could not move freely on the cross without severe pain. So I find I cannot think without feelings of pain.’ The red muzzled beast symbolizes silent anger. ‘My senses are being bent by fear into hallucinations.’
April 29: Bryan has turmoil in his mind. The features in his portrait have become fragmented. He feels lonely and exposed, as on a stage. ‘A strange spiritual force is making me feel I should not smoke or I will incur a disaster.’
May 23: ‘The blue is there because I feel depressed, through cutting back on the antidepressants...the wavy lines are because just as I feel I am safe, a voice from the street guts me emotionally by its ESP of my conditions...I am so pleased that I have been able to express such a purely mental concept as thought-broadcasting by the simple device of turning the brain into a mouth.’
Figure 1.20 A series of self-portraits by Bryan Charnley which vividly illustrate his experiences as he came off medication. His descent into paranoia, hallucinations and depression is graphically depicted and explained with reference to his diary entries. Sadly the series ended with his death from suicide. Figures reproduced with kind permission of Mr Terence Charnley
©2002 CRC Press LLC

REFERENCES
1.Haslam J. Illustrations of Madness. London, 1810
2.Kraepelin E. Psychiatrie: Ein Lehruch fur Studierende und Arzte, 5th edn. Leipzig, Germany: JA Barth, 1896
3Kraepelin E. Psychiatrie: Ein Lehruch fur Studierende und Arzte, 6th edn. Leipzig, Germany: JA Barth, 1899
4.Kraepelin E. Dementia Praecox and Paraphrenia
[1919]. Robertson GM, ed; Barclay RM, trans. New York, NY: Robert E. Kreiger, 1971
5.Bleuler E. Dementia Praecox or the Group of Schizophrenias. Madison, CT: International Universities Press, 1950
6.Schneider K. Clinical Psychopathology. Hamilton MW, trans. London, UK: Grune and Stratton, 1959
7.World Health Organization. Report of the International Pilot Study of Schizophrenia. Geneva: WHO, 1979
8.American Psychiatric Association. Diagnostic and Statistical Manual, 4th Edition Revised (DSM–IV). Washington, DC: APA, 1994
9.World Health Organisation. The International Classification of Diseases, 10th Edition (ICD–10). Geneva: WHO, 1992
10.Jones P, Rodgers B, Murray R, et al. Child development risk factors for adult schizophrenia in the British 1946 birth cohort. Lancet 1994;344: 1398–1402
11.Ciompi L. Catamnestic long-term study of the course of life and aging in schizophrenia. Schizophr Bull 1980;6:606–18
12.Ciompi L. The natural history of schizophrenia in the long term. Br J Psychiatry 1980;136:413–20
13.Bleuler M. The long-term course of schizophrenic psychoses. Psychol Med 1974;4:244–54
14.Bland RC, Orn H. 14-year outcome in early schizophrenia. Acta Psychiatr Scand 1978;58:327–38
15.Salokangas RK. Prognostic implications of the sex of schizophrenic patients. Br J Psychiatry 1983;142: 145–51
16.Shepherd M, Watt D, Falloon I, et al. The natural history of schizophrenia: a five-year follow-up study of outcome prediction in a representative sample of schizophrenics. Psychol Med Monogr 1989;15 (Suppl.):1–46
17.Frangou S, Murray RM. Schizophrenia. London: Martin Dunitz, 1997
18.Breier A, Schreiber JL, Dyer J, Pickar D. National Institute of Mental Health longitudinal study of chronic schizophrenia. Prognosis and predictors of outcome. Arch Gen Psychiatry 1991;48:239–46
19.Johnstone EC, Frith CD, Crow TJ, et al. The Northwick Park ‘Functional’ psychoses study: diagnosis and outcome. Psychol Med 1992;22:331–46
20.Johnstone EC, Crow TJ, Frith CD, Owens DG. The Northwick Park ‘Functional’ psychoses study: diagnosis and treatment response. Lancet 1988; 2:119–25
21.Loebel AD, Lieberman JA, Alvir JM, et al. Duration of psychosis and outcome in first-episode schizophrenia. Am J Psychiatry 1992;149:1183–8
©2002 CRC Press LLC

CHAPTER 2
Epidemiology and risk factors
The incidence of schizophrenia in industrialized |
|
|
environmental risk factors (e.g. overcrowding, |
||||||||||||||||||||||||||||||||
countries is in the region of 10–70 new cases per |
|
|
drug abuse) may also be operating. |
||||||||||||||||||||||||||||||||
100000 population per year1, and the lifetime risk |
|
|
|
|
The onset of the disease is characteristically |
||||||||||||||||||||||||||||||
is 0.5–1%. The geographical distribution of |
|
|
between the ages of 20 and 39 years, but may |
||||||||||||||||||||||||||||||||
schizophrenia is not random: recent studies have |
|
|
occur before puberty or be delayed until the |
||||||||||||||||||||||||||||||||
shown that there is an increased first-onset rate in |
|
|
seventh or eighth decade. The peak age of onset is |
||||||||||||||||||||||||||||||||
people born or brought up in inner cities (Figure |
|
|
20–28 years for men and 26–32 years for women1 |
||||||||||||||||||||||||||||||||
2.1)2. There is also a significant socioeconomic |
|
|
(Figure 2.2). The overall sex incidence is equal if |
||||||||||||||||||||||||||||||||
gradient, with an increased prevalence in the |
|
|
broad diagnostic criteria are used, but there is |
||||||||||||||||||||||||||||||||
lower socioeconomic classes. ‘Social drift’, both in |
|
|
some evidence for an excess in men if more |
||||||||||||||||||||||||||||||||
social class, and into deprived areas of the inner |
|
|
stringent diagnostic criteria, weighted towards the |
||||||||||||||||||||||||||||||||
cities, may account for part of this, but specific |
|
|
more severe end of the diagnostic spectrum, are |
||||||||||||||||||||||||||||||||
|
|
|
|
|
|
|
|
|
|
|
|
|
|
|
|
|
|
|
|
|
|
|
|
|
|
|
|
|
|
|
|
|
|
|
|
|
RELATIVE RISK OF SCHIZOPHRENIA |
|
|
|
|
|
|
|
Figure 2.1 Adjusted relative risk of schizo- |
||||||||||||||||||||||||||
|
|
|
|
|
|
|
|
phrenia in Denmark according to place of |
|||||||||||||||||||||||||||
|
ACCORDING TO PLACE OF BIRTH |
|
|
|
|
|
|
|
|
|
birth, with rural area used as the reference |
||||||||||||||||||||||||
|
|
|
|
|
|
|
|
|
|
|
|
|
|
|
|
|
|
|
|
|
|
|
|
|
|
|
|
|
|
|
|
|
|
|
category (*). Data from reference 2 |
|
|
|
|
|
|
|
|
|
|
|
|
|
|
|
|
|
|
|
|
|
|
|
|
|
|
|
|
|
|
|
|
|
|
|
|
|
Capital |
|
|
|
|
|
|
|
|
|
|
|
|
|
|
|
|
|
|
|
|
|
|
|
|
|
|
|
|
|
|
|
|
|
|
|
|
|
|
|
|
|
|
|
|
|
|
|
|
|
|
|
|
|
|
|
|
|
|
|
|
|
|
|
|
|
|
|
|
||
|
|
|
|
|
|
|
|
|
|
|
|
|
|
|
|
|
|
|
|
|
|
|
|
|
|
|
|
|
|
|
|
|
|
||
|
|
|
|
|
|
|
|
|
|
|
|
|
|
|
|
|
|
|
|
|
|
|
|
|
|
|
|
|
|
|
|
|
|
|
|
|
Suburb of capital |
|
|
|
|
|
|
|
|
|
|
|
|
|
|
|
|
|
|
|
|
|
|
|
|
|
|
|
|
|
|
|
|
|
|
|
|
|
|
|
|
|
|
|
|
|
|
|
|
|
|
|
|
|
|
|
|
|
|
|
|
|
|
|
|
|
|
|
|
||
|
|
|
|
|
|
|
|
|
|
|
|
|
|
|
|
|
|
|
|
|
|
|
|
|
|
|
|
|
|
|
|
|
|
|
|
|
Provincial city |
|
|
|
|
|
|
|
|
|
|
|
|
|
|
|
|
|
|
|
|
|
|
|
|
|
|
|
|
|
|
|
|
|
|
|
|
|
|
|
|
|
|
|
|
|
|
|
|
|
|
|
|
|
|
|
|
|
|
|
|
|
|
|
|
|
|
|
|
||
|
|
|
|
|
|
|
|
|
|
|
|
|
|
|
|
|
|
|
|
|
|
|
|
|
|
|
|
|
|
|
|
|
|
|
|
|
Provincial town |
|
|
|
|
|
|
|
|
|
|
|
|
|
|
|
|
|
|
|
|
|
|
|
|
|
|
|
|
|
|
|
|
|
|
|
|
|
|
|
|
|
|
|
|
|
|
|
|
|
|
|
|
|
|
|
|
|
|
|
|
|
|
|
|
|
|
|
|
||
|
|
|
|
|
|
|
|
|
|
|
|
|
|
|
|
|
|
|
|
|
|
|
|
|
|
|
|
|
|
|
|
|
|
|
|
|
Rural area* |
|
|
|
|
|
|
|
|
|
|
|
|
|
|
|
|
|
|
|
|
|
|
|
|
|
|
|
|
|
|
|
|
|
|
|
|
|
|
|
|
|
|
|
|
|
|
|
|
|
|
|
|
|
|
|
|
|
|
|
|
|
|
|
|
|
|
|
|
|
|
|
Greenland |
|
|
|
|
|
|
|
|
|
|
|
|
|
|
|
|
|
|
|
|
|
|
|
|
|
|
|
|
|
|
|
|
|
|
|
|
|
|
|
|
|
|
|
|
|
|
|
|
|
|
|
|
|
|
|
|
|
|
|
|
|
|
|
|
|
|
|
|
||
|
|
|
|
|
|
|
|
|
|
|
|
|
|
|
|
|
|
|
|
|
|
|
|
|
|
|
|
|
|
|
|
|
|
|
|
|
Other countries |
|
|
|
|
|
|
|
|
|
|
|
|
|
|
|
|
|
|
|
|
|
|
|
|
|
|
|
|
|
|
|
|
|
|
|
|
|
|
|
|
|
|
|
|
|
|
|
|
|
|
|
|
|
|
|
|
|
|
|
|
|
|
|
|
|
|
|
|
||
|
|
|
|
|
|
|
|
|
|
|
|
|
|
|
|
|
|
|
|
|
|
|
|
|
|
|
|
|
|
|
|
|
|
|
|
|
Unknown |
|
|
|
|
|
|
|
|
|
|
|
|
|
|
|
|
|
|
|
|
|
|
|
|
|
|
|
|
|
|
|
|
|
|
|
|
|
|
|
|
|
|
|
|
|
|
|
|
|
|
|
|
|
|
|
|
|
|
|
|
|
|
|
|
|
|
|
|
||
|
|
|
|
|
|
|
|
|
|
|
|
|
|
|
|
|
|
|
|
|
|
|
|
|
|
|
|
|
|
|
|
|
|
|
|
|
|
|
|
|
|
|
|
|
|
|
|
|
|
|
|
|
|
|
|
|
|
|
|
|
|
|
|
|
|
|
|
|
|
|
|
0 |
1 |
|
|
|
2 |
3 |
|
4 |
|
|
5 |
6 |
7 |
|
|
||||||||||||||||||||
|
|
|
|
|
|
|
|
|
|
Relative risk (95% Cl) |
|
|
|
|
|
|
|
|
|||||||||||||||||
|
|
|
|
|
|
|
|
|
|
|
|
|
|
|
|
|
|
|
|
|
|
|
|
|
|
|
|
|
|
|
|
|
|
|
|
|
|
|
|
|
|
|
|
|
|
|
|
|
|
|
|
|
|
|
|
|
|
|
|
|
|
|
|
|
|
|
|
|
|
|
|
|
|
|
|
|
|
|
|
|
|
|
|
|
|
|
|
|
|
|
|
|
|
|
|
|
|
|
|
|
|
|
|
|
|
|
|
©2002 CRC Press LLC
INCIDENCE OF SCHIZOPHRENIA BY GENDER
population |
60 |
|
|
|
|
|
|
|
50 |
|
|
|
|
|
Males |
|
|
|
|
|
|
Females |
|
|||
40 |
|
|
|
|
|
|
|
|
000 |
|
|
|
|
|
|
|
|
|
|
|
|
|
|
|
|
|
per 100 |
30 |
|
|
|
|
|
|
|
20 |
|
|
|
|
|
|
|
|
Rates |
10 |
|
|
|
|
|
|
|
|
0 |
|
|
|
|
|
|
|
|
0–15 |
16–25 |
26–35 |
36–45 |
46–55 |
56–65 |
66–75 |
76+ |
Age at onset (years)
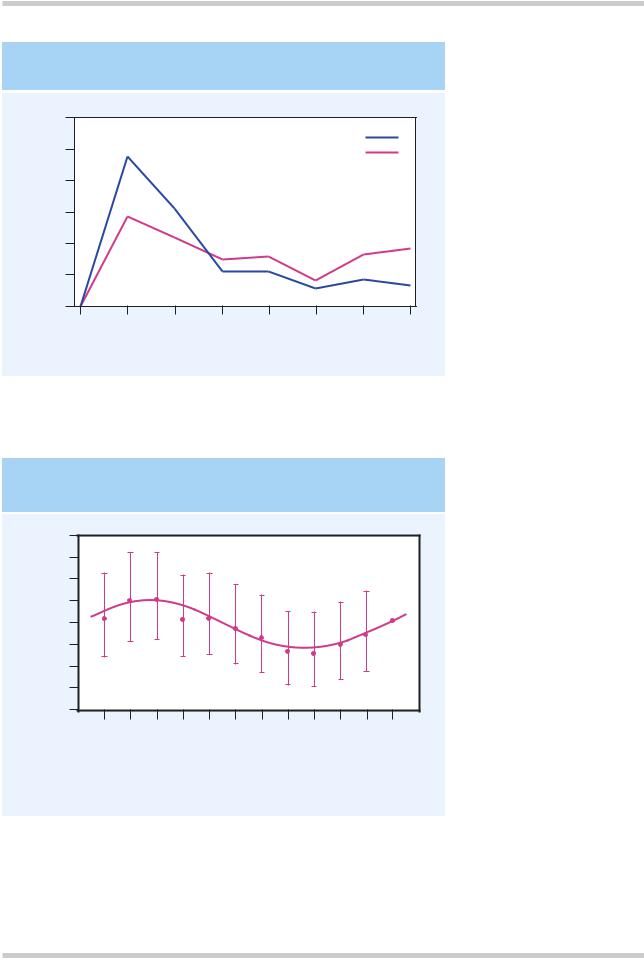
Figure 2.2 This graph shows the incidence rate per 100 000 population for broadly defined schizophrenia in an inner city area of London (Camberwell). Although the overall rate is similar in males and females, mean onset in women is slightly later. Figure reproduced with permission from Castle E, Wessely S, Der G, Murray RM. The incidence of operationally defined schizophrenia in Camberwell 1965–84. Br J Psychiatry
1991;159:790–4
RELATIVE RISK OF SCHIZOPHRENIA
ACCORDING TO MONTH OF BIRTH
|
1.4 |
|
1.3 |
risk |
1.2 |
1.1 |
|
Relative |
1.0 |
|
|
|
0.9 |
0.8
0.7
0.6
January |
Ma |
April May June |
July |
|
|
|
February |
rch |
|
|
|
October |
|
|
|
|
|
|||
|
|
|
|
September |
NovemberDecember |
|
Month of birth
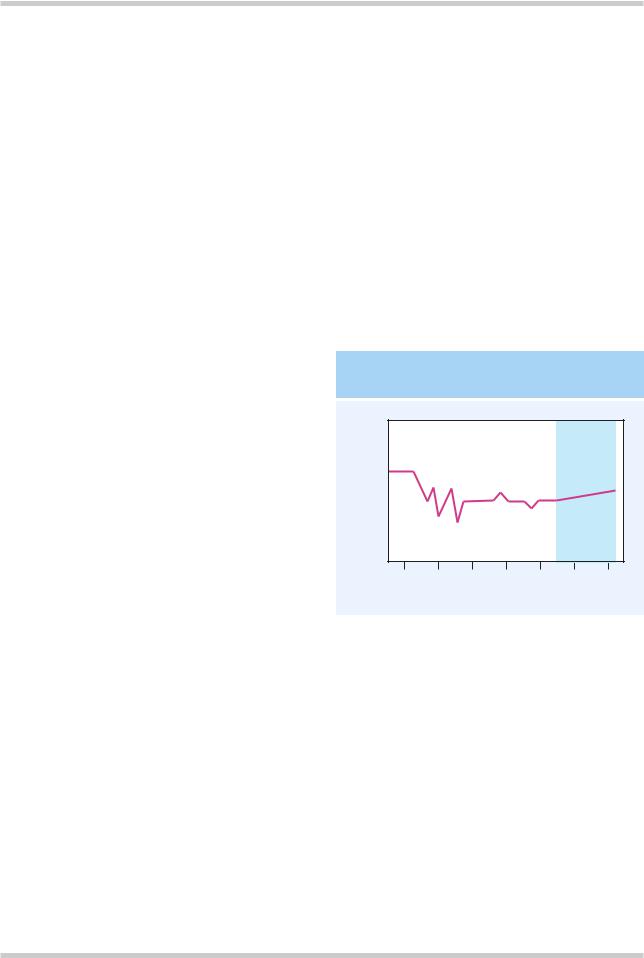
Figure 2.3 This graph is based on a population cohort of 1.75 million people from the civil registration system in Denmark. The data points and vertical bars show the relative risks and 95% confidence intervals, respectively, with the month of birth analyzed as a categorical variable. The curve shows the relative risk as a fitted sine function of the month of birth (the reference category is December). Figure reproduced with permission from Mortensen PB, Pedersen CB, Westergaard T, et al. Effects of family history and place and season of birth on the risk of schizophrenia. N Engl J Med
©2002 CRC Press LLC

applied. The prevalence of schizophrenia is considerably higher in the unmarried of both sexes. There is a small excess of patients born during the late winter and early spring months in both northern and southern hemispheres (and a less wellknown decrement in late summer (Figure 2.3)2.
People with schizophrenia have a twofold increase in age-standardized mortality rates, and are more likely to suffer from poor physical health. Much of the increased mortality occurs in the first few years after initial admission or diagnosis. Contributing factors early in the course include suicide, with later factors, such as cardiovascular disorders, due in part to the poor lifestyle of many patients, with heavy cigarette smoking and obesity being common.
THE RISK FACTOR MODEL OF
SCHIZOPHRENIA
It is often said that schizophrenia is a disease of unknown etiology. This is no longer true. Schizophrenia is like other complex disorders such as ischemic heart disease, which have no single cause but are subject to a number of factors that increase the risk of the disorder. Some of the risk factors for schizophrenia are summarized in Figure 2.4. Schizophrenia, however, differs from disorders such as ischemic heart disease in that we do not understand the pathogenic mechanisms linking the risk factors to the illness, i.e. we do not understand how the causes ‘cause’ schizophrenia.
THE DEVELOPMENTAL RISK FACTOR MODEL
|
|
|
|
Dysplastic |
|
|
|
|
|
|
|
||
|
|
|
|
networks |
|
|
|
Childhood |
|
|
Cognitive |
|
|
|
vulnerability |
|
|
impairment |
|
|
|
|
|
Social difficulties |
|
||
|
|
|
|
|
|
|
|
|
|
|
|
|
|
BIRTH |
ADOLESCENCE |
|
|
Psychosis |
||
|
|
|
|
|
|
|
|
|
|
|
|
|
|
|
Early causes |
|
Late causes |
|
|
|
|
||
|
(genetic, obstetric |
|
(life events, |
|
|
complications) |
|
drug abuse) |
|
|
|
|
|
|
|
|
|
|
|
Figure 2.4 Causality over the life course. Risk factors for schizophrenia occur both early and late in the life course, and interact with each other in a complex fashion
©2002 CRC Press LLC
LIFETIME RISK OF DEVELOPING SCHIZOPHRENIA
General population Spouses of patient
First cousins (third degree)
Uncles, aunts
Second-degree relatives
Nephews, nieces Grandchildren
Half siblings 
Children
Siblings 
First-degree relatives
Siblings with one schizophrenic parent Dizygotic twins
Parents
Monozygotic twins  Offspring of dual matings
0 |
10 |
20 |
30 |
40 |
50 |
Lifetime risk of developing schizophrenia (%)
Figure 2.5 Lifetime risk of developing schizophrenia in relatives of schizophrenic individuals. Data from reference 3
CONCORDANCE RATES FOR SCHIZOPHRENIA FROM TWIN STUDIES
|
Monozygotic |
|
|
|
Dizygotic |
|
|
|
|
|
|||
|
|
|
|
|
|
|
|
|
|
|
|
|
|
|
Number |
Concordance |
|
|
|
Number |
Concordance |
||||||
Study |
of pairs |
rate (%) |
|
|
|
of pairs |
rate (%) |
||||||
|
|
|
|
|
|
|
|
|
|
|
|
|
|
Kringlen6 |
55 |
45 |
|
|
|
90 |
15 |
|
|
||||
|
|
|
|
|
|
|
|
|
|
|
|
|
|
Fischer7 |
21 |
|
|
|
56 |
|
|
41 |
26 |
|
|||
Shields & |
|
|
|
|
|
|
|
|
|
|
|
|
|
22 |
|
|
|
58 |
|
|
33 |
12 |
|
|
|||
Gottesman4 |
|
|
|
|
|
|
|
||||||
|
|
|
|
|
|
|
|
|
|
|
|
|
|
Tienari8 |
17 |
35 |
|
|
|
|
|
20 |
13 |
|
|
||
Pollin et al.9 |
95 |
|
|
|
|
|
|
125 |
|
|
|
|
|
43 |
|
|
|
9 |
|
|
|
||||||
Cardno et al.10 |
|
|
|
|
|
|
|
|
|
|
|
|
|
49 |
41 |
|
|
|
|
57 |
5 |
|
|
|
|
||
|
|
|
|
|
|
|
|
|
|
|
|
|
|
Figure 2.6 Concordance rates for schizophrenia in studies of monozygotic and dizygotic twins. The implication of the lack of 100% concordance in monozygotic twins is that there must be e n v i r o n m e n t a l etiological factors involved in the genesis of schizophrenia. Data from references 4–10
©2002 CRC Press LLC