

Учебники / Middle Ear Mechanics in Research and Otology Huber 2006
.pdfInanotherstudy,theipsilateralvibrationtransmissionwasmeasuredwhere the distance between the stimulation position and the ear canal opening increased by 10 mm for each new stimulation position. By comparing the decreased cochlear stimulation for each new stimulation position with the attenuation obtained when the stimulation position was moved over the sutura squamosa, the influence of the suture on BC transmission could be estimated. For frequencies below approximately 1.5 kHz, no significant di erence was found while at frequencies above 1.5 kHz about 2 dB extra damping was caused by the suture. Hence, an extra high frequency loss of about 2 dB is found when the stimulation is behind this suture compared with in front of the same suture.
4. BC influence on hearing protectors
A hearing protection device (HPD) usually attenuates the sound field in (ear plugs) or just outside (ear mu s) the ear canal. In extremely noisy environments a combination of ear plugs and ear mu s can be used to obtain greater attenuation. The sound field is transmitted to the ear by three different routes: (1) the normal AC route, (2) by sound induced in the skull bone (BC), and (3) sound induced in the hard and soft tissues of the body that is transmitted to the cochlea by the skeleton and surrounding tissues (termed body conduction). For simplicity, the two latter are not separated but treated as a single entity termed BC.
The HPDs aims at reducing the AC transmission. However, due to the placement in or outside the ear canal, they cause an occlusion e ect improving the BC sensitivity at low frequencies. The AC transmission from a sound field is 50 to 60 dB better than the BC transmission for frequencies up to 1 kHz, 40 to 50 dB greater around 2 kHz, improving to 50 to 60 dB at 4 kHz, to decrease again to 40 to 50 dB at 8 kHz. Hence, the maximal
8attenuation achievable with HPDs is 50 to 60 dB at low frequencies and 40 to 60 dB at higher frequencies; above these levels the BC transmission dominates and increasing the attenuation of the HPD does not increase the attenuation for the sound reaching the cochlea. However, due to the occlusion e ect from the HPD, the achieved attenuation is often much lower than the theoretical limit. For example, at low frequencies an ear plug may produce up to 40 dB occlusion e ect and with a theoretical limit for the BC sensitivity of 60 dB the resulting attenuation may be reduced to merely 20 dB.

References
1.von Békésy G., Zur Theorie des Hörens bei der Schallaufnahme durch Knochenleitung. Ann Physik 13 (1932) pp. 111–136
2.Wever E.G. and Lawrence M., Physiological Acoustics (Princeton University Press, Princeton 1954) pp. 240
3.Khanna S.M., Tonndorf J. and Queller J., Mechanical parameters of hearing by bone conduction. J. Acoust. Soc. Am. 60 (1976) pp. 139–154
4.AllenG.andFernandezC.,Themechanismofboneconduction.AnnOtol.Rhinol. Laryngol. 69 (1960) pp. 5–28
5.Brinkman W., Marres E. and Tolk J., The mechanism of bone conduction. Acta Otolaryngol. 59 (1965) pp. 109–115
6.Tonndorf J., Bone conduction: studies in experimental animals. Acta Otolaryngol. Suppl. 213 (1966) pp. 1–132
7.Stenfelt S., Wild T., Hato N. and Goode R.L., Factors contributing to bone conduction: the outer ear. J. Acoust. Soc. Am. 113 (2003) pp. 902–913
8.Stenfelt S., Hato N. and Goode R.L., Factors contributing to bone conduction: the middle ear. J. Acoust. Soc. Am. 111 (2002) pp. 947–959
9.Stenfelt S., Middle ear ossicles motion at hearing thresholds with air conduction
and bone conduction stimulation. J. Acoust. Soc. Am. 119 (2006) pp. 2848–2858 10. Stenfelt S. and Goode R.L., Bone conducted sound: Physiological and clinical
aspects. Otol. Neurotol. 26 (2005) pp. 1245–1261
11. Stenfelt S. and Goode R.L., Transmission properties of bone conducted sound: Measurements in cadaver heads. J. Acoust. Soc. Am. 118 (2005) pp. 2373–2391
12. Freeman S., Sichel J.Y. and Sohmer H., Bone conduction experiments in animals: evidence for a non-osseous mechanism. Hear. Res. 146 (2000) pp. 72–80
9

MIDDLE EAR STATIC PRESSURE: MEASUREMENT,
REGULATION AND EFFECTS ON MIDDLE EAR MECHANICS
J.J.J. Dirckx, Laboratory of Biomedical Physics, Department of Physics, University of Antwerp Groenenborgerlaan 171, B 2020 Antwerp, Belgium Email: Joris.Dirckx@ua.ac.be
The middle ear is a semi-rigid biological gas pocket which is closed most of the time. It is believed that pressure in the middle ear (ME) is regulated by a complex combined action of the Eustachian tube muscles, eardrum deformation and gas exchange with the blood circulating in the mucosal lining. Sudden pressure variations of thousands of kPa occur in everyday situations and can be slow as well as fast. Both external pressure changes and ME gas exchange processes generate di erences between the ME and ambient pressure. To understand the mechanisms and e ects involved with quasistatic high amplitude pressure variations, we need to know how middle ear pressure varies in normal circumstances, investigate both fast and slow regulation mechanisms, and determine the e ect of such pressures on middle ear mechanics. To measure the normal variations in middle ear pressure, we developed a monitoring system which is used in ambulant patients. We will show some results from direct measurements
10in intact ears. To investigate a possible fast regulation process, we performed measurements of eardrum deformation in gerbils. We found that volume displacement of the pars flaccida is small compared to middle ear volume, so that its fast pressure regulating function is limited to a very small pressure range. Finally, we will discuss some recent results, obtained in rabbits, of the e ect of static pressure variations on middle ear ossicle motions. With heterodyne interferometry, we measured motions of umboandstapesatpressurechangeratesbetween200Pa/sand1.5kPa/s.Wewillshow that hysteresis in these motions increases as pressure change rate decreases, quite in oppositetothecommonnotionthatsuchhysteresisismainlycausedbyvisco-elasticity. Weconcludethatstaticanddynamicfrictionareimportantaspectsofossiclemotionat slow pressure variations, new aspects which should be taken into account when trying to model quasi-static ossicle mechanics.

1. Introduction
The middle ear (ME) is a semi-rigid biological gas pocket, which is closed most of the time. The eardrum, and especially the pars flaccida (PF), are displaced if a pressure di erence exists between the ME and ambient, making the gas filled cavity partly non-rigid. Under normal conditions, the Eustachian tube (ET) remains closed, but it will open spontaneously to equilibrate large pressure di erences. During deglutition, the peristaltic movements of the ET walls regularly inject small boluses of air into the ME cavity.GasexchangeprocessesthroughtheMEmucosacauseslowpressure variations, and external events such as blowing the nose or taking an elevator can cause sudden and large pressure changes.
At hearing threshold, the cochlea detects eardrum motions with amplitudes of less than 0.1 nm, while quasi-static pressures in everyday situations can generate eardrum motions a factor of millions larger. At 120 dB sound level, pressure amplitude is about 10 Pa, while quasi-static pressure variations of several kPa occur in everyday situations. The cochlea itself is protected from static overloads because for very low frequencies fluid can move freely at the helecotrema from the scala vestibule to the scala tympani. The large static loads however push the stapes far from its equilibrium position and cause large deformations of the round window. The fact that large static pressures are an inherent part of daily life, and that pressures up to at least 100Pa hardly influence hearing, suggests that ME mechanics protect the round window and the annular ligament of the stapes from these quasi-static pressure overloads. Although it is generally accepted that there is a correlation between ME pressure deregulation and importantpathologiesoftheME,theunderlyingbasicprocessesstillelude us,somorequantitativeinsightisneededintheseveralmechanismsofME pressure regulation. To understand the mechanisms and e ects involved with quasi-static high amplitude pressure variations, we need to know
howMEpressurevariesinnormalcircumstances,investigatebothfastand 11 slowregulationmechanisms,anddeterminethee ectofsuchpressureson middle ear mechanics.
1.1 Pressure in the normal ME
Tounderstandthee ectandimportanceofthedi erentregulatorymechanisms, it is first of all necessary to know how ME pressure varies over time, but little quantitative data are available. ME pressure can be assessed in two fundamentally di erent ways: indirect estimation from tympanometric recordings, and direct pressure measurements in the middle ear or the mastoid. The tympanometric approach is easy, and as it can be performed in any clinical setting with standard equipment, it has been used by many

authors [1,2,3,4,5,6,7]. Indirect measurement has, however, several important drawbacks. First of all, a basic assumption is that the magnitude of the impedance of the ME mechanical system is at a minimum when ME pressureequalstheearcanalpressure.Thisassumptionisnotnecessarilytrue:it may well be that sound transfer is actually better when the ear is at a slight over or under pressure. Furthermore, recording a tympanogram takes at least several seconds, so the time resolution of the method is inherently very low, and in practice one can only perform the test a limited number of times without discomfort to the patient.
Short term direct measurements of ME pressure have been reported in several studies. The ME pressure can be accessed via a tympanic membrane perforation [5], or via the mastoid [8,9]. Attempts were also made to measure ME pressure via the Eustachian tube [10], but these measurements are done under general anaesthesia, which clearly may have an influence on the results.
Recently, a long term study was presented [11]. In this work, pressure was monitored over a period of 24 hours, with a sampling interval of 0.8 s and a pressure resolution of 3.9 daPa. The ME pressure was measured using an airtight stopper in the ear canal, and a small perforation of the eardrum.
To include the pressure regulation e ect of the eardrum, it is, however, necessary to measure ME pressure with the eardrum intact. To detect changes in fast and small pressure bu ering mechanisms, a good pressure measuring resolution, combined with a small sampling interval is necessary. We have developed a system which meets these requirements, and we will show preliminary results.
1.2 Pressure regulation by pars flaccida deformation
Deformation of the eardrum leads to changes of the ME volume and can
12therefore (partly) compensate the e ect of external pressure changes. It is a very fast reacting mechanism and especially the soft PF may play an important role. The PF is commonly involved in many pathologies of the ME, but its actual function still remains unclear. Traditionally, the PF is seen as a regulator of static ME pressure: the easily bending membrane can reduce pressure by changing the ME volume. However, only few quantitative measurements of this deformation as a function of ME pressure are available.WehavepresentedsomeresultsonPFvolumedisplacementinhealthy eardrums and in cases of induced pathology [12,13,14]. Tympanometric measurements may yield information on eardrum volume displacement as awhole,buttheycannotdiscriminatebetweenthecontributionsofPFand pars tensa. We will show in-vitro quantitative data of PF volume displace-

ment as a function of ME pressure, measured in Mongolian gerbil ears, to determine the possible role of the PF in ME pressure regulation.
1.3 Motion of ME ossicles under slow pressure variations
Few quantitative data exist on how the ossicles move in response to large quasi-static pressure changes and because of this lack of data only few ef- fortscouldbemadetoincorporatequasi-staticbehaviorintomodelsofME mechanics.Somedataareavailableonhumancadavertemporalbones[15], but only at fixed pressure values. When designing ossicle prostheses and implantable ME hearing aids, the e ects of large ossicle movements caused by quasi-static pressures should be taken into account. We investigated the response of the middle ear to slowly varying pressures by measuring the displacementoftheumboandthestapesinrabbitswithaheterodyneinterferometer.
2. Materials and Methods
2.1 Measurement of human ME pressure
To measure pressure in normal middle ears with intact eardrum, a surgical interventionisnecessarytoplaceacanullainthemastoid,whichiscoupled to a pressure transducer. Subjects are chosen who have a normal middle ear,butwhoneedsurgeryinanearbyarea,suchastheparotidgland.Initial measurements were made in four subjects at the Saint Augustine Hospital inAntwerp,Belgium.Recently,anewtestsitewassetupattheENTdepartmentoftheHospitalAalborg,Denmark,incollaborationwithDr.M.Gaihede and Dr. H. Jacobsen, and details of first results at this site are presented in a separate contribution in this volume.
The patient carries the small pressure transducer on the bandage on the head, and data are recorded in an electronic unit (carried in a pocket)
at a rate of 10 measurements per second with a resolution of 1 Pa, during 13 up to 48 hours. In the latest version of our system, readout is done over USB bus, and over this link incoming data can also be monitored on a laptop screen in real time, to perform acute experiments.
2.2 Deformation measurements of the gerbil eardrum
Gerbil temporal bones were collected immediately post mortem. The ME is then pressurized through a tube glued to a small hole through the bullar wall. The air pressure load was computer controlled so that it could be changed in small accurate steps. At each pressure step, the shape of the deformed membrane was measured with our opto-electronic moiré interferometer which we especially designed for research in otology [16].

2.3 Motion of ME ossicles under slow pressure variations
Temporal bones were removed from New Zealand rabbits, and the bulla was opened to expose the ossicles. Through a tube glued to the ear canal, pressures were applied with linear pressure change rates from 200 Pa/s to 1.5 kPa/s, and amplitude ±2.5 kPa. Motion of the stapes and umbo were measured with a heterodyne interferometer with position decoder.
3. Measurement Results
3.1 Measurement of human ME pressure
Fig. 1 presents the result of the 24 hour pressure recording in our first patient, and a 2 hour time detail in another patient. We see long periods of over and under pressure in the ME, the over pressure being present in periods where the patient was in recumbent position. Apart from the long term changes, we also see that pressure continuously varies. Although the magnitude of these fast variations is less than 10 daPa, they may be an important aspect of middle ear pressure variation.
|
100 |
|
|
|
(daPa) |
80 |
|
|
(daPa) |
60 |
|
|
||
40 |
|
|
||
20 |
|
|
||
pressure |
|
|
pressure |
|
0 |
|
|
||
-20 |
|
|
||
-40 |
|
|
||
ME |
-60 |
|
|
ME |
|
-80 |
|
|
|
|
-100 |
|
|
|
|
0 |
500 |
1000 |
1500 |
120 |
|
|
|
|
100 |
|
|
|
|
80 |
|
|
back to |
|
60 |
|
|
upright |
|
40 |
|
|
|
|
20 |
in recumbent position |
|
||
|
|
|||
0 |
|
|
|
|
-20 |
|
|
|
|
-40 |
going to recumbent |
|
|
|
-60 |
|
|
|
|
0 |
2000 |
4000 |
6000 |
8000 |
time (minutes) |
time (s) |
Fig. 1 24 hour recording of human middle ear pressure, and 2 hour time detail in an other patient.
14We see how, in the recumbent position, there is a slow build up of positive pressure. Once the patient is upright again, the pressure drops quickly. The patient was in the bed, but NOT asleep, so pressure changes are not caused by a di erent gas composition during sleep, they are triggered by posture. Using our improved device with on-line monitoring capability, the Aalborg team is currently undertaking acute experiments on the e ects of external pressure variations caused by, for instance, riding an elevator.
3.2 Deformation of the gerbil PF: volume displacement
The full-field deformation of the PF was measured with our optical technique in five gerbil ears, and volume displacement was determined at small pressure intervals in three sequential pressure cycles in the range ±200
daPa. Fig. 2 presents typical curves of volume displacement versus ME pressure (detailed results in [14]). The figure shows data obtained in two subsequent pressure cycles. Diamonds and triangles indicate the parts of thetwocurveswherepressureisdecreasing,squaresandcrossesareusedin the parts where pressure is increasing. Starting from 0 Pa (pressure di erence relative to ambient pressure), ME pressure is decreased to its maximal negativevalue.Wethengraduallyletthepressurerisebackto0Pa,followed byafurtherincreasetoitsmaximalpositivevalue.Theloopiscompletedby letting the pressure return to zero.
|
|
|
0,5 |
|
|
|
|
|
0,4 |
|
|
liter) |
|
|
0,3 |
|
|
|
|
0,2 |
|
|
|
(micro |
|
|
0,1 |
|
|
|
|
0 |
|
|
|
|
|
|
|
|
|
volume |
-800 |
-400 |
-0,1 0 |
400 |
800 |
|
|
-0,2 |
|
decr. 1 |
|
|
|
-0,3 |
|
incr. 1 |
|
|
|
|
-0,4 |
|
decr. 2 |
|
|
|
|
incr. 2 |
|
|
|
|
|
|
|
|
|
|
-0,5 |
|
|
|
|
|
pressure (Pa) |
|
|
Fig.2Volume displacement of gerbil PF as function of pressure, recorded in a 40 daPa cycle and a subsequent 200 daPa cycle. Displacement does not change for pressures beyond 80 daPa, so we only plotted that part.
In all measured ears, volume displacement did not increase for pressures beyond 80 daPa (so we only plotted this part in Fig. 2) and the major part of the maximal volume displacement was reached in a very small pressure
range of a few hundred Pa. Maximal volume displacement at –2kPa varied 15 from –0.476 µl to –0.301 µl between ears, and maximal volume displacement at +2kPa ranged from 0.239 µl to 0.358 µl. The volumes of the ME cavities were also measured, and varied from 250 µl to 270 µl between ears. Maximal PF volume displacement is therefore smaller than 0.2% of the air volume enclosed in the ME. Following from Boyle’s gas law, this implies
that the PF can only compensate, at most, pressure changes of 0.2% of atmospheric pressure, or less than 20 daPa.
3.3 Motion of the ME ossicles under slow pressure variations
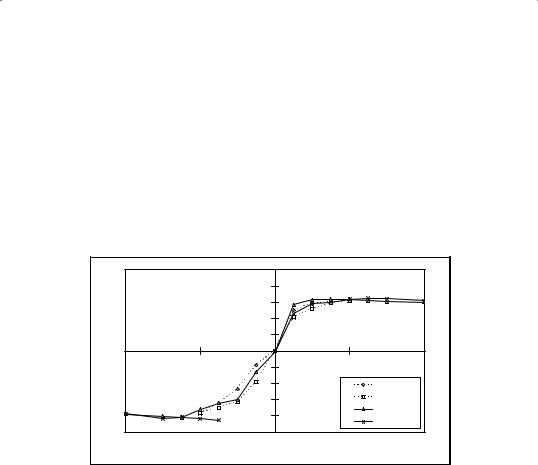
Both umbo motion and stapes motion show non-linear S-shaped curves as function of pressure (Fig. 3). Stapes displacement versus pressure curves
are highly non-linear and become nearly horizontal for pressures beyond
±1 kPa, so higher pressure loads on the eardrum are not transduced to the cochlea. Stapes amplitude is independent of pressure change rate: (34 m
± 3 m, n=6). At 1.5 kPa/s stapes shows no measurable hysteresis, which indicates that the annular ligament has little visco-elasticity. Hysteresis increases strongly at the lowest pressure change rates (Fig. 4). Umbo motion is also non-linear, yet less pronounced than stapes, and shows large hysteresis also at 1.5 kPa/s. The amplitude of umbo motion, produced by a ±2.5 kPa pressure change, decreases with increasing pressure change rate, from (165 m± 16 m, n=6)at 200Pa/sto(118 m± 11 m,n=6)at 1.5kPa/s. At 1.5 kPa/s, the ratio of stapes amplitude over umbo amplitude is 0.29. At 200 Pa/s the ratio decreases further to 0.21, which is three times the value previously reported in human cadaver ears [15].
Fig.3Stapesandumbopositionsasafunctionofpressure,measuredat1kPapressure change rate.
Umbo hysteresis increases with decreasing pressure change rate, as shown in Fig. 4. Using an estimate of eardrum surface area, we calculated an energy loss per pressure cycle (from –2.5 kPa to +2.5 kPa and back) of 1.3 J at 1.5 kPa/s increasing to 3.8 J at 200 Pa/s.
16

Fig.4Stapeshysteresis(Hs)andumbohysteresis(Hu)asafunctionofpressurechange rate. Hysteresis increases with decreasing pressure change rate, contrary to what is expected from a visco-elasticity governed system. Transition between dynamic and static friction may be an important additional mechanism in static-pressure middle ear mechanics.
4. Discussion and Conclusions
From our measurements of ME pressure in intact ears, we see that both rapid small variations and slower large variations are present, which both mayneeddi erentregulatorymechanisms.Wearecurrentlygatheringdata tocompleteanormativeset.Then,itwillbeparticularlyinterestingtocomparepressurefl uctuationsinearswithknownventilationproblemstothose found in normal ears.
Our measurements show that PF volume displacement in gerbils is a highly non-linear function of ME pressure. In previous work on human temporal bones, we also found very non-linear behavior of the PF [17]. Because maximal PF volume displacement is smaller than 0.2% of the ME volume, the deformation mechanism can not compensate for pressure changes greater than 0.2% of ambient pressure, or 20 daPa. At least all pressure changes beyond an initial 20 daPa will therefore result in loading 17 of the pars tensa.
If the PF has a functionality as an ME pressure change bu er, the presentresultsshowthatthee ectislimitedtoarangeofafewcentimeter of water pressure. On the other hand, we see that even the tiniest changes in static ME pressure can make the PF move: a pressure change as small as 10 daPa results in a volume displacement of more than 50% of the maximal obtainable value. Small and fast pressure variations were constantly present in our recordings of ME pressure in humans and the PF may play an important role in reducing the magnitude of these fl uctuations, and in detecting small pressure deviations. It has been proposed by other authors [18] that the PF may have a function as a very sensitive pressure detector. Our measurements show that the sensitivity of the membrane