

Учебники / Middle Ear Mechanics in Research and Otology Huber 2006
.pdfFig. 1 Model of a gerbil stapes in an intrinsic reference system. (z-axis completing right-handed frame, directed out-of-plane). Piston motion is along the y-axis.
3. Results and Discussion
3.1 Scala vestibuli pressure
Pressure in the scala vestibuli, measured with a calibrated pressure sensor, relative to EC pressure, is shown for 3 animals, 20m4, 25m4 and 27m4, in Fig. 2. The curves represent the pressure gain produced in the middle ear: the gain amplitude (Fig. 2A) was a very smooth function of frequency, fluctuating in a small band around a level of 10 (20.0 dB) with extreme values of 3 (9.5 dB) and 20 (26.0 dB). The low frequency onset for all 3 animals showed a fast increase in gain amplitude towards a small maximum
118at about 1.5 kHz, then there was a steady decrease to about 6 kHz, where the gain was again somewhat higher in a short frequency interval ending with a small dip at 10 kHz. For animal 25m4 (dashed-dotted line) the gain was remarkably constant all the way up to the highest frequencies. Animals 20m4 and 27m4 had a broad and shallow minimum at 30 kHz, followed by a rise to its overall highest values.
Phaseforall3animalswereverysimilar(Fig.2B):the3curvesstarted at+0.25cycleat190Hz,rapidlydecreasedto0cycleatabout1.5kHz(here the amplitude showed a small peak), then decreased further to about 6 kHz where a small peak was formed (here the amplitudes produced a dip). From then on the phases for all animals decreased linearly with frequency and a total phase lag of about –1.5 cycle is built up at 40 kHz.

|
102 |
|
|
|
|
|
|
|
|
amplitude |
|
|
|
|
|
|
20m4 |
|
|
|
|
|
|
|
|
25m4 |
|
|
|
|
|
|
|
|
|
27m4 |
|
|
|
101 |
|
|
|
|
|
|
|
|
|
gain |
|
|
|
|
|
|
|
|
|
|
|
|
|
|
|
|
|
|
|
pressure |
|
|
|
|
|
|
|
|
A |
|
|
|
|
|
|
|
|
|
|
|
100 |
5 |
10 |
15 |
20 |
25 |
30 |
35 |
40 |
|
0 |
frequency (kHz)
|
0 |
|
|
|
|
|
|
|
B |
|
|
|
|
|
|
|
|
|
|
(cycle) |
-0.5 |
|
|
|
|
|
|
|
|
re EC |
|
|
|
|
|
|
|
|
|
|
|
|
|
|
|
|
|
|
|
phase |
-1 |
|
|
|
|
|
|
|
|
|
|
|
|
|
|
|
|
|
|
|
-1.5 |
|
|
|
|
|
|
|
|
|
0 |
5 |
10 |
15 |
20 |
25 |
30 |
35 |
40 |
frequency (kHz)
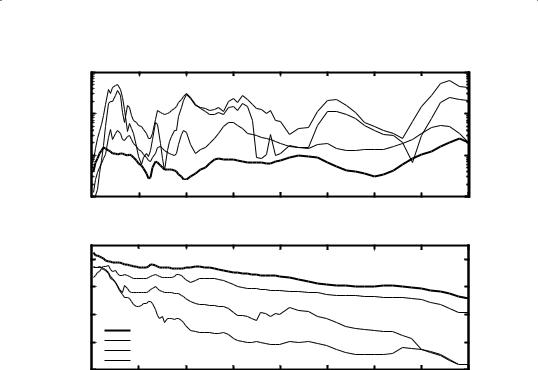
Fig. 2 Middle ear pressure gain is shown for 3 animals. Gain amplitude (panel A) is verysmoothwithfrequencyandvariesinasmallbandaroundalevelof~10(20.0dB). Gain phase (panel B) is very similar for all 3 animals and shows a gradual decrease with frequency to a total phase lag of about –1.5 cycle at 40 kHz.
3.2 SV pressure versus piston velocity
In Fig. 3 we compare the stapes piston velocity per EC pressure (thin solid line) with the pressure gain (thick solid line) for animal 27m4, as already shown in Fig.2. To plot gain and linear velocity on the same axis we multiplied the velocity by a scale factor shown in the figure caption of Fig. 3. The piston velocity component rel. EC pressure is not as smooth a function of
frequency as the gain amplitude (Figs.3A). We show only results for 1 ani- 119 mal but the gross trend of the curves for all 3 animals is fairly comparable.
At the very lowest frequencies piston velocity increases more slowly with frequency than the pressure gain; some clear but minor peaks in piston ve- locityamplitude(totalchange+/–6dB)arenotseeninthepressure(27m4: @ 10 and 15 kHz). Some dips in the piston amplitude are accompanied by dips in the pressure (27m4: @ 6 kHz), but sometimes this is not true and a peak in amplitude occurs at dip in pressure (27m4 @10 kHz). Disregarding thesesmallwigglesthepistonvelocityisquiteflatinawidefrequencyband from 2.5 to 32.5 kHz (also for 20m4 and 25m4, not shown) and the amplitude stays high up to the highest frequencies measured.
|
103 |
|
|
|
|
|
|
|
|
|
102 |
|
|
|
|
|
|
|
|
amplitude |
1 |
|
|
|
|
|
|
|
|
10 |
|
|
|
|
|
|
|
|
|
|
|
|
|
|
|
|
|
|
|
|
|
|
|
|
|
|
|
|
A |
|
100 |
|
|
|
|
|
|
|
|
|
0 |
5 |
10 |
15 |
20 |
25 |
30 |
35 |
40 |
frequency (kHz)
|
0 |
|
|
|
|
|
|
|
B |
EC (cycle) |
-1 |
|
|
|
|
|
|
|
|
-2 |
|
|
|
|
|
|
|
|
|
re |
|
|
|
|
|
|
|
|
|
|
|
|
|
|
|
|
|
|
|
phase |
|
gain |
|
|
|
|
|
|
|
-3 |
piston |
|
|
|
|
|
|
|
|
|
|
long axis tilt |
|
|
|
|
|
|
|
|
|
short axis tilt |
|
|
|
|
|
|
|
|
-4 |
|
|
|
|
|
|
|
|
|
0 |
5 |
10 |
15 |
20 |
25 |
30 |
35 |
40 |
frequency (kHz)
Fig. 3 Amplitude (A) and phase (B) of the pressure gain (SV pressure relative to EC pressure, thick solid line) as a function of frequency for animal 27m4. The piston componentvelocity(thinsolidline)andangularvelocitiesaboutthelongaxis(dasheddotted line) and short axis (dashed line) of the footplate are plotted as well to correlate pressure and velocity. To plot the amplitudes of the velocities on the graph in the scale of the gain, the piston velocity is expressed in units of 10–5 (m/s)/Pa, and the angular velocities in 10–3 (rad/s)/Pa. (Please refer to the text for further discussion).
3.3 SV pressure versus footplate tilt
Pressure in the inner ear is produced when the footplate compresses the fluid in the cochlea and therefore mainly displacements perpendicular to
120the footplate will induce pressure. The motion components that give rise to such displacement are the piston component of the translation and the tilt of the footplate about its short and long axes. At first it seems reasonable to exclude the tilting from producing a pressure that can propagate further down the cochlea. Let us nevertheless hypothesize that there might be a mechanism that makes rotations e ective in sound transmission. If we allow tilting modes to contribute to the pressure generation and play a role in smoothing of the pressure gain versus frequency curve, we must look for frequencybandswherethepistonamplitudeissmallandwherethisiscompensated by high angular amplitude. The e ect does not have to be large as there are no frequencies where the piston amplitude goes through a deep
minimum.Wesee(Fig.3A)thatdipsinpistonamplitudearenotsystemati-

cally accompanied by highs in tilt amplitude. A deep minimum in piston amplitude,notreflectedinthepressurewouldhavebeenaconclusiveproof, but it does not occur.
Conversely we see that strong maxima or minima in tilt are not reflected in pressure indicating that tilt can only play a minor role. The same argument is supported by the fact that phase of the tilt motion does not seem to play a role (Fig. 3B). If pressure were generated partly by tilt and partly by piston motion, phase di erences between the two kinds of motion should also play a major role in the net pressure production. In frequency regions where the phase di erence between the tilt and piston is varying in a di erent way with frequency (this is in regions where the piston and tilt phase curves are not running parallel to each other), we do not see any systematic e ect of this on the pressure curve.
4. Conclusion
We have presented measurements of the 3-D velocity components of the stapes and have correlated these measurements with the SV pressure to verify whether non-piston components of the footplate produce pressure behind the footplate and thus can also eventually give rise to an e ective input to the cochlea and can help in realizing the remarkably smooth and flat pressure gain from EC to scala vestibuli as a function of frequency. We found no evidence for this hypothesis: dips in the piston velocity are not systematically filled by peaks in tilt and conversely peaks in tilt are not repeated in the SV pressure. Further we found that SV pressure and piston velocitycorrelatewelloverallbutdi erencesintrendsofthecurvesarealso present.
121
Acknowledgments
Support by NIH/NIDCD, E. Capita Fund, FSR (Flanders, Belgium) and RAFO (Univ. of Antwerp).
References
1.Heiland K.E., Goode R.L., Masanori A. and Huber A., A human temporal bone study of stapes footplate movement. The Am. Jour. of Otolog. 20, (1999) 81–86
2.HatoN.,StenfeltS.andGoodeR.L.,Three-dimensionalstapesfootplatemotionin
human temporal bones. Audiol. Neurootolog. 8, (2003) 140–152
3. Guinan J.J. and Peake W.T., Middle-ear characteristics of anesthetized cats. J. Acoust. Soc. Am. 41, (1967) 1237–1261

4.DecraemerW.F.,KhannaS.M.,FunnellW.R.J.,Measurementandmodellingofthe three-dimensional vibrations of the stapes in cat, Proceedings of the Symposium on Recent Developments in Auditory Mechanics, Eds. H. Wada, T. Takasaka, K. Ikeda, K. Ohyama and T. Koike, World Scientific (2000) 36–43
5.Decraemer W.F., Khanna S.M., New insights in the functioning of the middle-ear. The function and mechanics of normal, diseased and reconstructed middle-ears. Ed by J.J. Rosowski and S. Merchant. Kugler Publications, The Hague, The Netherlands, (1999) 23–38
6.Olson E.S. and Cooper N., Stapes motion and scala vestibuli pressure. Abstracts of the 23rd Annual Midwinter Research Meeting, St-Petersburg Beach, Fla, USA, abstract#399,(2000)p114(canbereadathttp://www.aro.org/abstracts/abstracts. html)
7.Olson E.S., “Intracochlear pressure measurements related to cochlear tuning”,
J.Acoust. Soc. Am. 110 (1), (2001) 349–367
8.Olson E.S., “Observing middle and inner ear mechanics with novel intracochlear pressure sensors”, J. Acoust. Soc. Am. 103 (6), (1998) 3445–3463
9.Dong W. and Olson E.S., “Middle ear forward and reverse transmission in gerbil”,
J.Neurophysiol. 95, (2006) 2951–2961
10. Decraemer W.F., Khanna S.M., de La Rochefoucauld O., Dong W., Dirckx J.J., Olson E.S., “Estimation of stapes piston motion with uni-directional measurements is prone to error”, Memro2006 Proceedings
122

MECHANICAL EXCITATION
OF COMPLEX STAPES MOTION
IN GUINEA PIGS
Albrecht Eiber, Christian Breuninger, Institute of Engineering and Computational Mechanics, University of Stuttgart, Pfaffenwaldring 9, 70550 Stuttgart, Germany Email: eiber.breuninger@itm.uni-stuttgart.de
Damien Sequeira, Alexander Huber, Department of Otorhinolaryngology, Head and Neck Surgery, University Hospital of Zurich, Switzerland Email: Alex.Huber@usz.ch, Damien.Sequeira@usz.ch
As observed in many studies the natural vibration pattern of the stapes on acoustic stimulationrevealsacomplexmotionpatterndependentonthefrequencyofexcitation. Whereas for low frequencies the motion is predominantly piston-like, significant rocking can be found for higher frequencies. The cochlea fluid is mechanically exited by the piston-like motion and two rotational movements along the short and long axis of the footplate. The rotational components produce no net volume flux of the cochlea fluid and, therefore, their influence on the hearing sensation is still an open question. To investigate the response of the cochlea on complex motion of the stapes footplate, di erent vibration pattern on the stapes have been mechanically applied in anesthetized guinea pigs.
A test rig was built to position the subject, an actuator and a Laser Doppler Vibrometer adjustable by micro manipulators. A three-axis piezoelectric actuator has
been designed and coupled to the stapes head of the surgically prepared guinea pig 123 by a coupling rod. For capturing the e ective motion of the stapes three-dimensional
laser Doppler vibrometry was applied. The excitation procedure for arbitrary stapes motion consists of both an identification and a measurement phase to determine the transducerbehaviorandtheelectrophysiologicalmeasurementsofthecochlearesponse on the applied motion. Spatial velocity of stapes and cochlea potentials on repeated transducer activation are captured simultaneously by the data acquisition system for appropriate post-processing.
The task of driving arbitrary motion patterns yields a much higher complexity than classical one-dimensional consideration. The setup enables investigations in electrocochleography with di erent amounts of piston and rocking-like motions of the stapes.

1. Introduction
As a result of the spatial middle ear structure in normal ears, the vibration modes of the stapes in response to acoustic stimulation shows complex movement patterns [1]. These complex, frequency-dependent vibrations can be expressed as one translational displacement perpendicular to the footplate of stapes and two rotational movements around its long and short axes. In the lower frequency range the motion is predominant pis- ton-like, significant rocking is observed at higher frequencies [2]. Whereas the piston-like motion of the stapes footplate induces a global volume displacement of the perilymph in the scala vestibuli, a pure rotational motion primary results only in local fluid displacements. In the classical hearing theory a hearing sensation is evoked only by piston motion, while for rocking motion no cochlear activity is expected. It is the goal of this study to prove this hypothesis experimentally by electrophysiological measurements in guinea pigs.
An acoustic stimulation applied to the middle ear excites always piston and rocking motions of stapes in combination. Particularly, rocking motion without piston motion can not be achieved in the lower audible frequency range. To drive a stapes in so called elementary motions, i.e. pure piston and pure rocking separately, a mechanical excitation of the isolated stapes structure was realized by coupling a mechanical actuator to the stapes head. The response of the cochlea due to piston and rocking motion is determined by measuring cochlear potentials. The actual elementary motions are measured by a three-dimensional Laser Doppler Vibrometer (3D-LDV) focused on the stapes head.
This paper is concerned with the realization of the mechanical excitation of the stapes motion and its measurement, while the evaluation of the cochlear potentials is discussed in [3].
124
2. Material and Methods
2.1 General aspects
For statistical evaluation, especially measuring cochlear potentials, a high number of repeated measurement data is needed. To get consistent data sets, it is highly important that the physical condition of subject, the positioning of electrodes and the experimental setup be not changed during measurement.Theusedmulti-axisactuator,capabletostimulatepistonand rocking independently, reduces the di cult and time consuming task of positioning the subject with respect to LDV and coupling the actuator to the stapes head without any predeformation.

2.2 Test rig
Since for a spatial, mechanical excitation and measurement of the stapes, a predefinedpositionofstapes,stimulatorandvelocitysensorisneeded,atest rig was built up using commercial aluminium profiles as shown in Figure 1 to align subject, actuator and laser vibrometer. It is installed in a sound- proof,electromagneticradiation-shieldedcabin,whileallmeasurementde- vicesareplacedoutside.Structuralvibrationsoftheframearesuppressedby dampingelementsintheprofilesandbya vibration-isolateddesk.
The guinea pig is placed such that the stapes can be aligned in parallel to the frame of the test rig with respect to an intrinsic coordinate system oriented along the short and long axes of the stapes footplate and perpendicular to it. Actuator and laser are inclined such that the stapes head is accessible by the actuator needle and the three laser beams. By means of micromanipulators (M-332.3MS / M-333.1MS, Physik Instrumente (PI) GmbH & Co. KG, Karlsruhe, Germany) the position of the subject is adjusted to focus all three laser beams on the stapes head. Subsequently, with a micromanipulator (MM-3, Narishige Scientific Instruments Lab., Tokyo, Japan), the actuator needle is attached to the stapes. A firm coupling of actuator needle and stapes head is realized by a thread inside the hollow needle, tighten around the stapes head by a noose.
2.3 Three-axes piezoelectric actuator
A custom-built actuator was designed to fulfill the described requirements of producing motion in any desired direction by using three piezoelectric stacks spaced at 120° intervals to drive the actuator head. The body of the actuator is mounted on the micromanipulator. The stacks are driven by the voltage uPiezo = [u1 u2 u3] supplied by common audio power amplifiers.
125
Fig. 1 Clamping support for subject, actuator and 3D-Laser Doppler Vibrometer with its local coordinate systems.

For an ideal actuator in the quasi-static frequency range, the transformation from the elongation of the piezoelectric stacks to needle motion
yAct = [xAct yAct zAct] in the actuator’s coordinate system is a pure geometric property. Due to uncertainties of the setup parameters, e.g. length
of the coupling needle and in particular to determine the dynamic behavior up to 10 kHz, an identification of actuator’s frequency response function H(jω) is carried out. This 3-by-3 matrix yields the relationship yAct = H(jω)·uPiezo in the frequency domain.
2.4 Three-dimensional Laser Doppler Vibrometry
The 3D-LDV (CLV-3D sensor head, CLV-3000 controller, Polytec GmbH, Waldbronn, Germany) generates three independent laser beams with an incidence angle of 11.6° with respect to the sensor head’s longitudinal axis. Hence, the laser beams are crossing at the focal point at a distance of 160 mm from the sensor head's lens defining the measurement point.
The velocity signals along the laser beams are processed in the geometry module of the controller yielding to the velocity components vLDV in the coordinate system of the sensor head. The velocities in the stapes head co-
ordinate system vStapes = [vx vy vz] are obtained by means of the transformation vStapes = SSL· vLDV with the rotation matrix SSL between sensor head and stapes.
2.5 Actuator control
Unlike acoustical stimulus using a loudspeaker, the mechanical excitation of the isolated stapes structure by means of an actuator allows any arbitrary complex motion by superposition of the elementary motions. Nearly pure rocking motion can be applied even in the lower audible frequency range. The actuator control and data acquisition are performed by a real time processor from dSPACE GmbH, Paderborn, Germany, in interaction
126 with the software MATLAB running on a PC.
For a desired motion yStapes,des = [xStapes yStapes zStapes] of the stapes head theactuatorneedlehastoperformthemotionyAct =SAS ·yStapes,des according to the rotation matrix SAS of the actuator orientation with respect to the
stapes. By help of the frequency response function of the actuator identi-
fied before, the time history uPiezo(t) of the voltages for driving the three piezoelectricstacksisobtainedbythetimedomaincorrespondentrelation
of uPiezo(jω) = H–1(jω) · yAct(jω).
2.6 Click design
In case of acoustical stimulation, commonly a sharp click at the loudspeaker is used. Due to a strong low-pass behavior of the dynamic subsystems

of loudspeaker, tube to conduct the sound pressure to the ear drum, ear canal and middle ear this click gets strongly low-pass filtered. In mechanical excitation the dynamic chain consists only of stapes and actuator showing a much faster response than in acoustic stimulation. Consequently, an excitation with a higher frequency content can be applied to the cochlea. Even more, by the described control of the actuator, a nearly arbitrary time
history of desired motion yStapes,des(t) at the stapes head can be applied. For these investigations, a click for the desired motion of the stapes
head was used as shown in Figure 2. This excitation procedure results in a frequency spectrum of excitation similar to an acoustical stimulation with a very short click.
Fig. 2 A: Shape of desired motion of stapes head. B: Spectrum of desired motion.
3. Results and Discussions
The voltage uPiezo(t) of excitation clicks for piston motion and rocking motionaboutthelongandshortaxisofthestapesfootplateisappliedinrepetitive cycles of 200 times in intervals of 79 ms. Stapes motion and cochlear response are measured simultaneously and averaged with respect to the
cycles to reduce measurement noise. The displacements yStapes = [xStapes yStapes zStapes] of the stapes head are obtained by an integration of the measured stapes velocities. 127
A typical measurement series is shown in Figure 3. The measured displacements show a predominant motion in the desired direction of excitation. The amplitudes in the other directions are much smaller. The corresponding spectra have a bandwidth up to approximately 3 kHz. Again, the magnitude of the undesired components are about 30 to 40 dB below the desired one.
For these three dominant motions, cochlear potentials with di erent amplitudes are observed. The greatest potential resulted from translational displacement, but potentials from rocking motions are not negligible.