

Учебники / Middle Ear Mechanics in Research and Otology Huber 2006
.pdfFig. 2 Lateral view of the TM with two perforations: Case #1 – the perforation located in the inferior-posterior site of the TM; Case #2 – the perforation located in the inferior site.
3. Results
Fig. 3 shows the comparison of displacement derived from the FE model of normal ear with the data measured from 7 bones at the TM (umbo) and stapes footplate. Panels (A) and (B) display magnitude and panels (C) and
(D) display phase angle. The 90 dB SPL was applied at 2 mm away from the
208
Fig. 3 Comparison of the FE model-derived TM and stapes footplate displacements with the data from 7 temporal bones in magnitude and phase angle. (A) and (C): TM displacement; (B) and (D): footplate displacement.

umbo in the ear canal of the model, which simulated the sound source in the bone experiments. A good agreement between the FE model and experimental data can be seen in Fig. 3.
Panels (A) and (C) in Fig. 4 show the mean magnitude and phase angle of the TM or umbo displacement obtained from 7 bones under control (intact TM, solid line), perforation Case #1 (Hole 1, broken-dash line), perforation Case #2 (Hole 2, dash line), and combined Holes 1 and 2 (broken line). The TM displacement curves predicted by the model are shown in panels (B) and (D). The results in Fig. 4 indicate that the model-pre- dicted reduction of TM displacement magnitude at low frequencies (f<2 kHz)causedbyperforationsisconsistentwiththeboneexperimentaldata. A maximum of 27 dB reduction of the umbo displacement at 200 Hz was observed from the model and bone experiments. The model-predicted effect of perforation location and size on the TM displacement shows the same pattern as that measured from bones.
209
Fig. 4 Mean displacements measured at the TM and calculated from the FE model in control or intact TM (solid line), perforation Case #1 or Hole 1 (broken + dash line), perforation Case #2 or Hole 2 (dash line), and combined Holes 1 and 2 (broken line).
(A) and (C): Bone experiments; (B) and (D): FE model.
Panels(A)and(C)inFig.5displaythemeanmagnitudeandphaseangleof stapesfootplatedisplacementfrom7bonesundercontrol,perforationCase #1, Case #2, and combined cases #1 and #2. The model-derived footplate

displacement curves are displayed in panels (B) and (D). It can be seen in Fig. 5 that the model predicted a reduction of the footplate displacement foralltypesofperforationsatlowfrequencies(f<2kHz)andamaximumof 20 dB was observed at f≤400 Hz. There were no variations of the footplate movement between di erent types of perforations below 500 Hz. This is di erent from the TM movement in either modeling or experimental data (see Fig. 4).
Fig. 5 Mean displacements measured at the footplate and calculated from the FE model in control or intact TM (solid line), perforation Case #1 or Hole 1 (broken + dash line), perforation Case #2 or Hole 2 (dash line), and combined Holes 1 and 2 (broken line). (A) and (C): Bone experiments; (B) and (D): FE model.
210
4. Discussion
In this paper, the structural alterations such as TM perforations were simulated, visualized, and computed in a 3-D FE model. The model-derived TM andfootplatedisplacementswerecomparedwiththedatameasuredfrom7 temporal bones under the normal and TM perforated conditions shown in Figs. 3–5.Thisis thefirsttime(to ourknowledge) that thee ect of perforations on both TM and footplate movements was measured by lasers and calculatedbyFEmodel.Thefrequencyresponsecurvesofthedisplacement magnitudeandphaseattheTM(umbo)andfootplateundervariousperforations are in general matching well with the temporal bone experimental data.

The FE model has predicted that there is a sound pressure di erence across the TM in the normal ear. The value of pressure di erence was calculated as 16 to 7 and 23 dB at frequency of 200 to 1000 and 8000 Hz. However, the pressure di erence across the TM vanished at f<2 kHz when the TM was perforated and the degree of the variation in pressure di erence was dependent on frequency and perforation size or location. Therefore, the sound pressure di erence across the TM is the determinant factor for acoustic-mechanical transmission. This factor can be quantitatively determined in the FE model and the conclusion is similar to that reported by Voss et al. [4].
In conclusion, the study on pressure distribution and transfer function of the middle ear with the FE model has provided a complete description on the coupled acoustic-structural analysis for sound transmission through the ear. The model can be further applied to large perforations suchasaddressedbyMehtaetal.[5]andtosimulatemiddleearalterations caused by middle ear diseases such as the otitis media with e usion.
Acknowledgments
The authors thank Don Nakmali, BSEE, and Kenneth J. Dormer, Ph.D., for the temporal bone experiments. This work was supported by NIDCD and NSF grants.
References
1.Gan R. Z., Feng B. and Sun Q., Three-dimensional finite element modeling of human ear for sound transmission. Ann Biomed Eng 32 (2004) pp. 847–859
2.Gan R. Z., Sun Q., Feng B. and Wood M. W., Acoustic-structural coupled finite element analysis for sound transmission in human ear – Pressure distributions.
Med Eng Phys 28 (2006) pp. 395–404 |
211 |
3.Gan R. Z., Wood M. W. and Dormer K. J., Human middle ear transfer function measured by double laser interferometry system. Otol Neurotol 25 (2004) pp. 423– 435
4.Voss S. E., Rosowski J. J., Merchant S. N. and Peake W. T., Middle-ear function with tympanic-membrane perforations. I. Measurements and mechanisms. J Acoust Soc Am 110 (2001) pp. 1432–1444
5.Mehta R. P., Rosowski J. J., Voss S. E., O’Neil E. and Merchant S. N., Determinants of hearing loss in perforations of the tympanic membrane. Otol Neurotol 27 (2006) pp. 136–143

EFFECTS OF MIDDLE EAR SUSPENSORY LIGAMENTS ON ACOUSTIC-MECHANICAL TRANSMISSION IN HUMAN EAR
Rong Z. Gan1, Tao Cheng1, Don Nakmali2, Mark W. Wood2
1 School of Aerospace and Mechanical Engineering and Bioengineering Center, University of Oklahoma, Norman
2 Hough Ear Institute, Oklahoma City, Oklahoma, USA, Email: rgan@ou.edu
Two laser vibrometers were used to measure simultaneously the movement of the tympanic membrane and stapes footplate in human temporal bones. After control study of the normal ear, the stapedial tendon, posterior incudal ligament, tensor tympani tendon, and superior malleus/incus ligament were sectioned sequentially. The displacements of the umbo and footplate were measured repeatedly for each section. A 3-D finite element model of human ear which has accurate anatomic structure was used to mimic the middle ear structure changes and to derive the umbo and footplate vibrationsinresponsetothosealterations.Theresultsshowthatthee ectsofligaments on transfer function of the middle ear are frequency sensitive and vary with individual ligament.
212
1. Introduction
Three ossicles in the middle ear are suspended in an air-filled cavity by a complex system of ligaments and muscles, and coupled to the tympanic membrane (TM) by manubrium of the malleus. There are four ligaments and two muscle tendons which are involved in the normal function of the middle ear [1]. The locations of those ligaments and tendons are shown in Fig. 1, a 3-D finite element model of human ear created based on histologicalsectionimagesofahumantemporalbone[2].Thesuperiormalleus/ incus, lateral malleus, posterior incus, and anterior malleus ligaments are denoted as C1, C2, C3, and C4, respectively and the stapedial tendon and tensor tympani tendon are denoted as C5 and C7, respectively.

The ligaments C1 and C4 have been reported to pathologically involve in otosclerosis which directly a ect sound transmission through the ossicular chain and result in conductive hearing loss [3, 4]. The muscle tendons C5 and C7 are involved in the stapedial reflex and the inflammatory process of otitis media [5]. However, the mechanical properties of the ligaments and muscle tendons and the e ects of these tissues on acoustic-mechanical transmission have not been revealed because of the extremely small size of the ligaments and complexity of the middle ear ossicles and cavity. In this paper, we report the bioengineering systems approach on middle ear ligament/tendon function using human temporal bones and finite element modeling. Two laser vibrometers were used to measure simultaneously the movements of theTM attheumbo andstapesfootplate of humantemporal bones upon destructions of the ligaments. A 3-D finite element (FE) model of human ear with accurate anatomic structure and mechanical properties of the ligaments was then used to mimic the middle ear structure alterations and to derive umbo and stapes footplate vibrations in response to those changes.
213
Fig. 1 Finite element (FE) model of human left ear including the TM, three ossicles (malleus,incus,andstapes),twojointsandmanubrium,ligamentsandmuscletendons (C1, C2, C3, C4, C5, C7), tympanic annulus, stapedial annular ligament, external ear canal, middle ear cavity, and cochlear load, in anterior-medial view. The middle ear cavity wall was removed.

2. Methods
2.1 Temporal bone experiments on middle ear ligament function
Ten fresh-frozen cadaver temporal bones (3 male, 7 female, average age 64.6) were used in this study. The preparation of bone specimen and sound deliverysystemwerealmostthesameasthatreportedinourpreviouspaper [6]. Briefly, a canal-wall-up mastoidectomy was performed and the additus was exposed enough to view the body of the incus. After surgical preparation, two pieces of laser reflective tape were placed on the lateral surface of the umbo and the center of the stapes footplate. One laser beam was directedthroughtheearcanalatthereflectivetapeontheumbo.Deviation of this laser beam varied 0° to 35° with respect to the direction of the stapes piston-like movement. Another laser beam was focused on stapes footplate with 30°to 50° deviation from the stapes piston-like movement. The 90 dB puretone,soundsignalsinthefrequencyrangeof200–8000Hzweredeliv- ered to the TM and monitored by a probe microphone placed in the canal approximately 2 mm away from the umbo. Two laser Doppler vibrometers (Polytec, HLV-1000 and OFV 501) were used to measure vibrations of the TM and stapes simultaneously.
The control experiment with intact, nonmanipulated ossicular chain was performed first. After the control study, the middle ear ligaments and tendons were cut sequentially. The displacements of the TM and stapes footplate were measured repeatedly after each cut. Four middle ear ligaments and tendons were selected for this study: superior mallear ligament (C1), posterior incudal ligament (C3), stapedial tendon (C5), and tensor tympani tendon (C7) in the order of cutting C5, C3, C7, and C1.
2.2 3-D FE modeling of middle ear ligament function for sound transmission
A3-DFEmodelofhumanleftear(seeFig.1)includingmiddleearcompo-
214nents, external ear and middle ear cavity, was established based on a complete set of histological sections of a human temporal bone (male, age 61) [2].Themodelwascharacterizedby(1)dimensionsoftheearcanal,middle ear components, and middle ear cavity; (2) mechanical properties of the TM, ossicles, joints, and manubrium; and (3) boundary conditions of the middle ear including tympanic annulus, middle ear ligaments or muscle tendons, stapedial annular ligament, and cochlear fluid. Note that all the ligaments and tendons were assumed as elastic constraints with 4-noded solid elements and dimensions [2].
The accuracy of mechanical properties of ear tissues a ects the FE model-predicted middle ear function. Recently, we have completed some preliminary studies on measurement of mechanical properties of human

stapedial and tensor tympani tendons and anterior mallear ligament. In this study, we employed the new Young’s modulus data of 8.0, 10, and 8.0 MPafortheligamentC5,C7,andC4whichhavethevolumeof0.12,1.187, and 0.563 mm3, respectively. Following the ligament cutting sequence in bone experiments,wecreatedthesame sequenceof removingligaments in the FE model and performed the FE analysis sequentially. A 90 dB sound pressure was applied at the 2 mm away from the umbo in the ear canal. The acoustic-structural coupled FE analysis between the ear canal air col- umnandTMor“one-chamber”coupledanalysiswasperformedwitheach manipulated ossicular case. The displacements at the umbo of the TM and footplate were calculated and the results were compared with the bone experimental data.
3. Results
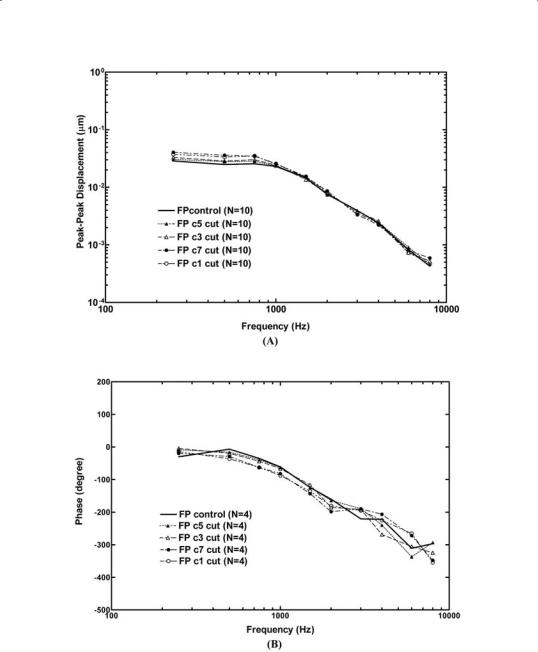
Fig. 2 shows mean frequency response curves of displacement at the umbo oftheTMmeasuredfrom10bonesfollowingtheligamentcuttingsequence: controlorintactossicularchainC5C3C7C1cut.PanelAdisplays the magnitude and panel B the phase angle. The results in Fig. 2 show that destruction of ligaments C5, C3, C7 and C1 a ects the umbo movement at low frequencies (f< 2 kHz). The first cut C5 did not show much e ect on the umbo vibration (<0.5 dB) and the C7 cut showed stronger influence on TM displacement than other ligaments.
215

216
Fig. 2 Mean peak-to-peak displacement curves measured at the umbo of the TM under the control and ligament cut sequence: C5C3C7C1. (A) Magnitude; (B) phase angle.
The mean displacement curves of the stapes footplate from 10 bones following the ligament cutting sequence are shown in Fig. 3. Panel A representsthemagnitudeandpanelBthephaseangle.Comparedwiththeumbo displacement data, the destruction of ligaments limited its e ect on the footplate movement at frequency below 1 kHz.
217
Fig.3Mean peak-to-peak displacement curves measured at the stapes footplate under the control and ligament cut sequence: C5C3C7C1. (A) Magnitude; (B) phase angle.
Fig. 4 displays the FE model-predicted displacement at the umbo of the TM with the magnitude (panel A) and phase (panel B) in response to the ligament removal sequential. The model results show that ligaments C5 and C3 did not have much e ect on the umbo movement, but C7 and C1 had considerable e ect on the umbo movement at low frequencies (f<2