


10 Lang et al |
|
|
|
Journal of the American Society of Echocardiography |
||
|
|
|
|
|
|
January 2015 |
|
|
|
|
|||
Table 3 Normal values for LV parameters obtained with 3DE |
|
|
|
|||
|
|
|
|
|
|
|
|
Aune et al. (2010) |
Fukuda et al. (2012) |
Chahal et al. (2012) |
|
Muraru et al. (2013) |
|
|
|
|
|
|
|
|
Number of subjects |
166 |
410 |
|
978 |
|
226 |
Ethnic makeup of population |
Scandinavian |
Japanese |
51% European white, 49% Asian Indian |
White European |
||
|
|
|
|
|
|
|
EDVi (mL/m2) |
|
|
|
|
|
|
Men, mean (LLN, ULN) |
66 (46, 86) |
50 |
(26, 74) |
White: 49 (31, 67); Indian: 41 (23, 59) |
63 (41, 85) |
|
|
|
|
|
|
|
|
Women, mean (LLN, ULN) |
58 (42, 74) |
46 |
(28, 64) |
White: 42 (26, 58); Indian: 39 (23, 55) |
|
56 (40, 78) |
ESVi (mL/m2) |
|
|
|
|
|
|
|
|
|
|
|
|
|
Men, mean (LLN, ULN) |
29 (17, 41) |
19 |
(9, 29) |
White: 19 (9, 29); Indian: 16 (6, 26) |
|
24 (14, 34) |
Women, mean (LLN, ULN) |
23 (13, 33) |
17 |
(9, 25) |
White: 16 (8, 24); Indian: 15 (7, 23) |
20 (12, 28) |
|
|
|
|
|
|
|
|
EF (%) |
|
|
|
|
|
|
|
|
|
|
|
|
|
Men, mean (LLN, ULN) |
57 (49, 65) |
61 |
(53, 69) |
White: 61 (49, 73); Indian: 62 (52, 72) |
62 (54, 70) |
|
|
|
|
|
|
|
|
Women, mean (LLN, ULN) |
61 (49, 73) |
63 |
(55, 71) |
White: 62 (52, 72); Indian: 62 (52, 72) |
|
65 (57, 73) |
|
|
|
|
|
|
|
EDVi, LV EDV index; ESVi, LV ESV index; LLN, lower limit of normal; NR, not reported; RT3DTTE, real-time 3D TTE; SVi, LV stroke volume index; ULN, upper limit of normal.
Modified with permission from Bhave et al.13 LLN and ULN are defined as mean 6 2 SDs.
Table 4 Normal ranges and severity partition cutoff values for 2DE-derived LV EF and LA volume
|
|
|
Male |
|
|
|
|
Female |
|
|
|
|
|
|
|
|
|
|
|
|
|
|
Normal |
Mildly |
Moderately |
Severely |
Normal |
Mildly |
Moderately |
Severely |
||
|
range |
abnormal |
abnormal |
abnormal |
|
range |
abnormal |
abnormal |
abnormal |
|
|
|
|
|
|
|
|
|
|
|
|
LV EF (%) |
52–72 |
41–51 |
30–40 |
<30 |
|
54–74 |
41–53 |
30–40 |
<30 |
|
Maximum LA volume/BSA (mL/m2) |
16–34 |
35–41 |
42–48 |
>48 |
|
16–34 |
35–41 |
42–48 |
>48 |
|
limits of normal. To provide some guidance, a peak GLS in the range of 20% can be expected in a healthy person. A selection of recently published data is provided in the Appendix together with the lower normal limits (Supplemental Table 6). There is evidence that women
have slightly higher absolute values of GLS than men and that strain values decrease with age.32,34 GLS is a valuable and sensitive tool for
follow-up examinations, provided the same equipment, tracing methodology, and software are used.
Recommendations. LV systolic function should be routinely assessed using 2DE or 3DE by calculating EF from EDV and ESV. LV EFs of <52% for men and <54% for women are suggestive of abnormal LV systolic function. Two-dimensional STE-derived GLS appears to be reproducible and feasible for clinical use and offers incremental prognostic data over LV EF in a variety of cardiac conditions, although measurements vary among vendors and software versions. To provide some guidance, a peak GLS in the range of 20% can be expected in a healthy person, and the lower the absolute value of strain is below this value, the more likely it is to be abnormal.
3. LV Regional Function
3.1. Segmentation of the Left Ventricle. For the assessment of regional LV function, the ventricle is divided into segments. Segmentation schemes should reflect coronary perfusion territories, result in segments with comparable myocardial mass, and allow standardized communication within echocardiography and with
other imaging modalities (Figure 3). Accordingly, a 17-segment model is commonly used. Beginning at the anterior junction of the interventricular septum and the RV free wall and continuing counterclockwise, basal and midventricular segments should be labeled as anteroseptal, inferoseptal, inferior, inferolateral, anterolateral, and anterior. In this 17-segment model, the apex is divided into five segments, including septal, inferior, lateral, and anterior segments, as well as the ‘‘apical cap,’’ which is defined as the myocardium beyond the end of the LV cavity (Figures 3 and 4).35 The 17-segment model may be used for myocardial perfusion studies or when comparing between different imaging modalities, specifically single photon-emission computed tomography, positron emission tomography, and CMR. Figure 5 shows a schematic representation of the perfusion territories of the three major coronary arteries. When using this 17-segment model to assess wall motion or regional strain, the 17th segment (the apical cap) should not be included.
Alternative segmentation models treat the apex differently: the 16segment model36 divides the entire apex into the same four segments (septal, inferior, lateral, and anterior; Figure 3, left). Also, some segmentation schemes divide the apex into six segments, similar to the basal and midventricular levels, resulting in an 18-segment model (Figure 3, right) that is simple but results in a slight overrepresentation of the distal myocardium when scoring.
All segments can be visualized by 2DE. On average, the twochamber view and the apical long-axis view intersect with the four-chamber view at angles of approximately 53 and 129 ,
Journal of the American Society of Echocardiography |
Lang et al 11 |
Volume 28 Number 1 |
|
Figure 3 Schematic diagram of the different LV segmentation models: 16-segment model (left),36 17-segment model (center),35 and 18-segment model (right). In all diagrams, the outer ring represents the basal segments, the middle ring represents the segments at midpapillary muscle level, and the inner ring represents the distal level. The anterior insertion of the right ventricular wall into the left ventricle defines the border between the anteroseptal and anterior segments. Starting from this point, the myocardium is subdivided into six equal segments of 60 . The apical myocardium in the 16and 17-segment models is divided instead into four equal segments of 90 . In the 17-segment model an additional segment (apical cap) is added in the center of the bull’s-eye. (modified from Voigt et al.24).
respectively,37 allowing the assessment of the central region of all segments from an apical window, independent of the model used. Although certain variability exists in the coronary artery blood supply to myocardial segments, segments are usually attributed to the three major coronary arteries (Figure 5).35
3.2.Visual Assessment. In echocardiography, regional myocardial function is assessed on the basis of the observed wall thickening and endocardial motion of the myocardial segment. Because myocardial motion may be caused by adjacent segment tethering or overall LV displacement, regional deformation (thickening, shortening) should be the focus of the analysis. However, it must be recognized that deformation can also be passive and therefore may not always accurately reflect myocardial contraction.
It is recommended that each segment be analyzed individually in multiple views. A semiquantitative wall motion score can be assigned to each segment to calculate the LV wall motion score index as the average of the scores of all segments visualized. The following scoring system is recommended: (1) normal or hyperkinetic, (2) hypokinetic (reduced thickening), (3) akinetic (absent or negligible thickening, e.g., scar), and (4) dyskinetic (systolic thinning or stretching, e.g., aneurysm).
An aneurysm is a morphologic entity that demonstrates focal dila-
tation and thinning (remodeling) with either akinetic or dyskinetic systolic deformation.38 In contrast to the recommendation of previous guidelines,1,2 this committee refrains from assigning a separate wall motion score for aneurysm.
3.3.Regional Wall Motion during Infarction and Ischemia. Depending on the regional coronary flow reserve, stress echocardiography may reveal significant coronary artery stenoses by means of inducing a wall motion abnormality. Myocardial scar may also result in regional dysfunction of variable severity.
Echocardiography can overor underestimate the amount of ischemic or infarcted myocardium, depending on the function of adjacent regions, regional loading conditions, and stunning.39 In stress echocardiography, visual recognition of regional dysfunction can be improved with a synchronized side-by-side comparison of baseline and stress images using digital technology.40
3.4.Regional Abnormalities in the Absence of Coronary Artery Disease. Regional wall motion abnormalities may also occur in the absence of coronary artery disease, in a variety of conditions, such as myocarditis, sarcoidosis, and stress-induced (takotsubo) cardiomyopathy. Abnormal motion patterns of the interventricular septum may be found postoperatively or in the presence of a left bundle branch block or RV epicardial pacing, as well as RV dysfunction caused by RV pressure or volume overload. Furthermore, some conduction delays can cause regional wall motion abnormalities in the absence of primary myocardial dysfunction. This regional dysfunction
is due to the abnormal sequence of myocardial activation, which causes heterogeneous loading conditions and remodeling.41 Ideally, the temporal sequence of activation and motion should be described. Characteristic motion patterns, which result from abnormal activation
sequences, such as septal bounce (‘‘beaking,’’ ‘‘flash’’) or lateral apical motion during systole (‘‘apical rocking’’) should be reported.42-45
3.5.Quantification of Regional Wall Motion Using Doppler and STE. Echocardiographic quantification of regional myocardial
function is currently based on DTI or speckle-tracking echocardiographic techniques.46-48 Both techniques provide comparable data quality, although DTI is known to be angle dependent and prone to underestimating motion that is not parallel to the ultrasound beam. Commonly used parameters include velocity, motion, deformation, and deformation rate. Because velocity and motion are measured relative to the transducer, measurements may be influenced by
12 Lang et al |
Journal of the American Society of Echocardiography |
|
January 2015 |
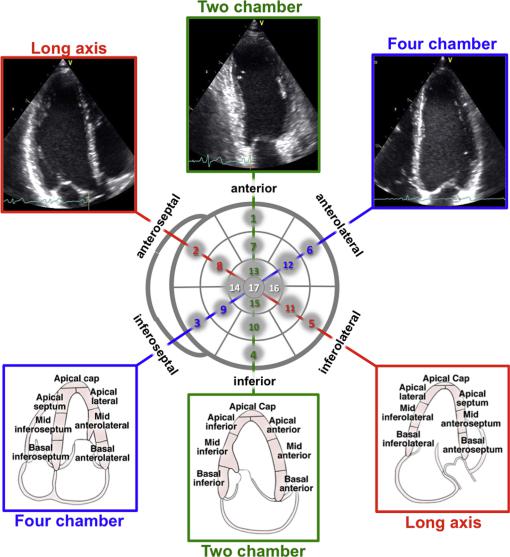
Figure 4 Orientation of apical four-chamber (A4C), apical two-chamber (A2C), and apical long-axis (ALX) views in relation to the bull’s-eye display of the LV segments (center). Top panels show actual images, and bottom panels schematically depict the LV wall segments in each view.
tethering or overall heart motion. Accordingly, the use of deformation parameters, such as strain and strain rate, is preferable.
The most commonly used deformation parameter is longitudinal strain during LV systole. Similar to global strain, with current technology, regional deformation measurements may vary in amplitude, depending on the myocardial region being investigated, the measurement methodology, the vendor, and sample volume definition. Therefore, no specific normal ranges are provided in this document. These values await the upcoming consensus document of the joint task force of the ASE, EACVI, and the industry for the standardization of quantitative function imaging.23,25
Independent of strain magnitude, characteristic changes in temporal pattern of myocardial deformation can be assessed as well. Longitudinal shortening or radial thickening of the myocardium after aortic valve closure (postsystolic shortening or thickening, sometimes referred to as tardokinesis) of >20% of the total deformation during the cardiac cycle is a consistent sign of regional functional inhomogeneity (e.g., ischemia, scar).44 The development of postsystolic
shortening during a stress test has been proposed as an indicator of regional ischemia.49 The value of regional deformation parameters and temporal patterns of strain derived by speckle-tracking from either 2D or 3D echocardiographic data sets is the subject of ongoing research and remains to be determined.50,51
Recommendations. Different LV segmentation models are used in clinical practice. The 17-segment model is recommended to assess myocardial perfusion with echocardiography and other imaging techniques. The 16-segment model is recommended for routine studies assessing wall motion, because endocardial excursion and thickening of the tip of the apex are imperceptible. To assess wall motion, each segment should be evaluated in multiple views and a four-grade scoring should be applied: (1) normal or hyperkinetic, (2) hypokinetic (reduced thickening), (3) akinetic (absent or negligible thickening), and (4) dyskinetic (systolic thinning or stretching). Despite promising data, quantitative assessment of the magnitude of regional LV deformation cannot be recommended at this stage because of lack of