

28
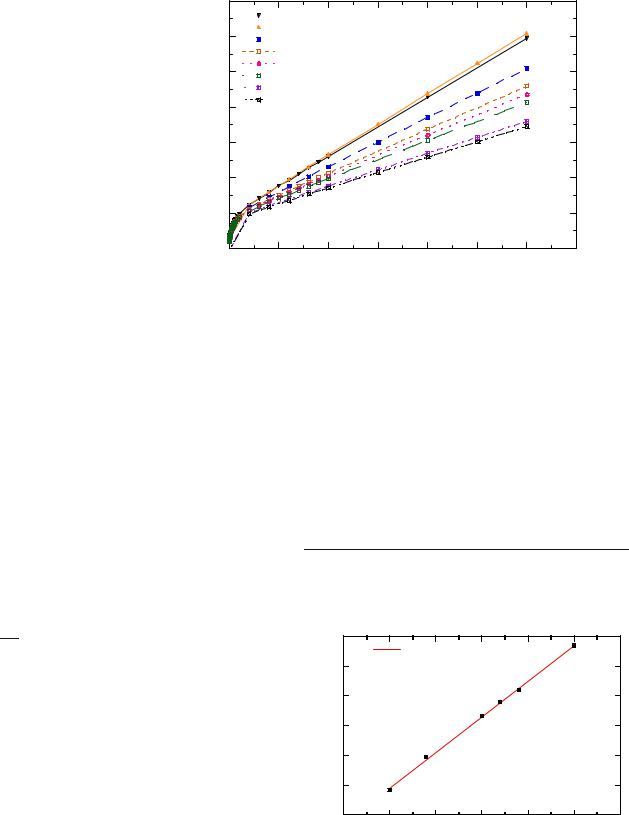
Fig. 12 Magnetization of LiFePO4 as a function of the applied field in the temperature range 4–300 K
Magnetic moment (emu/mol)
700 |
|
|
|
|
|
|
|
|
|
|
|
|
|
|
|
|
|
|
|
|
|
|
|
4 K |
|
|
|
|
|
|
|
|
|
|
|
|
|
|
600 |
|
|
|
|
|
|
|
|
|
|
100K |
|
|
|
|
|
|
|
|
|
|
|
|
||
|
|
|
|
|
|
|
|
|
|
150 K |
LiFePO4 |
|
|
|
|
|
|
|
|
|
|
|
|||
|
|
|
|
|
|
|
|
|
|
|
||
|
|
|
|
|
|
|
|
|
|
|
200 K |
|
500 |
|
|
|
|
|
|
|
|
|
|
220 K |
sample D802 |
|
|
|
|
|
|
|
|
|
|
240 K |
||
|
|
|
|
|
|
|
|
|
|
|
|
|
|
|
|
|
|
|
|
|
|
|
|
280 K |
|
|
|
|
|
|
|
|
|
|
|
|
|
|
400 |
|
|
|
|
|
|
|
|
|
|
300 K |
|
|
|
|
|
|
|
|
|
|
|
|
||
|
|
|
|
|
|
|
|
|
|
|
|
300
200
100
0
0 |
5000 |
10000 |
15000 |
20000 |
25000 |
30000 |
35000 |
the Co content increases, is observed in all the ZFCand FC-type curves for χm(T). In the high-field region, at this temperature, it is possible to obtain the magnetic anisotropy, K, from the magnetization measurements vs the magnetic field. To do so, we have to take into account that the magnetization approach to saturation can be fitted to the expression [1]
|
|
a |
|
b |
|
(9) |
MðHÞ ¼ MS 1 |
|
H |
|
H2 |
þ cH; |
where MS is the saturation magnetization and a, b, and c are suitable constants. The second term, cH, is the low-field contribution, which is negligible near the saturation. Two examples of these fits for the LiNi1−yCoyO2 samples with y=0.2 and 0.4 can be seen in Fig. 7a,b, and that the b constant is related to the magnetic anisotropy, K, by the expression [20]
K2 |
|
b ¼ β MS2 ; |
(10) |
where β is a constant that depends on the type of material. Assuming a typical value for the β constant (i.e., β=0.0762 [21]), we can deduce the magnetic anisotropy
constant from first magnetization curves from
|
|
bM2 |
1=2 |
|
K ¼ |
|
: |
(11) |
|
0:0762 |
||||
|
|
S |
|
|
Following this procedure, we find that the magnetic anisotropy value, which is 6.5×10⁶ erg/cm3 for the LiNiO2 sample at 200 K, increases upon cobalt doping. Interestingly enough, these values are related to the volume of the magnetic clusters that lead to the blocking temperature in
Magnetic field (Gauss)
the χm(T) ZFCand FC-type curves. In this context, we can assume [1]
KV ¼ 25kB TB; |
(12) |
where V is the volume of the magnetic clusters, kB is the Boltzmann’s constant, and TB is the blocking temperature of each particular sample.
Now, supposing that these magnetic clusters are spherical, we obtain that they would have a mean radii of R=3.5 nm in the case of the LiNiO2 sample, and that their size decreases upon Co-doping, becoming R=1.2 nm in the sample with y=0.2, and being further reduced to 0.5 nm in the samples with y=0.3 and 0.4, as shown in Fig. 7.
Magnetic properties of spinels
The spinel material LiMn2O4 can be cycled at ca. 4 V vs Li+/Li from LiMn2O4 to λ-MnO2 with manganese ions
|
110 |
|
|
|
|
|
|
|
|
|
y = 35.203 + 0.2389x |
R= 0.99951 |
|
|
|
|
100 |
θp = -145 K |
|
|
|
|
|
(mol/emu) |
|
|
|
|
|
||
90 |
Cp = 4.18 emuK/mol |
|
|
|
|
||
80 |
|
|
|
|
|
|
|
1/χ |
|
|
|
|
|
|
|
|
|
|
|
LiFePO4 |
|
||
|
70 |
|
|
|
|
||
|
|
|
|
|
sample D802 |
|
|
|
60 |
|
|
|
|
|
|
|
50 |
100 |
150 |
200 |
250 |
300 |
350 |
|
50 |
||||||
Temperature (K)
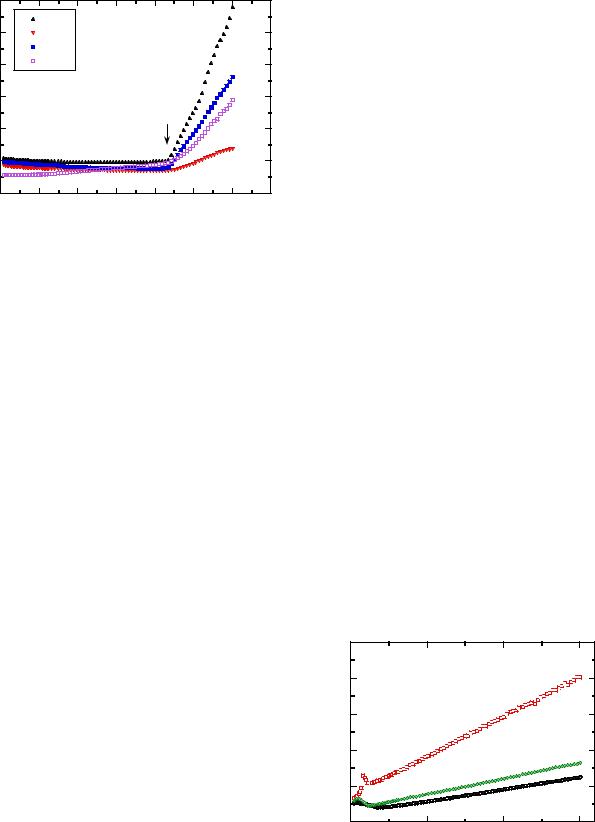
Fig. 13 Plot of the dM/dH slope of the magnetization curves to extract χm
|
60 |
|
|
|
|
b2_1 |
|
(mole/emu) |
50 |
a3_4 |
|
|
b2_2 |
LiFePO4 |
|
40 |
d752 |
||
30 |
|
|
|
|
|
|
|
m |
|
|
Tc |
1/χ |
|
|
|
20 |
|
|
|
|
|
|
|
|
10 |
|
|
|
0 |
|
|
Fig. 14 The inverse of the magnetic susceptibility χm(T) of LiFePO4 samples synthesized by different sol-gel methods
remaining the spinel host lattice throughout. LiMn2O4 spinel
has shown interesting magnetic properties [22–27]. From the point of view of magnetic interactions, both direct (Mn3+/4+– Mn3+/4+) and superexchange (90° Mn3+/4+–O2−Mn3+/4+) inter-
actions are conceivable between the nearest Mn neighbors. According to Goodenough, only Mn4+–O2−Mn4+ interaction is in ferromagnetic coupling, while all other interactions are in antiferromagnetic coupling [28].
λ-Li0.08MnO2
Figure 8 shows the inverse magnetic susceptibility obtained after the lithium extraction from LiMn2O4. Over the temperature range 100–300 K, assuming that only the spin part of the Mn ions contributes to paramagnetic moment, the fit of the Curie–Weiss law is obtained with the following values: θp=−75 K and Cp=3.29 emu K/mol. The θp value is negative, consistent with the apparent antiferromagnetic ordering below TN=30 K. From the Curie constant, the effective moment is determined to be μeff=3.70μB, which is a value smaller than the theoretical spin-only value of 3.87μB for Mn4+ ion. An increase in the nominal manganese oxidation state from +3.5 to +4 should result in a greater covalence state due to the removal of σ antibonding eg electrons associated with the manganese 3d
state. So, λ-MnO2 has a greater covalency in the Li–O– Mn4+ bond than in the Li–O–Mn3.5+ bond.
The abrupt increase of magnetization (insert of Fig. 8) is noticeable with decreasing temperature below 30 K, indicating the presence of a ferromagnetic component. The origin of this ferromagnet could be a small amount of impurity phases, such as ferromagnetic Mn3O4, which is probably produced during the lithium extraction from LiMn2O4. However, the observation of spin-glass behavior at temperatures below the paramagnetic regime in the cubic
phases LiMn2O4 and λ-Li0.07MnO2 has been reported by Jang et al. [24]. The existence of frozen spins is consistent
with the presence of a significant fraction of spins disordered well below the Néel temperature. The value of the ratio f=θp/TN=2.5 is indicative of a frustrated antiferromagnet. The geometric frustration inherent in the Mn
29
sublattice, which is comprised of a three-dimensional array of a corner-sharing tetrahedral, has been discussed by Greedan et al. [26].
LiMn2O4
Figure 9 shows the reciprocal magnetic susceptibility of a LiMn2O4 sample synthesized by wet-chemical technique, i.e., succinic-assisted sol-gel method [29]. In the temperature range 2–300 K, the ZFC and FC curves present complex behaviors including a Curie–Weiss law above 140 K. The extracted Curie–Weiss parameters are θp= −260 K and Cp=4.85 emu K/mol. The negative Weiss constant indicates that antiferromagnetic interactions are dominant over ferromagnetic superexchange interactions in the paramagnetic temperature regime. These are the exchange interaction components across a shared octahe- dral-site edge in LiMn2O4 [30].
The measured effective magnetic moment is μeff=4.29 μB. The value peff=4.29 is close to the theoretical spin-only value peff=4.38, assuming that only Mn3+ and Mn4+
moments are responsible to the paramagnetic behavior of χm(T), i.e., for Mn3.5+ valence state (peff=3.87 and Cp=1.87 emu K/mol for Mn4+; peff=4.90 and Cp=3.0 emu K/mol for Mn3+). The magnetization curves display a clear
splitting of the ZFC and FC data occurring below the paramagnetic temperature regime. A sharp maximum appears at 20 K in the ZFC magnetization. Jang et al. have reported a spin-glass-like behavior indicating the presence of frozen spins in cubic phases λ-MnO2 and LiMn2O4 [31]. The randomness and frustration necessary for spin-glass-like behavior are explained by the octahedral antiferromagnetic network in the [Mn2]O4 sublattice spinel structure, combined with some magnetic disorder. The disorder due to the presence of a valence distribution in the Mn ions is provoked by competing ferroand antiferromagnetic exchange interactions. This is believed to be responsible for the complex magnetic structure. Frozen spin was also observed in a neutron diffraction study by Oohara et al. [32]. Magnetic susceptibility measurements
|
50 |
|
|
|
|
|
40 |
|
|
LiNiPO4 |
|
-3 g.Oe/emu) |
|
|
|
||
30 |
|
|
|
|
|
|
|
|
|
|
|
(10 |
20 |
|
|
|
LiCoPO4 |
|
|
|
|
||
χ-1 |
|
|
|
|
|
|
10 |
|
|
|
LiMnPO4 |
|
|
|
|
|
|
|
0 |
0 |
100 |
200 |
300 |
|
|
|
|
Temperature (K) |
|
Fig. 15 The temperature dependence of the reciprocal magnetic susceptibility χm(T) of LiMPO4 samples (M=Ni, Co, Mn)