

24
|
1.5 |
|
|
|
|
|
|
|
|
|
1.4 |
|
TN |
|
ZFC |
|
a |
|
|
|
|
|
|
|
(emu/g) |
1.2 |
|
|
|
FC |
|
|
|
|
|
|
|
||
/g) |
|
1.0 |
|
|
|
|
|
|
|
|
|
|
|
|
|
cm |
1.0 |
M/H |
|
|
|
|
|
3 |
|
|
0.8 |
|
|
|
|
|
|
|
|
|
|
|
|
-3 |
|
|
0.6 |
|
|
|
|
(10 |
|
|
|
|
|
|
|
|
|
0 |
5 |
10 |
15 |
20 |
|
M/H |
0.5 |
|
|||||
|
|
|
Temperature (K) |
|
|||
|
|
|
|
|
|
||
Li0.99Ni1.01O2
TN=8 K
0.0
0 |
100 |
200 |
300 |
Temperature (K)
|
120 |
|
|
|
|
|
|
|
|
|
|
Li0.99Ni1.01O2 |
|
|
|||
|
|
80 |
|
θp=30 K |
|
|
|
|
/g) |
|
Cp=0.004 emu K/g |
|
|
|
|||
|
|
|
|
|
||||
|
|
|
|
|
|
|
|
|
3 |
|
|
|
µ=1.77µB |
|
|
|
|
(cm |
|
|
|
|
|
|
|
|
|
|
|
|
|
|
|
|
|
-1 |
|
|
|
|
|
|
|
|
m |
40 |
|
|
|
|
|
|
|
χ |
|
|
|
|
|
|
|
|
|
|
|
|
|
|
|
b |
|
|
|
0 |
|
|
|
|
|
|
|
|
0 |
50 |
100 |
150 |
200 |
250 |
300 |
Temperature (K)
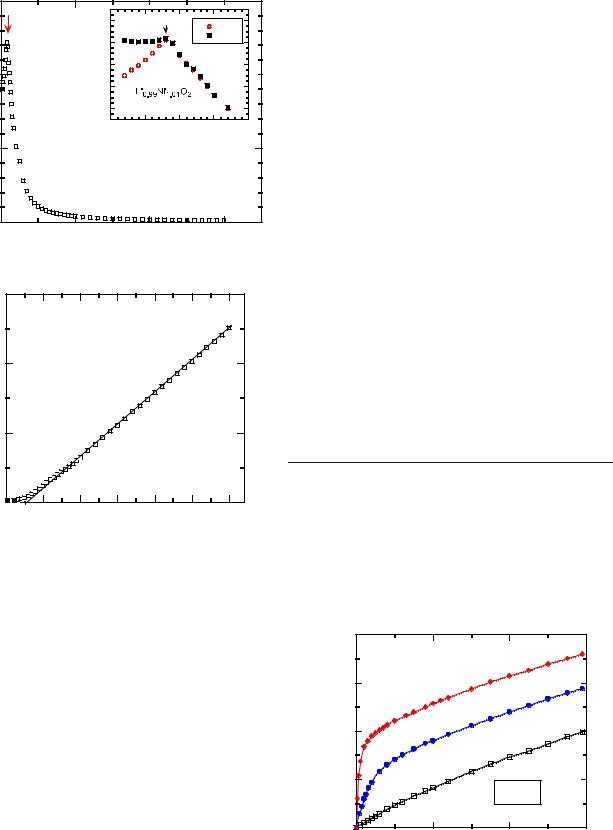
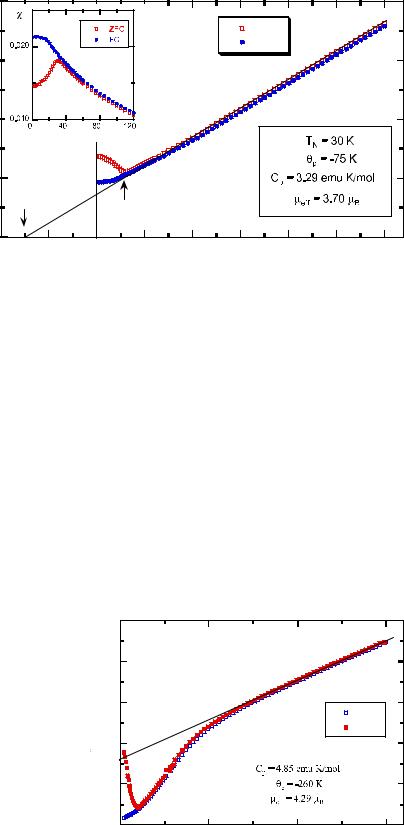
Fig. 3 a Temperature dependence of the magnetic susceptibility of
Li0.99Ni1.01O2. Insert shows the ZFC and FC low-temperature region. b Reciprocal susceptibility of Li0.99Ni1.01O2
of the high-temperature asymptote to the χm1(T) curve. Depending on the type of antiferromagnetic interactions, θp could be positive or negative. It should be emphasized that θp is different than the Néel temperature, TN, which is the temperature at which an antiferromagnetic material becomes paramagnetic—that is, the thermal energy becomes large enough to upset the magnetic ordering
within the material. TN corresponds to the cusp in the χm1(T) curve.
In metals, the conduction electrons are not spatially localized like electrons in partially filled ionic shells. Thus, the magnetic susceptibility of metals follows the Pauli-type paramagnetism, which is essentially independent on temperature [4]. In contrast, the magnetic susceptibility of localized electrons closely follows inverse temperature dependence due to the thermal agitation of spin moments. The magnetic molar susceptibility of localized moments will exhibit Curie–Weiss behaviors in the absence of strong ferromagnetic, ferrimagnetic, or antiferromagnetic couplings.
Many battery-grade materials are paramagnetic in the discharged or charged state. For example, the positive electrode material LiMn2O4 is a mixed-valence compound containing Mn3+ (d4) and Mn4+ (d3) ions. Although the low-spin (d6) Co3+ ions (nominally diamagnetic) in LiCoO2 have paired d-electrons in the fully discharged state, Li1−xCoO2 contains Co4+ (d5) ions when charged. LiNiO2 contains the paramagnetic S=1/2 ions Ni3+ (d7) in the discharged state.
Magnetic properties of layered oxides
A wide variety of LiICs have been studied which include layered compounds based on the α-NaFeO2-type structure (e.g., LiCoO2, LiNiO2, LiNi0.5Mn0.5O2). The structure– magnetic relationships of sodium and lithium ferrites have been investigated to evaluate detectable ferromagnetic impurities [6, 7]. The α-NaFeO2-type structure is built by alternating layers of trigonally distorted FeO6 and NaO6
The saturation magnetization MS is defined as the spontaneous magnetic moment per unit volume. The Curie point Tc is the temperature above which the spontaneous moment vanishes. For iron, Tc=1,043 K [4].
The antiferromagnetic state is characterized by an ordered, antiparallel arrangement of electron spins. The simplest situation in antiferromagnetism arises when the lattice of paramagnetic ions can be divided into two interpenetrating sublattices. We recognize antiferromagnetism by a well-defined kink in the curve of the magnetic susceptibility vs temperature. This kink determines the Néel temperature, TN. Antiferromagnets are also characterized by a negative value of the Curie temperature. Figure 1 summarizes the temperature dependence of the magnetic susceptibility for paramagnetic, ferromagnetic, and antiferromagnetic solids.
The paramagnetic temperature θp (also called the Weiss constant) is defined as the intercept of the temperature-axis
|
2000 |
|
|
|
(emu/mol)) |
|
Li1-zNi1+zO2 |
z=0.08 |
|
|
|
|
||
1500 |
|
|
|
|
|
|
z=0.04 |
|
|
|
|
|
|
|
moment |
1000 |
|
|
|
|
|
z=0.01 |
|
|
|
|
|
|
|
Magnetic |
500 |
|
|
|
|
|
T=40 K |
|
|
|
|
|
|
|
|
0 |
|
|
|
|
0.0 |
1.0 |
2.0 |
3.0 |
H (Tesla)
Fig. 4 Magnetization M(H) recorded at 40 K vs stoichiometric deviation in Li1−zNi1+zO2 layered compound
|
|
|
|
|
|
|
|
|
|
|
|
|
|
|
|
|
|
|
|
|
|
|
|
|
|
|
|
|
|
|
|
|
|
|
|
|
|
|
|
|
|
|
|
|
|
|
|
|
|
|
|
|
|
|
|
|
|
(emu/mol) |
|
|
|
|
|
|
|
|
|
|
|
|
|
|
|
|
|
|
|
|
FC |
|
|
|
||||
|
|
|
|
|
|
|
|
|
|
|
|
|
|
|
|
|
|
|
|
|
|
|
||||||
10 |
|
|
|
|
|
|
|
|
|
|
|
|
|
|
|
|
|
|
|
ZFC |
|
|
|
|
||||
|
|
|
|
|
|
|
|
|
|
|
|
|
|
|
|
|
|
|
|
|
|
|
|
|||||
|
|
|
|
|
|
|
|
|
|
|
|
|
|
|
|
|
|
|
|
|
|
|
|
|
|
|
|
|
moment |
|
|
|
|
|
|
|
|
|
|
LiNi0.8Co0.2O2 |
|
|
|||||||||||||||
|
|
|
|
|
|
|
|
|
|
|
|
|||||||||||||||||
|
|
|
|
|
|
|
|
|
|
|
|
|
||||||||||||||||
5 |
|
|
|
|
|
|
|
|
|
|
|
|
|
|
|
|
|
|
|
|
|
|
|
|
|
|
|
|
|
|
|
|
|
|
|
|
|
|
|
|
|
|
|
|
|
|
|
|
|
|
|
|
|
|
|
||
Long |
|
|
|
|
|
|
|
|
|
|
|
|
|
|
|
|
|
|
|
|
|
|
|
|
|
|
|
|
|
|
|
|
|
|
|
|
|
|
|
|
|
|
|
|
|
|
|
|
|
|
|
|
|
|
|
|
|
0 |
|
|
|
|
|
|
0 |
50 |
100 |
150 |
200 |
250 |
300 |
Temperature (K)
|
0.30 |
|
(emu/mol) |
FC |
|
ZFC |
||
|
||
|
0.20 |
|
moment |
LiNi0.7Co0.3O2 |
|
H=50 Oe |
||
Long |
0.10 |
|
|
0.00 |
|
|
|
|
|
|
0 |
50 |
100 |
150 |
200 |
250 |
300 |
Temperature (K)
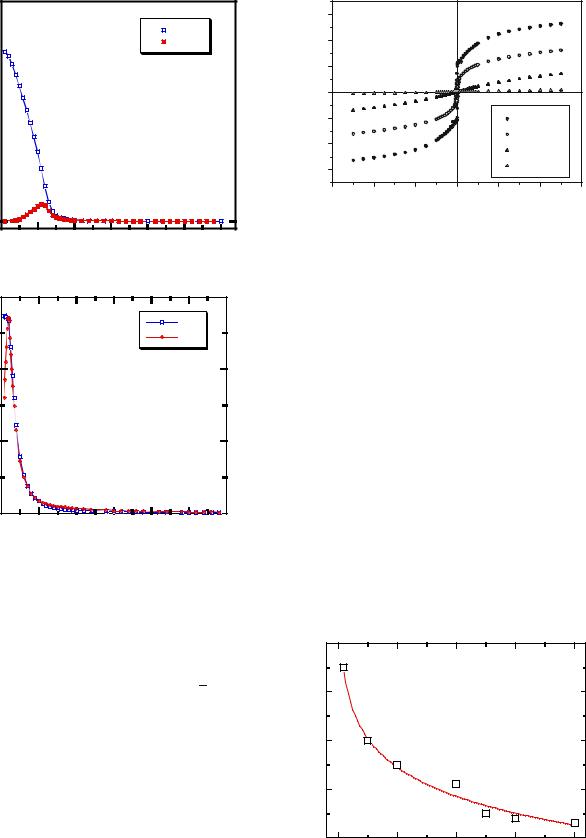
Fig. 5 Temperature of the ZFC and FC molar magnetic susceptibility measured under a field H=50 Oe of LiNi1−yCoyO2 samples for ay=0.2 and by=0.3. A strong deviation from the paramagnetic behavior is observed at low-temperatures for the y=0.2 sample
octahedra sharing edges. Many LiMO2 (M=Ni, Co, Fe, and Cr) compounds have this typical structure which is suitable for very efficient electrochemical lithium extraction–inser- tion process. The unit cell is rhombohedral (R3m space group). The transition-metal ions M are located in octahedral 3a (000) sites, and oxygen anions are in a cubic close-packing, occupying the 6c (00z, 00z) sites. Li cations reside at Wyckoff 3b (001/2) sites. The transition metal and lithium ions are occupying the alternating (111) planes.
α-NaFeO2
Samples of α-NaFeO2 prepared by hydrothermal treatment of a mixture of α-FeOOH and concentrated NaOH aqueous
25
|
3000 |
|
|
|
|
|
|
|
2000 |
|
|
|
|
|
|
M(emu/mol) |
1000 |
|
|
|
|
|
|
0 |
|
|
|
|
|
|
|
|
|
|
|
|
|
|
|
|
-1000 |
|
|
|
|
T= 5K |
|
|
-2000 |
|
|
|
|
T=50K |
|
|
|
|
|
|
T=100K |
|
|
|
|
|
|
|
|
|
|
|
-3000 |
|
|
|
|
T=300K |
|
|
|
|
|
|
|
|
|
|
-60 |
-40 |
-20 |
0 |
20 |
40 |
60 |
H(kOe)
Fig. 6 ZFC magnetization vs applied magnetic field at T=5, 50, 100, and 300 K for LiNi0.8Co0.2O2
solution appear as simple antiferromagnets below the Néel temperature TN=11 K. Therefore, they do not include any ferromagnetic clusters such as Fe3O4 or γ-Fe2O3 particles. The temperature dependence of the molar magnetic susceptibility is shown in Fig. 2.
Fitting with the Curie–Weiss law, one obtains Cp=4.17 emu K/mol and θp=−10 K. The negative θp value suggests that antiferromagnetic interactions are present in α-NaFeO2. Using Eq. (2), the effective magnetic
moment, μeff, is calculated to be 5.8 μB, which is very close to a spin-only value of high-spin Fe3+ (5.92 μB).
The effective magnetic moment of LiFeO2 is affected markedly by the contribution of ferromagnetic impurities, easily saturated at the magnetic fields used in the experiments. Two anomalies have been revealed at 40–50 and 90–280 K. The presence of a ferromagnetic impurity such as LiFe5O8 spinel gives a relatively high μeff value. The variation of the Néel temperature for various LiFeO2 polymorphs is related to the degree of tetragonal distortion [8].
|
4 |
|
|
|
|
(nm) |
3 |
|
|
|
|
|
|
LiNi1-yCoyO2 |
|
||
Cluster radius |
2 |
|
|
|
|
1 |
|
|
|
|
|
|
0 |
|
|
|
|
|
0.0 |
0.1 |
0.2 |
0.3 |
0.4 |
Composition y(Co)
Fig. 7 Size of the ferromagnetic clusters in LiNi1−yCoyO2 samples
26
Fig. 8 Inverse ZFC and FC magnetic susceptibility for λ-
Li0.08Mn2O4 as a function of temperature in a field of 0.1 T
|
200 |
|
|
ZFC |
|
|
FC |
|
(mol/emu) |
150 |
|
λ-Li0.08MnO2 |
||
|
||
|
100 |
|
|
T |
χ -1 m
50
θp
TN
0 |
|
|
|
|
|
|
|
|
-100 |
-50 |
0 |
50 |
100 |
150 |
200 |
250 |
300 |
LiNiO2
The difficulty of obtaining stoichiometric LiNiO2 free from the presence of excess Ni ions randomly distributed at predominantly Li sites (3b Wyckoff position) is known. The magnetic properties are extremely sensitive to the Ni2+ ion distribution and should be useful to evaluate the stoichiometry deviation in Li1−xNi1+xO2. However, the confusion of magnetic properties lies in the quality of the sample. Hirakawa et al. suggested an S=1/2 Ising-type antiferromagnetic triangular lattice in the crystal [9]. Other possibilities, such as ferri-magnetism [10], ferromagnetism [11], a new type of spin-frozen states [12], and spin glass [13–16], have been evoked.
Figure 3a shows the temperature dependence of the magnetic susceptibility of Li0.99Ni1.01O2. The insert displays the ZFC and FC low-temperature region. After ZFC, a cusp-like peak is observed at 8 K corresponding to the Néel temperature. On the other hand, the FC susceptibility shows little temperature dependence below TN. Such behavior is that of a typical spin glass. The reciprocal susceptibility (Fig. 3b) follows the Curie–Weiss law above 100 K. The parameters obtained by least-square fitting [Eq. (2)] are Cp=0.004 emu K/g and θp=30 K. The effective Bohr magneton number is peff=1.77. This value is close to that of Ni3+ ion at low-spin state (S=1/2, p=2[S(S+1)] 1/2=1.73). The small deviation of the experimental peff is due to the presence of Ni2+ ions (S=1, p=2.83) at the 3b sites.
Considering that the total susceptibility of a given material is the sum the susceptibility of the various magnetic cations present in the lattice, the effective momentum number peff of Li0.99Ni1.01O2 is defined as
Temperature (K)
As magnetic measurements are extremely sensitive to the Ni distribution, Eq. (6) is used to evaluate the stoichiometry deviation in Li1−zNi1+zO2. From Fig. 3, one determines the quantity z=0.01.
Figure 4 shows the applied magnetic field dependence on the magnetization curves M(H) as a function of the stoichiometric deviation, z, in Li1−zNi1+zO2. The samples were subjected to ZFC down to 4 K and a magnetic field was applied. These data, recorded at 40 K (paramagnetic phase), show clearly the systematic dependence of the effect of stoichiometric deviation on the magnetic behavior. The magnetization can be divided into an extrinsic component of ferromagnetic clusters which saturate easily under the application of a magnetic field of few hundred Gauss, plus the intrinsic part which remains linear in H up to the largest field investigated. Using the superparamag-
|
120 |
|
|
|
|
100 |
LiMn2O4 |
|
|
|
|
|
|
|
-1 (emu/mol) |
80 |
|
|
H = 1 T |
|
|
|
||
|
|
|
FC |
|
|
|
|
ZFC |
|
60 |
|
|
|
|
χ |
|
|
|
|
|
40 |
|
|
|
|
20 |
|
|
|
|
0 |
100 |
200 |
300 |
|
|
ð1 zÞpeff2 |
|
|
|
|
|
|
1=2 |
Temperature (K) |
|
|
|
|
|
|
|
|
|||
peff |
¼ |
Ni3þ |
Þ |
þ zpeff2 |
ð |
Ni2þ |
; |
(6) Fig. 9 The reciprocal magnetic susceptibility of LiMn2O4 sample |
||
|
|
ð |
|
|
|
Þ |
|
synthesis by succinic-assisted sol-gel method |
|
2000 |
|
|
|
|
|
|
|
|
|
|
LiMn2-yCoyO4 |
|
|
|
|
|
||
|
1500 |
|
|
|
|
|
|
|
|
(emu) |
|
|
|
|
|
|
|
|
|
1/Long Moment |
1000 |
|
|
|
|
|
|
|
|
|
|
|
|
|
|
|
y=0.0 |
|
|
|
500 |
|
|
|
|
|
|
y=0.4 |
|
|
|
|
|
|
|
|
|
y=0.6 |
|
|
|
|
|
|
|
|
|
y=1.0 |
|
|
0 |
|
|
|
|
|
|
|
|
|
-50 |
0 |
50 |
100 |
150 |
200 |
250 |
300 |
350 |
Temperature (K)
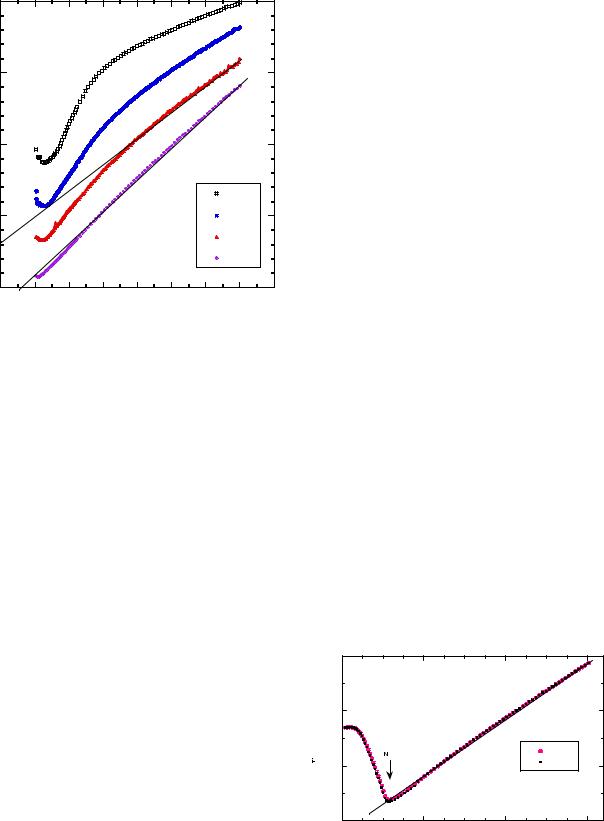
Fig. 10 Temperature dependence of the reciprocal magnetic susceptibility of Co-substituted LiMn2−yCoyO4 spinels
netic formalism, the magnetization curves are readily computed from the equation:
M ¼ Mclu þ χintH; |
(7) |
where χint is the intrinsic susceptibility and Mclu(T,H) is the self-consistent solution of Eq. (6)
McluðT; HÞ ¼ Nμeff ð0Þ£ |
kBðTÞ |
: |
(8) |
|
nμeff 0 |
H |
|
£ is the Langevin function, N represents cluster concentration, n is the concentration of ferromagnetic particles per cluster, and μeff is the magnetic moment associated with one cluster. Here the Langevin function can be used due to the presence of macroscopic spins μeff(0). Using Eqs. (7)
and (8), the fit of the magnetization curve allows us to determine the Ni2+ content in Li1−zNi1+zO2.
LiNi1yCoyO2
Because isostructural LiCoO2–LiNiO2 solid solutions display better electrochemical cyclability than parent oxide end-members, it is now generally recognized that LiNi0.8Co0.2O2 is a potential next-generation positive electrode material to replace LiCoO2. LiNi1−yCoyO2 compounds with 0≤y≤1 were prepared as polycrystalline nanomaterials (d≈200 nm) following a low-temperature sol-gel method [17]. XRD studies indicate that these materials are single phase for 0.2≤y≤1.0 with an ordered distribution of Li and Ni/Co in the layered structure. Nevertheless, as this technique provides only averaged
27
structural information, it is still possible that, locally, there are some defects, among them disorder, that could affect the electrochemical behaviors of these materials. In fact, through FTIR spectroscopy, we observe for the Li–O band a slight deviation from a linear behavior for high nickel content (y≤0.2), which is attributed to the presence of Ni cations in the octahedral interstices of the predominantly lithium layers (cation mixing). In addition, by means of magnetic measurements, χm(T) and M(H), we detect in all the samples a ferrimagnetic signal, which gets smaller and smaller as the Co content increases, but indeed reveals the presence of some Ni2+ ions occupying Li+ sites that would lead to the formation of small ferromagnetic islands. From those magnetic measurements, we have estimated the size of nanometric magnetic inhomogenities.
Figure 5a and b show the temperature dependence of the magnetic moment of LiNi1−yCoyO2 for y=0.2 and y=0.3, respectively. The first general observation is that the samples with high Ni content (y≤0.2) show ferrimagnetic behavior with a value of Tc, which quickly decreases from
Tc(y=0) 215 K to Tc(y=0..2) 65 K as y increases, as seen in the χm(T) and M(H) curves (Fig. 6). Taking into account
that perfectly stoichiometric LiNiO2 is considered to be a frustrated antiferromagnetic compound [18], this ferrimagnetic response would be indicative of the existence of Ni2+ ions occupying Li+ places [18, 19]. These interslab ions would lead to a ferromagnetic ordering of the Ni ions in two adjacent (Ni1−yCoyO2)n slabs and to the formation of small ferromagnetic islands in their surroundings with the concomitant apparent ferrimagnetic behavior.
In the samples with intermediate substitutions (0.2<y≤0.4), the magnetic features are different. Partial substitution of Ni3+ by Co3+ suppresses the ferrimagnetic response, reflecting that the addition of Co3+ inhibits the presence of the interlayer Ni2+ ions, and therefore favors a better lamellar structure. The positive Curie–Weiss constant calculated for 100<T<300 K (θp≈+30 K) shows that the Ni–O–Ni nearest neighbor interactions are still present at intermediate substitution levels. Apart from these general trends, magnetic measurements can also provide an approximation to the size of these magnetic islands. In this context, a blocking temperature, which decreases as
|
60 |
|
|
|
|
|
LiFePO4 |
|
|
1 (mol/emu) |
50 |
D801 |
|
|
|
|
|
||
|
T =52 K |
|
FC |
|
- |
|
|
|
|
χ |
40 |
|
|
ZFC |
|
|
|
||
|
|
|
|
H=1 Tesla |
|
30 |
|
|
|
|
0 |
100 |
200 |
300 |
Temperature (K)
Fig. 11 The temperature dependence of the reciprocal ZFC and FC magnetic susceptibility of LiFePO4 measured at H=1 T