

Intangible asset accounts receivable short-term liabilities bank debts
1) Our balance sheet is not as strong as last year since we’ve … some heavy … on investments.
2) Most of the company assets consist of ... … from very risky customers and until they’re paid, it’s hard to be sure of their actual value.
3) Consulting firms usually have few … …, and their main … … is the reputation they’ve established.
4) Our … … have grown very quickly this year, as we expanded into new territories.
5) This year’s balance sheet shows that the company’s … … have been fully repaid.
6) Companies that … … for several years may be forced to stop trading at the Stock Exchange.
7) We’ve always taken a loss on our equipment sales, but we make it up by … … through after-sales service.
8) Net income is informally called the … … bottom line because it is typically found on the last line of a company's income statement.
DISCOVERING LANGUAGE
Describing Trends
1. Study the words used to describe changes in economic indicators.
|
Verbs |
Nouns |
Verbs |
Nouns |
|
Up | |||
|
to go up to increase to rise to grow to improve |
an increase a rise a growth an improvement |
(a lot) to surge to take off to shoot up to soar to (sky)rocket to jump to leap |
a surge
a jump a leap |
|
Down | |||
|
to go down to decrease to fall (off) to drop to decline to slip to slide to get worse to worsen to deteriorate |
a decrease a fall a drop a decline
a worsening deterioration |
(a lot) to plummet to plunge to slump to crash to collapse to sink to tumble to (nose)dive |
a plunge a slump a crash
|
|
No Change |
Change of Direction | ||
|
to remain stable to stabilize to level off to stay at the same level to remain constant to stagnate |
stabilization
stagnation |
to reach a low point to hit a low to bottom out to recover to rebound to revive |
a low
a recovery a rebound a revival |
|
Degree of Change dramatic – dramatically considerable – considerably substantial – substantially significant –significantly moderate – moderately slight – slightly |
Speed of Change rapid – rapidly steady – steadily gradual – gradually slow – slowly |
to peak to reach a peak to top out |
|
|
to fluctuate to undulate |
| ||
|
Prepositions to stand at from … to … by … an increase of … |
Examples Sales stood at 3 million in January. Sales rose from 3 million to 7 million. Sales rose by 4 million (by 20%). There was an increase of 4 million over last year. There was a 20% increase in sales. Sales rose rapidly There was a rapid rise in sales. Sales rose dramatically. There was a dramatic rise in sales. | ||
2. Fill in the blanks using the correct word to complete the sentences.
decrease fluctuate improve rocket stable
1. A time over which there is no change is a time when sales are _____.
2. If sales drop, it means they _____ .
3. Sales that go up and down several times over a short period _____ .
4. Another way to say sales went up very fast is to say they _______ ,
5. When there is growth in the market, sales ________.
3. Label the following parts shown on the graph.
fall fluctuation peak recovery `rise
 4.
Rewrite the sentences according to the model; mind the tense forms.
4.
Rewrite the sentences according to the model; mind the tense forms.
There was an improvement in the figures for April. → The figures for April have improved.
Sales have declined since June. → There has been a decline in sales since June.
There was a dramatic increase in sales. → Sales increased dramatically.
1) There was a steady rise in sales.
2) Our export sales collapsed suddenly.
3) There was a slight recovery in sales.
4) Sales peaked in the third quarter.
5) Sales stabilized by the end of the period.
6) Profits will certainly rise significantly.
7) The market has expanded slightly.
5. Transitive vs Intransitive Verbs
|
Both transitive and intransitive |
Only Transitive |
Only Intransitive |
|
increase decrease drop |
rise fall go up / down remain constant / stable stay the same / at the same level |
reduce cut slash maintain / hold / keep (low / at the same level) |
Make the following sentences transitive.
1) Our salaries have remained constant for five years.
The company _________ salaries at the same level.
2) Interest rates have rise over the last two weeks.
Banks ________ their interest rates.
3) Production has stayed the same for some time.
The company _______ production at the same level.
4) The average age has decreased in the company.
Company’s recruiting policy ________ the average age.
5) The budget figures for the coming year decreased.
The Board of Directors ________ the budget figures for the coming year.
6) Prices are going to fall dramatically.
The company is planning to _______ the prices dramatically.
7) It is important that our costs should be low.
We need to _______ our costs down.
FOCUS ON FUNCTIONS

Presenting Information Using Charts and Graphs
The comment on the visual includes the following stages:
● Introducing the visual and its meaning
● Drawing attention to most important points
● Giving explanations.
1. Listen or / and read this description and find phrases performing these three functions.
|
TAN:
JOHN: TAN:
DENISE: TAN:
JOHN: TAN:
TAN: DENISE: |
Now, I'd like to refer to the first graph – as you can see this is a bar graph measuring net sales over the first ten months of the year. You'll notice that sales rose steadily in the first few months, then there was a marked increase in April. They peaked in May at around 3.2 million, and levelled off, then there was a dramatic drop in the following month, followed by a significant increase in August, and this trend has continued up until the present. What was the reason for the sudden drop in July? This was mainly due to a drop off in air conditioner sales – so it's a seasonal effect. Could it be a consequence of the negative effect of the interest rate rise? Possibly. Now, if I could draw your attention to this next diagram. This is a line graph of sales – the blue line represents air conditioner sales, the red line shows heaters. As you'll note, air conditioner sales dropped steadily from January to July, bottoming out then, while heater sales experienced a sharp increase from March to June, then dropped markedly from June to July, then declined through to September, with a pronounced drop in October. Does this explain the fluctuation in total sales? Largely – if we look at this pie diagram, you can see that air conditioners and heaters together represent more than half of our total sales - but they vary seasonally, while other appliances are fairly steady through the year. Well, we can't sell air conditioners when it's cold. What's the solution? Export to Europe and America! Easier said than done. |
2. Fill in the blanks with the words from the box. Listen and check.
slump deterioration recovered low point
Sam: The next slide we are going to look at shows the fluctuation of sales over the past two years.
Karen: Wow! Last quarter we hit quite a _____ !
Sam: Yes, we did. And we can see in this graph that sales started to gradually worsen in the last quarter of the last year. They _____ slightly in the first quarter, but then continued to fall until the present quarter.
Mike: Any idea what caused this _____ in sales?
Sam: One significant factor is the economy. We’ve not the only ones facing this problem. But the good news is that I think we’ve reached a _____ and things are going to improve in the next quarter.
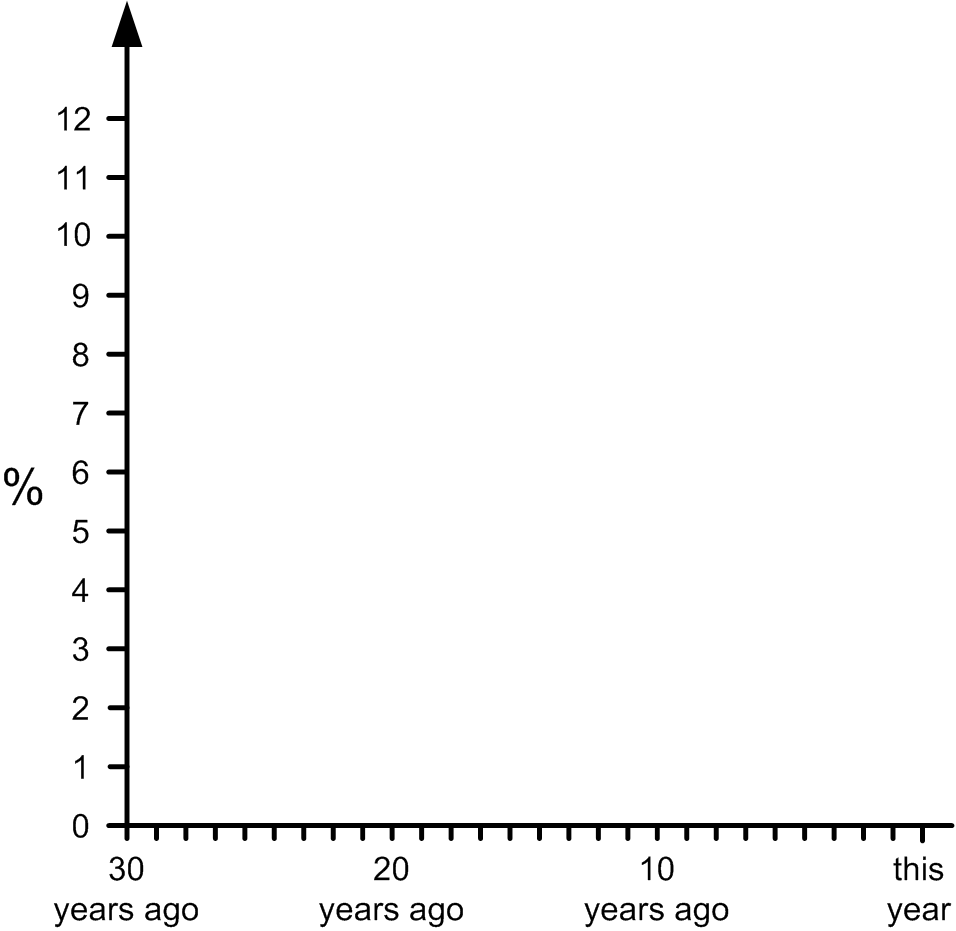
3. Complete the graph and the pie charts using the information below.
The growth rate in N… was around four per cent a year for ten years. A period of very fast growth followed, with the growth rate reaching 12 per cent ten years later. Growth was nine per cent in the following three years, but fell to two per cent in the year after that. It then increased steadily to reach five per cent two years ago, and has stayed at the same level.
30 years ago, GDP in N… came 70 per cent from agriculture, 20 per cent from industry and 10 per cent from services. At that time, GDP was US$10,000, coming 50 per cent from industry, 40 per cent from services and 10 per cent from agriculture.
Today, GDP per person is US$10,000m, coming 50 per cent from industry, 40 per cent from services and 10 per cent from agriculture.
|
|
|
|


N… GDP 30 years ago N… GDP this year
LISTENING
1. Listen to the excerpt of the lecture and take notes, focus on the definitions given by the lecturer.
2. Using your notes complete the following statements.
1) The subject of the lecture is
a. income statement
b. balance sheet
c. cash flow
2) Assets are
a. what a company owns
b. what a company owes
c. what a company earns
3) Net worth is
a. what a company owns
b. an excess of company’s assets over its liabilities
c. all company’s assets
4) Goodwill is
a. company’s reputation,
b. company’s debts
c. company’s good prospects for future growth
5) A take-over bid is
a. an offer to buy a company
b. an offer to sell a company
c. an offer to insure a company
3. Listen to the lecture again, look at the figure below; complete your notes.