

3D Grid
The Petrel Geology course presents two workflows for volumetric calculation; a map-based and 3D model workflow. The 3D model based workflow focuses on the construction of a 3D grid, populating the grid with properties to be used to determine a more accurate volume calculation. There are 3 methods to build a 3D grid in Petrel: Make simple grid, Corner point gridding, Structural framework.
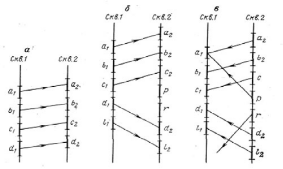
Well correlation
Корреляция разрез скважины один из наиболее важных и ответственных этапов работы. При сопоставление разрезов в них прежде всего выделяют опорные или маркирующие пласты (горизонты) такие пласты которые среди горных пород выделяются литологическими особенностями. (By Sakabekov) В результате корреляции в разрезах скважин определяют глубины залегания пластов, слагающих изучаемую толщу.
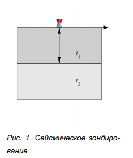
1D Seismic Survey, 35. 2d Seismic survey, 36. 3d Seismic survey
По размерности сейсморазведка различается на 1D, 2D и 3D варианты. Регистрация сейсмических волн от одного источника колебаний, расположенного в пункте взрыва (ПВ), производится, как правило, несколькими приёмниками (или группами приёмников), находящимися на различном расстоянии от ПВ. Расстановкой ПП называется совокупность ПП, регистрирующих колебания от одного ПВ. Способ изучения недр, при котором ПВ и ПП совмещены на поверхности, называется сейсмическим зондированием. В этом случае наблюдения характеризуются только одной размерностью исследований – глубиной z, - поэтому они получили название 1D-сейсморазведки. (1D упругая волна возбуждается и регистрируется вдоль одного единственного вертикального луча – в стволе скважины.)
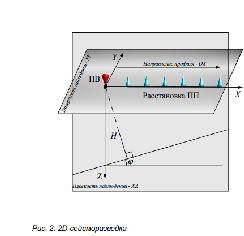
При расположении ПВ и ПП линейного профиля, имеем уже два параметра – глубину z и удаление от начала профиля x, т.е. 2D-сейсморазведку. При профильных наблюдениях изучаются свойства среды в направлении сейсмического профиля. . При профильных наблюдениях изучаются свойства среды в направлении сейсмического профиля. Если совместить профиль с осью абсцисс OX некоторой декартовой системы координат, отождествив начало координат O (0; 0; 0) с положением ПВ, то плоскостью наблюдений будет являться плоскость OXZ (рис. 2).
При площадном расположении ПВ и ПП получаем систему трёх параметров – (z, x, y), такие системы называются системами наблюдений 3D-сейсморазведки
Выше 2D Seismic Survey
Выше 3D Seismic Survey
Vertical Seismic Profile(vsp)
Vertical Seismic Profile (VSP) - a technique of seismic measurements used for correlation with surface seismic data. The defining characteristic of a VSP is that either the energy source, or the detectors are in a borehole. In the most common type of VSP, Hydrophones, or more often geophones or accelerometers, in the borehole record reflected seismic energy originating from a seismic source at the surface.
Check Shot
Check Shot - a type of borehole seismic data designed to measure the seismic traveltime from the surface to a known depth. P-wave velocity of the formations encountered in a wellbore can be measured directly by lowering a geophone to each formation of interest, sending out a source of energy from the surface of the Earth, and recording the resultant signal.
Geostatistics
Geostatistics – is a discipline, using which, we can measure heterogeneity and lay its geological model.
Main Problem of Geostatistics
. Main Problem of Geostatistics – is the spatial evaluation of input data and search for possible relation.
Mean
Mean - ?(s) is the mean structure; called large-scale non-spatial trend; mean at location s, expected value of random variable Z(s); trend component model in the decomposition Z(s) = m(s) + R(s), where R(s) represents the residual component model.
Variance - the average of the squared differences from the Mean.
Standart Deviation-
is a measure of how spread out numbers are.
Its symbol is σ (the greek letter sigma)
Histogram - is a graphical display of data using bars of different heights.
Normal Distribution - in probability theory, the normal (or Gaussian) distribution is a very commonly occurring continuous probability distribution—a function that tells the probability that any real observation will fall between any two real limits or real numbers, as the curve approaches zero on either side.
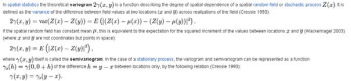
Spatial Autocorrelation - a measure of the degree to which a set of spatial features and their associated data values tend to be clustered together in space (positive spatial autocorrelation) or dispersed (negative spatial autocorrelation).
Covariance - provides a measure of the strength of the correlation between two or more sets of random variates.
Conseptual Model - a conceptual model is a model made of the composition of concepts, which are used to help people know, understand, or simulate a subject the model represents
Trend If the empirical semivariogram continues climbing steadily beyond the global variance value, this is often indicative of a significant spatial trend in the variable, resulting in a negative correlation between variable values separated by large lags. Three options for dealing with lag include: 1) Fit a trend surface and work with residuals from the trend 2) Try to find a “trend-free” direction and use the variogram in that direction as the variogram for the “random” component of the variable (see the section on anisotropy, below) 3) Ignore the problem and use a linear or power variogram The semivariogram for the porosity data does not seem to indicate a significant trend. Virtually all geological processes impart a trend in the petrophysical property distribution—for example, fining or coarsening upward vertical trends or the systematic decrease in reservoir quality from proximal to distal portions of the depositional system. Such trends cause the variogram to show a negative correlation at large distances. In a fining upward sedimentary package, the high porosity at the base of the unit is negatively correlated with low porosity at the top. The large-scale negative correlation indicative of a geologic trend shows up as a variogram that increases beyond the sill variance C(0) = σ2. As we will see later, it may be appropriate to remove systematic trends prior to geostatistical modeling. The trend is of no consequence if at scales smaller than the modeling cells or if there are many data. The trend would be reproduced in the final models by the conditioning data. Most practical reservoir modeling is done in the presence of sparse well data; therefore, trend modeling is important. Then, we must infer the residual variogram which will typically show less structure than the variable with a trend. Areal (horizontal) trends have an influence on the ertical semivariogram, in that the vertical semivariogram will not encounter the full variability of the petrophysical property. There will be positive correlation (semivariogram γ (h) below the sill variance C(0) = σ2) for large distances in the vertical direction. Тренд (произносится «трэнд», от англ. trend — тенденция) — основная тенденция изменения временного ряда. Тренды могут быть описаны различными уравнениями — линейными, логарифмическими, степенными и т. д. Фактический тип тренда устанавливают на основе подбора его функциональной модели статистическими методами либо сглаживанием исходного временного ряда
.Semivariogram
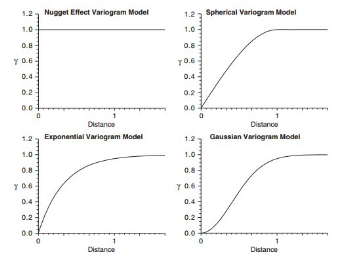
Variogram Model The nugget effect, spherical, exponential, and Gaussian models have a distinct plateau or sill.Each variogram model has the distance h as a parameter. This scalar distance is calculated by decomposing the distance vector h into its three principal components, hvert, h–major, and h–minor.
Empirical Variogram
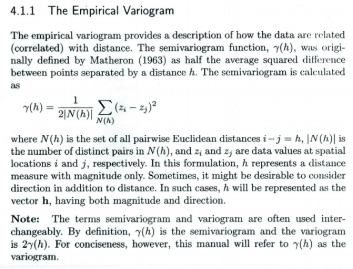
Lag We use h to represent the lag distance. The separation distance is usually referred to as “lag”. Сдвиг фаз — разность между начальными фазами двух переменных величин, изменяющихся во времени периодически с одинаковой частотой.
Lag Increment
55. Lag Tolerance Lag Tolerance: Distance from the lag at which data will be considered as belonging to that lag. This is quoted as a percentage of the lag distance. For example, 50% means that all points will belong to one lag, greater than 50% means that some same data may be considered in two lags, less than 50% means that some data may not be considered.Search Distance
56. Search Distance Search distance: The maximum separation distance used in the search for sample pairs. The search distance and the lag division are defined in the same way as the horizontal sample variogram. The program searches for sample pairs vertically using the vertical search distance. The horizontal search distance is now used to describe the lateral tolerance. Orientation is not used when calculating vertical sample variogram.
Direction Angle The major direction defines the direction where the sample points have the strongest correlation. The angle of this major direction can be changed interactively by editing the direction in the search cone. The angle is specified as the clockwise angle from the north (in degrees) for the main search direction.
Tolerance Angle The tolerance in degrees from the orientation for the search of sample pairs.Isotropy
Stationarity Stationary process (or strict(ly) stationary process or strong(ly) stationary process) is a stochastic process whose joint probability distribution does not change when shifted in time. Consequently, parameters such as the mean and variance, if they are present, also do not change over time and do not follow any trends.
Isotropy Isotropy is uniformity in all orientations; Precise definitions depend on the subject area. Exceptions, or inequalities, are frequently indicated by the prefix an, hence anisotropy. Anisotropy is also used to describe situations where properties vary systematically, dependent on direction. Isotropic radiation has the same intensity regardless of the direction of measurement, and an isotropic field exerts the same action regardless of how the test particle is oriented.
Nugget of Variogram (самородок)
Parameter
used to describe variograms. nugget  :
The height of the jump of the semivariogram at the discontinuity at
the origin (y-intercept of the variogram). In practical terms, the
nugget represents the small-scale variability of the data.
:
The height of the jump of the semivariogram at the discontinuity at
the origin (y-intercept of the variogram). In practical terms, the
nugget represents the small-scale variability of the data.
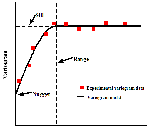
Самородок вариограммы
Теоретически, при нулевом расстоянии между точками (лаг=0) значение вариограммы равно 0. Однако при бесконечно маленьком расстоянии разделения, вариограмма часто демонстрирует эффект самородка, что является значением больше 0. Если модель вариограммы пересекает ось в значении 2, то самородок будет равек 2. То есть самородок – это точка пересечения вариограммы с осью ординат (у).