

economics_of_money_banking__financial_markets
.pdfC h a p t e r
1 Why Study Money, Banking, and Financial Markets?
PREVIEW
On the evening news you have just heard that the Federal Reserve is raising the federal funds rate by 12 of a percentage point. What effect might this have on the interest rate of an automobile loan when you finance your purchase of a sleek new sports car? Does it mean that a house will be more or less affordable in the future? Will it make it easier or harder for you to get a job next year?
This book provides answers to these and other questions by examining how financial markets (such as those for bonds, stocks, and foreign exchange) and financial institutions (banks, insurance companies, mutual funds, and other institutions) work and by exploring the role of money in the economy. Financial markets and institutions not only affect your everyday life but also involve huge flows of funds (trillions of dollars) throughout our economy, which in turn affect business profits, the production of goods and services, and even the economic well-being of countries other than the United States. What happens to financial markets, financial institutions, and money is of great concern to our politicians and can even have a major impact on our elections. The study of money, banking, and financial markets will reward you with an understanding of many exciting issues. In this chapter we provide a road map of the book by outlining these issues and exploring why they are worth studying.
Why Study Financial Markets?
The Bond Market
and Interest
Rates
Part II of this book focuses on financial markets, markets in which funds are transferred from people who have an excess of available funds to people who have a shortage. Financial markets such as bond and stock markets are crucial to promoting greater economic efficiency by channeling funds from people who do not have a productive use for them to those who do. Indeed, well-functioning financial markets are a key factor in producing high economic growth, and poorly performing financial markets are one reason that many countries in the world remain desperately poor. Activities in financial markets also have direct effects on personal wealth, the behavior of businesses and consumers, and the cyclical performance of the economy.
A security (also called a financial instrument) is a claim on the issuerÕs future income or assets (any financial claim or piece of property that is subject to ownership). A bond is a debt security that promises to make payments periodically for a specified
3

4 P A R T I Introduction
www.federalreserve
.gov/releases/
Daily, weekly, monthly, quarterly, and annual releases and historical data for selected interest rates, foreign exchange rates, and so on.
period of time.1 The bond market is especially important to economic activity because it enables corporations or governments to borrow to finance their activities and because it is where interest rates are determined. An interest rate is the cost of borrowing or the price paid for the rental of funds (usually expressed as a percentage of the rental of $100 per year). There are many interest rates in the economyÑmortgage interest rates, car loan rates, and interest rates on many different types of bonds.
Interest rates are important on a number of levels. On a personal level, high interest rates could deter you from buying a house or a car because the cost of financing it would be high. Conversely, high interest rates could encourage you to save because you can earn more interest income by putting aside some of your earnings as savings. On a more general level, interest rates have an impact on the overall health of the economy because they affect not only consumersÕ willingness to spend or save but also businessesÕ investment decisions. High interest rates, for example, might cause a corporation to postpone building a new plant that would ensure more jobs.
Because changes in interest rates have important effects on individuals, financial institutions, businesses, and the overall economy, it is important to explain fluctuations in interest rates that have been substantial over the past twenty years. For example, the interest rate on three-month Treasury bills peaked at over 16% in 1981. This interest rate then fell to 3% in late 1992 and 1993, rose to above 5% in the mid to late 1990s, and then fell to a low of below 2% in the early 2000s.
Because different interest rates have a tendency to move in unison, economists frequently lump interest rates together and refer to ÒtheÓ interest rate. As Figure 1
Interest Rate (%)
20 |
|
|
|
|
|
|
|
|
|
|
|
15 |
|
|
Corporate Baa Bonds |
|
|
|
|
|
|
||
|
|
|
|
|
|
|
|
|
|||
10 |
U.S. Government |
|
|
|
|
|
|
|
|
||
|
|
|
|
|
|
|
|
|
|||
|
Long-Term Bonds |
|
|
|
|
|
|
|
|
||
5 |
|
|
|
|
|
|
|
|
|
|
|
|
|
|
|
|
|
Three-Month |
|
|
|
|
|
|
|
|
|
|
|
Treasury Bills |
|
|
|
|
|
0 |
|
|
|
|
|
|
|
|
|
|
|
1950 |
1955 |
1960 |
1965 |
1970 |
1975 |
1980 |
1985 |
1990 |
1995 |
2000 |
2005 |
F I G U R E 1 Interest Rates on Selected Bonds, 1950–2002
Sources: Federal Reserve Bulletin; www.federalreserve.gov/releases/H15/data.htm.
1The definition of bond used throughout this book is the broad one in common use by academics, which covers shortas well as long-term debt instruments. However, some practitioners in financial markets use the word bond to describe only specific long-term debt instruments such as corporate bonds or U.S. Treasury bonds.
The Stock Market
http://stockcharts.com/charts /historical/
Historical charts of various stock indexes over differing time periods.
C H A P T E R 1 Why Study Money, Banking, and Financial Markets? |
5 |
shows, however, interest rates on several types of bonds can differ substantially. The interest rate on three-month Treasury bills, for example, fluctuates more than the other interest rates and is lower, on average. The interest rate on Baa (medium-quality) corporate bonds is higher, on average, than the other interest rates, and the spread between it and the other rates became larger in the 1970s.
In Chapter 2 we study the role of bond markets in the economy, and in Chapters 4 through 6 we examine what an interest rate is, how the common movements in interest rates come about, and why the interest rates on different bonds vary.
A common stock (typically just called a stock) represents a share of ownership in a corporation. It is a security that is a claim on the earnings and assets of the corporation. Issuing stock and selling it to the public is a way for corporations to raise funds to finance their activities. The stock market, in which claims on the earnings of corporations (shares of stock) are traded, is the most widely followed financial market in America (thatÕs why it is often called simply Òthe marketÓ). A big swing in the prices of shares in the stock market is always a big story on the evening news. People often speculate on where the market is heading and get very excited when they can brag about their latest Òbig killing,Ó but they become depressed when they suffer a big loss. The attention the market receives can probably be best explained by one simple fact: It is a place where people can get richÑor poorÑquickly.
As Figure 2 indicates, stock prices have been extremely volatile. After the market rose in the 1980s, on ÒBlack Monday,Ó October 19, 1987, it experienced the worst one-day drop in its entire history, with the Dow Jones Industrial Average (DJIA) falling by 22%. From then until 2000, the stock market experienced one of the great bull markets in its history, with the Dow climbing to a peak of over 11,000. With the collapse of the high-tech bubble in 2000, the stock market fell sharply, dropping by over 30% by 2002. These considerable fluctuations in stock prices affect the size of peopleÕs wealth and as a result may affect their willingness to spend.
The stock market is also an important factor in business investment decisions, because the price of shares affects the amount of funds that can be raised by selling newly issued stock to finance investment spending. A higher price for a firmÕs shares means that it can raise a larger amount of funds, which can be used to buy production facilities and equipment.
In Chapter 2 we examine the role that the stock market plays in the financial system, and we return to the issue of how stock prices behave and respond to information in the marketplace in Chapter 7.
The Foreign
Exchange Market
For funds to be transferred from one country to another, they have to be converted from the currency in the country of origin (say, dollars) into the currency of the country they are going to (say, euros). The foreign exchange market is where this conversion takes place, and so it is instrumental in moving funds between countries. It is also important because it is where the foreign exchange rate, the price of one countryÕs currency in terms of anotherÕs, is determined.
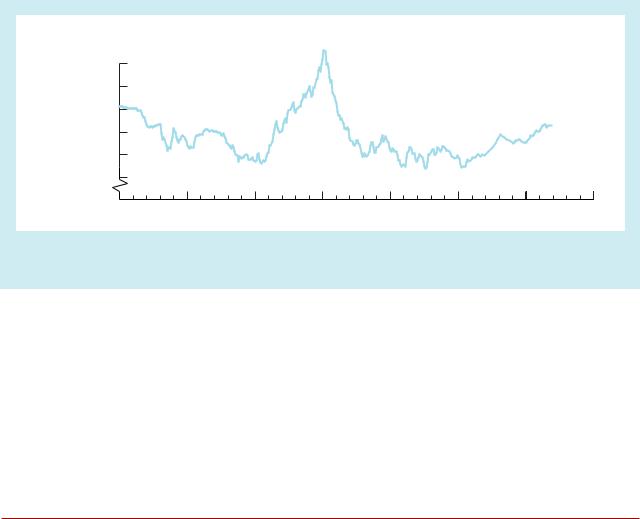
Figure 3 shows the exchange rate for the U.S. dollar from 1970 to 2002 (measured as the value of the American dollar in terms of a basket of major foreign currencies). The fluctuations in prices in this market have also been substantial: The dollar weakened considerably from 1971 to 1973, rose slightly in value until 1976, and then reached a low point in the 1978Ð1980 period. From 1980 to early 1985, the dollar appreciated dramatically in value, but since then it has fallen substantially.

6 P A R T I Introduction
Dow Jones
Industrial Average
12,000 |
|
|
|
|
|
|
|
|
|
|
|
10,000 |
|
|
|
|
|
|
|
|
|
|
|
8,000 |
|
|
|
|
|
|
|
|
|
|
|
6,000 |
|
|
|
|
|
|
|
|
|
|
|
4,000 |
|
|
|
|
|
|
|
|
|
|
|
2,000 |
|
|
|
|
|
|
|
|
|
|
|
0 |
|
|
|
|
|
|
|
|
|
|
|
1950 |
1955 |
1960 |
1965 |
1970 |
1975 |
1980 |
1985 |
1990 |
1995 |
2000 |
2005 |
F I G U R E 2 Stock Prices as Measured by the Dow Jones Industrial Average, 1950–2002
Source: Dow Jones Indexes: http://finance.yahoo.com/?u.
What have these fluctuations in the exchange rate meant to the American public and businesses? A change in the exchange rate has a direct effect on American consumers because it affects the cost of imports. In 2001 when the euro was worth around 85 cents, 100 euros of European goods (say, French wine) cost $85. When the dollar subsequently weakened, raising the cost of a euro near $1, the same 100 euros of wine now cost $100. Thus a weaker dollar leads to more expensive foreign goods, makes vacationing abroad more expensive, and raises the cost of indulging your desire for imported delicacies. When the value of the dollar drops, Americans will decrease their purchases of foreign goods and increase their consumption of domestic goods (such as travel in the United States or American-made wine).
Conversely, a strong dollar means that U.S. goods exported abroad will cost more in foreign countries, and hence foreigners will buy fewer of them. Exports of steel, for example, declined sharply when the dollar strengthened in the 1980Ð1985 and
C H A P T E R 1 Why Study Money, Banking, and Financial Markets? |
7 |
Index |
|
|
|
|
|
|
|
(March 1973 = 100) |
|
|
|
|
|
|
|
150 |
|
|
|
|
|
|
|
135 |
|
|
|
|
|
|
|
120 |
|
|
|
|
|
|
|
105 |
|
|
|
|
|
|
|
90 |
|
|
|
|
|
|
|
75 |
|
|
|
|
|
|
|
1970 |
1975 |
1980 |
1985 |
1990 |
1995 |
2000 |
2005 |
F I G U R E 3 Exchange Rate of the U.S. Dollar, 1970–2002
Source: Federal Reserve: www.federalreserve.gov/releases/H10/summary.
1995Ð2001 periods. A strong dollar benefited American consumers by making foreign goods cheaper but hurt American businesses and eliminated some jobs by cutting both domestic and foreign sales of their products. The decline in the value of the dollar from 1985 to 1995 and 2001 to 2002 had the opposite effect: It made foreign goods more expensive, but made American businesses more competitive. Fluctuations in the foreign exchange markets have major consequences for the American economy.
In Chapter 19 we study how exchange rates are determined in the foreign exchange market in which dollars are bought and sold for foreign currencies.
Why Study Banking and Financial Institutions?
Structure of
the Financial
System
Part III of this book focuses on financial institutions and the business of banking. Banks and other financial institutions are what make financial markets work. Without them, financial markets would not be able to move funds from people who save to people who have productive investment opportunities. They thus also have important effects on the performance of the economy as a whole.
The financial system is complex, comprising many different types of private sector financial institutions, including banks, insurance companies, mutual funds, finance companies, and investment banks, all of which are heavily regulated by the government. If an individual wanted to make a loan to IBM or General Motors, for example, he or she would not go directly to the president of the company and offer a loan. Instead, he or she would lend to such companies indirectly through financial intermediaries, institutions that borrow funds from people who have saved and in turn make loans to others.
Why are financial intermediaries so crucial to well-functioning financial markets? Why do they extend credit to one party but not to another? Why do they usually write

8 P A R T I Introduction
Banks and Other
Financial
Institutions
Financial
Innovation
complicated legal documents when they extend loans? Why are they the most heavily regulated businesses in the economy?
We answer these questions in Chapter 8 by developing a coherent framework for analyzing financial structure in the United States and in the rest of the world.
Banks are financial institutions that accept deposits and make loans. Included under the term banks are firms such as commercial banks, savings and loan associations, mutual savings banks, and credit unions. Banks are the financial intermediaries that the average person interacts with most frequently. A person who needs a loan to buy a house or a car usually obtains it from a local bank. Most Americans keep a large proportion of their financial wealth in banks in the form of checking accounts, savings accounts, or other types of bank deposits. Because banks are the largest financial intermediaries in our economy, they deserve the most careful study. However, banks are not the only important financial institutions. Indeed, in recent years, other financial institutions such as insurance companies, finance companies, pension funds, mutual funds, and investment banks have been growing at the expense of banks, and so we need to study them as well.
In Chapter 9, we examine how banks and other financial institutions manage their assets and liabilities to make profits. In Chapter 10, we extend the economic analysis in Chapter 8 to understand why bank regulation takes the form it does and what can go wrong in the regulatory process. In Chapters 11 and 12, we look at the banking industry and at nonbank financial institutions; we examine how the competitive environment has changed in these industries and learn why some financial institutions have been growing at the expense of others. Because the economic environment for banks and other financial institutions has become increasingly risky, these institutions must find ways to manage risk. How they manage risk with financial derivatives is the topic of Chapter 13.
In the good old days, when you took cash out of the bank or wanted to check your account balance, you got to say hello to the friendly human teller. Nowadays you are more likely to interact with an automatic teller machine when withdrawing cash, and you can get your account balance from your home computer. To see why these options have been developed, in Chapter 10 we study why and how financial innovation takes place, with particular emphasis on how the dramatic improvements in information technology have led to new means of delivering financial services electronically, in what has become known as e-finance. We also study financial innovation, because it shows us how creative thinking on the part of financial institutions can lead to higher profits. By seeing how and why financial institutions have been creative in the past, we obtain a better grasp of how they may be creative in the future. This knowledge provides us with useful clues about how the financial system may change over time and will help keep our knowledge about banks and other financial institutions from becoming obsolete.
Why Study Money and Monetary Policy?
Money, also referred to as the money supply, is defined as anything that is generally accepted in payment for goods or services or in the repayment of debts. Money is linked

C H A P T E R 1 Why Study Money, Banking, and Financial Markets? |
9 |
Money and
Business Cycles
www.federalreserve.gov
General information, monetary policy, banking system, research, and economic data of the Federal Reserve.
to changes in economic variables that affect all of us and are important to the health of the economy. The final two parts of the book examine the role of money in the economy.
In 1981Ð1982, total production of goods and services (called aggregate output) in the U.S. economy fell and the unemployment rate (the percentage of the available labor force unemployed) rose to over 10%. After 1982, the economy began to expand rapidly, and by 1989 the unemployment rate had declined to 5%. In 1990, the eightyear expansion came to an end, with the unemployment rate rising above 7%. The economy bottomed out in 1991, and the subsequent recovery was the longest in U.S. history, with the unemployment rate falling to around 4%. A mild economic downturn then began in March 2001, with unemployment rising to 6%.
Why did the economy expand from 1982 to 1990, contract in 1990 to 1991, boom again from 1991 to 2001, and then contract again in 2001? Evidence suggests that money plays an important role in generating business cycles, the upward and downward movement of aggregate output produced in the economy. Business cycles affect all of us in immediate and important ways. When output is rising, for example, it is easier to find a good job; when output is falling, finding a good job might be difficult. Figure 4 shows the movements of the rate of money growth over the 1950Ð2002 period, with the shaded areas representing recessions, periods of declining aggregate output. What we see is that the rate of money growth has declined before every recession. Indeed, every recession since the beginning of the twentieth century has been preceded by a decline in the rate of money growth, indicating that
Money |
|
|
|
|
|
|
|
|
|
|
|
Growth Rate |
|
|
|
|
|
|
|
|
|
|
|
(%) |
|
|
|
|
|
|
|
|
|
|
|
15 |
|
|
|
|
|
|
|
|
|
|
|
|
|
|
Money Growth |
|
|
|
|
|
|
|
|
|
|
|
Rate (M2) |
|
|
|
|
|
|
|
|
10 |
|
|
|
|
|
|
|
|
|
|
|
5 |
|
|
|
|
|
|
|
|
|
|
|
0 |
|
|
|
|
|
|
|
|
|
|
|
1950 |
1955 |
1960 |
1965 |
1970 |
1975 |
1980 |
1985 |
1990 |
1995 |
2000 |
2005 |
F I G U R E 4 Money Growth (M2 Annual Rate) and the Business Cycle in the United States, 1950–2002
Note: Shaded areas represent recessions.
Source: Federal Reserve Bulletin, p. A4, Table 1.10; www.federalreserve.gov/releases/h6/hist/h6hist1.txt.

10 P A R T I Introduction
Money and
Inflation
www.newsengin.com /neFreeTools.nsf/CPIcalc ?OpenView
Calculator lets you compute how buying power has changed since 1913.
changes in money might also be a driving force behind business cycle fluctuations. However, not every decline in the rate of money growth is followed by a recession.
We explore how money might affect aggregate output in Chapters 22 through 28, where we study monetary theory, the theory that relates changes in the quantity of money to changes in aggregate economic activity and the price level.
Thirty years ago, the movie you might have paid $9 to see last week would have set you back only a dollar or two. In fact, for $9 you could probably have had dinner, seen the movie, and bought yourself a big bucket of hot buttered popcorn. As shown in Figure 5, which illustrates the movement of average prices in the U.S. economy from 1950 to 2002, the prices of most items are quite a bit higher now than they were then. The average price of goods and services in an economy is called the aggregate price level, or, more simply, the price level (a more precise definition is found in the appendix to this chapter). From 1950 to 2002, the price level has increased more than sixfold. Inflation, a continual increase in the price level, affects individuals, businesses, and the government. Inflation is generally regarded as an important problem to be solved and has often been a primary concern of politicians and policymakers. To solve the inflation problem, we need to know something about its causes.
Index (1987= 100) |
|
|
|
|
|
|
|
|
|
|
|
|
225 |
|
|
|
|
|
|
|
|
|
|
|
200 |
|
|
|
|
|
|
|
|
|
|
|
175 |
|
|
|
|
|
|
|
|
|
|
|
150 |
|
|
|
|
|
|
|
|
|
|
|
125 |
|
|
|
|
|
|
|
|
|
|
|
100 |
|
|
|
|
|
|
|
|
|
|
|
75 |
|
|
|
|
|
|
|
|
|
|
|
50 |
Aggregate Price Level |
|
|
|
|
|
|
|||
|
|
(GDP Deflator) |
|
|
|
|
|
|
|
||
|
|
|
|
|
|
|
|
|
|
||
|
25 |
|
|
|
|
Money Supply |
|
|
|
||
|
|
|
|
|
|
|
|
|
|||
|
|
|
|
|
|
|
(M2) |
|
|
|
|
|
0 |
|
|
|
|
|
|
|
|
|
|
|
1950 |
1955 |
1960 |
1965 |
1970 |
1975 |
1980 |
1985 |
1990 |
1995 |
2000 |
F I G U R E 5 |
Aggregate Price Level and the Money Supply in the United States, 1950–2002 |
|
|
|
|||||||
Sources: www.stls.frb.org/fred/data/gdp/gdpdef; www.federalreserve.gov/releases/h6/hist/h6hist10.txt. |
|
|
|
||||||||

C H A P T E R 1 Why Study Money, Banking, and Financial Markets? |
11 |
What explains inflation? One clue to answering this question is found in Figure 5, which plots the money supply and the price level. As we can see, the price level and the money supply generally move closely together. These data seem to indicate that a continuing increase in the money supply might be an important factor in causing the continuing increase in the price level that we call inflation.
Further evidence that inflation may be tied to continuing increases in the money supply is found in Figure 6. For a number of countries, it plots the average inflation rate (the rate of change of the price level, usually measured as a percentage change per year) over the ten-year period 1992Ð2002 against the average rate of money growth over the same period. As you can see, there is a positive association between inflation and the growth rate of the money supply: The countries with the highest inflation rates are also the ones with the highest money growth rates. Belarus, Brazil, Romania, and Russia, for example, experienced very high inflation during this period, and their rates of money growth were high. By contrast, the United Kingdom and the United States had very low inflation rates over the same period, and their rates of money growth have been low. Such evidence led Milton Friedman, a Nobel laureate in economics, to make the famous statement, ÒInflation is always and everywhere a monetary phenomenon.Ó2 We look at moneyÕs role in creating inflation by studying in detail the relationship between changes in the quantity of money and changes in the price level in Chapter 27.
Average |
|
|
|
|
|
|
|
|
|
|
|
|
|
|
|
|
|
|
|
|
|
|
|
Inflation Rate (%) |
|
|
|
|
|
|
|
|
|
|
|
|
|
|
|
|
|
|
|
|
|
|
|
220 |
|
|
|
|
|
|
|
|
|
|
|
|
|
|
|
|
|
|
|
|
|
|
|
|
|
|
|
|
|
|
|
|
|
|
|
|
|
|
|
|
|
|
|
|
|
|
|
200 |
|
|
|
|
|
|
|
|
|
|
|
|
|
|
|
|
|
|
|
|
Brazil |
||
|
|
|
|
|
|
|
|
|
|
|
|
|
|
|
|
|
|
|
|
||||
180 |
|
|
|
|
|
|
|
|
|
|
|
|
|
|
|
|
|
|
|
|
|
|
|
|
|
|
|
|
|
|
|
|
|
|
|
|
|
|
|
|
|
|
|
|
|
|
|
160 |
|
|
|
|
|
|
|
|
|
|
|
|
|
Belarus |
|
|
|
|
|
|
|
|
|
|
|
|
|
|
|
|
|
|
|
|
|
|
|
|
|
|
|
|
|
|
|||
140 |
|
|
|
|
|
|
|
|
|
|
|
|
|
|
|
|
|
|
|
|
|
||
|
|
|
|
|
|
|
|
|
|
|
|
|
|
|
|
|
|
|
|
|
|
|
|
120 |
|
United States |
|
Russia |
|
|
|
|
|
|
|
|
|
|
|
|
|
|
|||||
|
|
|
|
|
|
|
|
|
|
|
|
|
|
|
|
||||||||
|
|
|
|
|
|
|
|
|
|
|
|
|
|
|
|
|
|||||||
100 |
|
|
|
Romania |
|
|
|
|
|
|
|
|
|
|
|
|
|||||||
|
United Kingdom |
|
|
|
|
|
|
|
|
|
|
|
|
|
|
|
|
||||||
|
|
|
|
|
|
|
|
|
|
|
|
|
|
|
|
|
|
||||||
80 |
|
|
Ecuador |
|
|
|
|
|
|
|
|
|
|
|
|
|
|
|
|
|
|
||
|
|
|
|
|
|
|
|
|
|
|
|
|
|
|
|
|
|
|
|
||||
60 |
|
|
|
Colombia |
|
|
|
|
|
|
|
|
|
|
|
|
|
|
|
|
|
|
|
|
|
|
Argentina |
|
|
|
|
|
|
|
|
|
|
|
|
|
|
|
|
||||
|
|
|
|
|
|
|
|
|
|
|
|
|
|
|
|
|
|
|
|||||
40 |
|
|
|
|
Venezuela |
|
|
|
|
|
|
|
|
|
|
|
|
|
|
|
|
||
|
|
|
|
Peru |
|
|
|
|
|
|
|
|
|
|
|
|
|
|
|
|
|
|
|
|
|
|
|
|
|
|
|
|
|
|
|
|
|
|
|
|
|
|
|
|
|
||
20 |
|
|
|
Uruguay |
|
|
|
|
|
|
|
|
|
|
|
|
|
|
|
|
|
|
|
|
|
|
Mexico |
|
|
|
|
|
|
|
|
|
|
|
|
|
|
|
|
|
|
||
|
|
|
|
|
|
|
|
|
|
|
|
|
|
|
|
|
|
|
|
|
|||
|
|
|
Chile |
|
|
|
|
|
|
|
|
|
|
|
|
|
|
|
|
|
|
||
|
|
|
|
|
|
|
|
|
|
|
|
|
|
|
|
|
|
|
|
|
|
|
|
0 |
20 |
40 |
60 |
80 |
100 |
120 |
140 |
160 |
180 |
200 |
220 |
||||||||||||
|
|
|
|
|
|
|
|
|
|
|
|
|
|
Average Money Growth Rate (%) |
|||||||||
|
|
|
|
|
|
|
|
|
|
|
|
|
|
|
|
|
|
|
|
|
|
|
|
F I G U R E 6 Average Inflation Rate Versus Average Rate of Money Growth for Selected Countries, 1992–2002
Source: International Financial Statistics.
2Milton Friedman, Dollars and Deficits (Upper Saddle River, N.J.: Prentice Hall, 1968), p. 39.

12 P A R T I |
Introduction |
Money and |
In addition to other factors, money plays an important role in interest-rate fluctua- |
Interest Rates |
tions, which are of great concern to businesses and consumers. Figure 7 shows the |
|
changes in the interest rate on long-term Treasury bonds and the rate of money |
|
growth. As the money growth rate rose in the 1960s and 1970s, the long-term bond |
|
rate rose with it. However, the relationship between money growth and interest rates |
|
has been less clear-cut since 1980. We analyze the relationship between money and |
|
interest rates when we examine the behavior of interest rates in Chapter 5. |
Conduct of
Monetary Policy
Fiscal Policy and
Monetary Policy
Because money can affect many economic variables that are important to the wellbeing of our economy, politicians and policymakers throughout the world care about the conduct of monetary policy, the management of money and interest rates. The organization responsible for the conduct of a nationÕs monetary policy is the central bank. The United StatesÕ central bank is the Federal Reserve System (also called simply the Fed). In Chapters 14Ð18 and 21, we study how central banks like the Federal Reserve System can affect the quantity of money in the economy and then look at how monetary policy is actually conducted in the United States and elsewhere.
Fiscal policy involves decisions about government spending and taxation. A budget deficit is the excess of government expenditures over tax revenues for a particular time period, typically a year, while a budget surplus arises when tax revenues exceed government expenditures. The government must finance any deficit by borrowing, while a budget surplus leads to a lower government debt burden. As Figure 8 shows, the budget deficit, relative to the size of our economy, peaked in 1983 at 6% of national output (as calculated by the gross domestic product, or GDP, a measure of
Interest |
|
|
|
|
|
|
|
|
|
|
Money |
|
|
|
|
|
|
|
|
|
|
Growth Rate |
|
Rate (%) |
|
|
|
|
|
|
|
|
|
|
(% annual rate) |
16 |
|
|
|
|
|
|
|
|
|
|
16 |
14 |
|
|
|
|
|
|
|
|
|
|
14 |
12 |
Money Growth Rate (M2) |
|
|
|
|
|
|
12 |
|||
|
|
|
|
|
|
|
|
|
|
||
10 |
|
|
|
|
|
|
|
|
|
|
10 |
8 |
|
|
|
|
|
|
|
|
|
|
8 |
6 |
|
|
|
|
|
|
|
|
|
|
6 |
4 |
|
|
|
|
|
|
|
|
|
|
4 |
2 |
|
|
|
|
Interest Rate |
|
|
|
|
2 |
|
|
|
|
|
|
|
|
|
|
|
||
0 |
|
|
|
|
|
|
|
|
|
|
0 |
1950 |
1955 |
1960 |
1965 |
1970 |
1975 |
1980 |
1985 |
1990 |
1995 |
2000 |
2005 |
F I G U R E 7 Money Growth (M2 Annual Rate) and Interest Rates (Long-Term U.S. Treasury Bonds), 1950–2002
Sources: Federal Reserve Bulletin, p. A4, Table 1.10; www.federalreserve.gov/releases/h6/hist/h6hist1.txt.