

Modern Banking
.pdf[ 68 ]
M O D E R N B A N K I N G
banks are also consistent with the economic determinants of the MNE. Their expertise lay in the finance of investment projects in capital-poor countries; this expertise was acquired through knowledge of the potential of the capital importing country (hence the location of the development offices) and by being close to the source of supply, the London financial markets.
There was a rapid expansion of American banks overseas after the First World War. In 1916 banks headquartered in the USA had 26 foreign branches and offices, rising to 121 by 1920, 81 of which belonged to five US banking corporations. These banks were established for the same purpose as the 19th century commercial banks, to finance the US international trade and foreign direct investment of US corporations, especially in Latin America. In the 1920s, these banks expanded to Europe, in particular Germany and Austria. By 1931, 40% of all US short-term claims on foreigners were German.
A few American and British banks established branches early in the 20th century, but the rapid growth of MNBs took place from the mid-1960s onwards. As expected, the key OECD countries, including the USA, UK, Japan, France and Germany, have a major presence in international banking. Swiss banks occupy an important position in international banking because the country has three international financial centres (Zurich, Basel and Geneva), the Swiss franc is a leading currency, and they have a significant volume of international trust fund management and placement of bonds. The Canadian economy is relatively insignificant by most measures but some Canadian banks do have extensive branch networks overseas, including foreign retail banking; they are also active participants in the euromarkets.
Locational efficiency conditions30 in a given country are a necessary but not sufficient condition to explain the existence of MNEs. Locational efficiency is said to exist when a plant is located in a certain place because it is the lowest cost producer (in global terms) of a good or service.
Given locational efficiency is present, there are two important reasons why a MNE rather than a domestic firm produces and exports a good or service.
First, barriers to free trade, due to government policy. The most obvious example is when a government imposes a tariff or quota on the imports of a good or service. A form of tax, the tariff/quota raises the relative price of the good, discouraging consumption of the import and acting as a barrier to trade. Firms can often avoid the tariff through foreign direct investment in the country or countries erecting the trade barrier.
Second, market imperfections, such as monopoly power in a key global market. If one firm has control over the supply of a commodity (iron-ore, oil) which is a critical factor input in the production process of key goods, it can affect many industries around the world. For example, in the 1970s, OPEC31 members formed a cartel, controlling much of the world’s oil supply. They agreed to restrict production, which raised the price of oil, with serious negative consequences for the production processes of oil-dependent industries.
Market imperfections also arise because the market mechanism fails if the trade of some products, such as knowledge, is attempted. Superior knowledge about a production or swap
30Locational efficiency refers to a country which has a comparative advantage in the production and export of the good or service; in relative terms, the country is the lowest cost producer.
31Organisation of Petroleum Exporting Countries.

TEAM
FLY |
[ 69 |
] |
|
D I V E R S I F I C A T I O N O F B A N K I N G A C T I V I T I E S
technique is not easily traded on an open market. One way of profiting from it is to expand overseas and use the knowledge advantage there. Hirtle (1991) observed that certain US commercial banks, US securities firms and some European universal banks are key players in the global swap markets. Though the consumer base is multinational, the banks and securities firms tend to deal in swaps denominated in their home currency.
The presence of multinational banks may be explained using this paradigm. MNBs establish themselves because of trade barriers and/or market imperfections. In the 1960s, US banks met locational efficiency conditions, but this is not enough to explain their expansion overseas. US regulation at the time strongly discouraged foreigners from issuing bonds in the USA, and American banks were not allowed to lend US dollars to finance foreign direct investment by US multinationals. US banks set up overseas branches to help American companies escape these restrictions. For example, Nigh et al. (1986) confirm that US bank branching overseas is correlated with US business presence in a particular country.
Branching restrictions also meant US banks could not easily extend their activities to other states, and in a few states such as Illinois, banks were not allowed to have more than one branch. Thus, domestic regulation was a major contributory factor to the expansion of US multinational banks in the 1960s. For example, Citibank set up operations in London to take advantage of the eurodollar market, lending and borrowing on its own account and to assist US multinational firms to fund their foreign direct investment overseas.
Darby (1986) looked at the factors behind the growth of American MNBs from the 1960s onwards, when the number of foreign branches of US banks rose from 124 in 1960 to 905 in 1984. He argues that the motivation for US foreign bank subsidiaries was domestic banking regulations such as deposit interest ceilings, reserve requirements, various capital controls and restrictions on investment banking.32
However, there was a decline in US MNB activity from the late 1980s onwards, which, argued Darby (1986), can be explained by a number of factors. In 1978, US banks were authorised to use international banking facilities (IBFs). An IBF allows a US bank to participate directly in the eurocurrency market. Prior to IBFs, they had to use foreign branches or subsidiaries. The international competitiveness of US banks also declined and interest in foreign expansion waned as earnings from global sources contracted.
Darby also identified several factors explaining foreign bank entry into the American market. First, there was a differential between US and eurodollar interest rates; banks were able to fund their dollar-denominated assets more cheaply in the presence of a large differential. Second, the price – earnings ratios for American banks were relatively low, so purchasing an existing US bank was a cheap way to enter the market.
Generally, MNBs tend to focus on wholesale rather than retail banking. One exception is Citibank, which operates as a wholesale and retail commercial bank in the UK, Spain and Germany. Likewise, it has a significant presence in some Latin American countries. In Mexico, Citibank offers retail and wholesale banking. The two large banks, BBVA Bancomer and Banamex, hold about 30% and 20% of total deposits, respectively, while Citibank holds roughly 6%. However, its attempts to establish a British retail banking
32 US banks had to opt for either commercial or investment banking status under the 1933 Glass Steagall Act. Citibank, Bank of America and other US banks used their London subsidiaries to offer investment banking services.

[ 70 ]
M O D E R N B A N K I N G
network in the 1960s and 1970s was unsuccessful. The explanation was the presence of the big four clearing banks, together with a number of smaller banks and building societies. Citibank found it was unable to establish a branch network that could compete with the big four clearing banks, and the building societies were mutually owned. At the end of the 1990s, Citibank did establish a limited presence in UK retail banking, using remote delivery channels (telephone and internet banking, with a shared ATM network) to provide services to a select group of middle and high net worth individuals.
In the 1980s, Japanese banks entered the global banking scene to follow their corporate customers overseas. The growth of Japanese multinational enterprises is, in turn, explained by two factors. The first was to overcome barriers to trade. By locating plants in the UK or other European states, firms (e.g. Japanese car and, later, electronic good manufacturers) could escape onerous tariffs imposed on imports from outside the EU area. The second key reason is unique to Japan. As the size of the Japanese current account surplus and the strength of the yen increased from the mid-1970s onwards, the country came under extreme pressure from the USA and other western governments to do something to reduce the size of the current account, and the strength of the yen. Foreign direct investment and the international use of the yen would help to offset this surplus. From 1983 onwards, the Japanese government introduced measures designed to increase the international use of the yen. For example, restrictions on foreign entry into the country’s domestic financial markets were eased, which put pressure on domestic banking markets and encouraged banks to expand internationally.33 Some Japanese banks used their London and New York offices to gain experience in new markets (e.g. derivatives), to be in a good position to take advantage of any regulatory reform in Japan, which finally came with ‘‘Big Bang’’ in 1996.
Japanese foreign branches engaged in two types of loan business in the global markets. Credit is granted to Japanese firms, including trading houses, auto producers, consumer electronics firms, stockbrokers and the banks’ own merchant banking subsidiaries. In addition, loans are made to non-Japanese institutions with a very low default risk. In the UK, these are building societies, governments and utility companies. Both involve large volume simple loan instruments, supplied at low cost. Japanese foreign branches and subsidiaries are not important players in foreign domestic markets. Their foreign presence is greatest in London, but Japanese banks have experienced severe problems since 1990. Their difficulties at home throughout the decade may explain the decline in their share of total UK bank assets, from 7.6% in 1997 to 4.3% in 1999.
Ter Wengel (1995) sets out to identify the factors which explain international banking, including multinational banking. The sample consisted of 141 countries with a MNB presence in the form of representative offices, branches and subsidiaries of the home bank. A number of explanatory factors were found to be highly significant. They include: regulations such as restrictions on capital movements, the size of the exporting country (measured by GNP), the presence of home country MNBs, and countries with designated banking centres.34
33Bank of England (1997).
34Bahamas, Bahrain, Windward and Leeward islands (e.g. Anguilla, Nevis, Montserrat, Antigua. St. Kitts, Barbados, Grenada and others), Hong Kong, the Grand Cayman Islands, Channel Islands, Netherlands Antilles, Panama, Singapore and the Pacific Ocean Islands (e.g. Kiribati, Fiji, Solomon Islands, Guam and others).

[ 71 ]
D I V E R S I F I C A T I O N O F B A N K I N G A C T I V I T I E S
As was noted earlier, the presence of market imperfections is another reason for the growth of multinational enterprises. In the case of MNBs, the knowledge factor is a critical component for successful banking, but difficult to trade on open markets. For example, the expertise of the top US commercial banks in securitisation can be used by their subsidiaries in Europe as this activity grows. Since it cannot normally be traded,35 expansion through MNBs allows the banks to profit from the knowledge factor.
A paper by Alford et al. (1998) provides an interesting illustration of the importance of knowledge transfers. The authors were looking at the reasons why joint ventures were chosen as a means of building up a merchant banking industry in Singapore. The government had signalled its plan to turn Singapore into a key regional and international financial centre. Merchant banking was viewed as an important component of any key centre, and the first merchant bank was established in 1970. By 1982, 45 merchant banks had been established. The sample consisted of 79 banks, 56 of which were wholly owned; 23 spent at least a year as a joint venture in the period 1974 – 91. There were 85 partners in the 23 joint ventures – 67 were from outside Singapore. Of the 56 wholly owned merchant banks, 52 were foreign, i.e. headquartered outside Singapore.
The paper compares the performance of the joint venture and wholly owned merchant banks. Alford et al. identify the potential benefits of joint ventures, such as knowledge creation and learning, limiting entry into product markets, or bypassing government regulations. There are also costs. There is an incentive for partners to free-ride on each other because each one shares the output of the firm regardless of the resources invested to make the venture a success. Communication problems between partners can be aggravated if they are international.
Alford et al. (1998) argue their findings are consistent with two theoretical reasons for joint ventures. First, they are created to transfer knowledge among partner firms. In one case, the commercial banking partner learned about merchant banking from the international partner, and the foreign partner obtained connections with blue chip Singaporean firms. Once these learning/networking advantages were realised, the organisational form of the bank changed and it became wholly owned.
Second, a large number of partners were international. Entering into joint partnerships limited their exposure to economic and political uncertainties. As these uncertainties are alleviated over time, it became optimal to buy out the Singapore partners. The results of this study suggest cautious foreign banks may enter a new country via a joint venture, to reduce exposure to economic and political uncertainties. Over time, some of these concerns are alleviated and knowledge is gained. The response is to buy out the host country partner (e.g. the Singapore firm), leaving an independent MNB. Thus, by 1991, only 6 (out of 23) joint ventures remained – 15 became wholly owned and 2 were dissolved.
Other factors explain the growth of MNBs. First, reputation is important: the US money centre banks can set up subsidiaries in Europe and take advantage of their good reputation – though there are limits to this, as Citibank found to its cost. Also, following corporate activities overseas means banks can monitor the credit risk of their MNE
35 It has been known for an individual or a team of specialists at one firm to be ‘‘bought’’ (by offers of better pay packages, etc.) by a rival bank, an example of a successful trade in knowledge.

[ 72 ]
M O D E R N B A N K I N G
borrowers by assessing the performance of overseas operations, in addition to supplying banking services.
Finally, foreign bank entry may stimulate economic development in emerging markets. Some countries limit foreign bank entry, usually to protect the national banking sector, for reasons related to national sovereignty. However, the foreign banks can stimulate competition in this sector, and in emerging markets provide services that would not otherwise be available. He and Gray (2001) use the relaxation of controls on foreign banks in China to demonstrate the point. After China announced it would allow foreign bank entry in December 1990, the number of foreign banks doubled, rising from 12 in 1990 to 24 in 1997 in the Shenzhen Special Economic Zone (SSEZ). Using data on inward foreign direct investment and GDP in the SSEZ, the authors show that the presence of multinational banks improved the financial infrastructure, which in turn encouraged more foreign direct investment, raising SSEZ GDP.
2.6. Banking Issues in the 21st Century
A recent, popular opinion is that the contribution of banks to the economy will diminish significantly or that banks will even disappear, as the traditional intermediary and liquidity functions of the bank decline in the face of new financial instruments and technology.
Rybczynski (1997) argued that financial systems evolve through time, passing through three phases. Phase one is bank oriented, where most external finance is raised through bank loans, which in turn is funded through savings. Banks are the most important financial intermediaries in the financial system, and interest income is the main source of revenue. Phase two is market oriented. Households and institutional investors begin to hold more securities and equity, and non-bank financial institutions may offer near-bank products, such as money market accounts. Banks themselves reduce their dependence on the traditional intermediary function, increasing their off-balance sheet activities, including proprietary trading, underwriting and asset management. The market or securitised phase is established when the financial markets are the source of external finance for both the financial and non-financial sectors. Corporate bank loans are largely replaced by corporate bonds and commercial paper; mortgages and consumer credit originate in banks but are securitised. In this third phase, trading, underwriting, advising and asset management activities become more important for banks than the traditional core banking functions.
Bill Gates, the IT guru, is well known for an alleged remark he made in 1994 that banks were ‘‘dinosaurs’’,36 which could be bypassed. In 1995, after much consternation among the banking sector about his intentions, Mr Gates subsequently claimed he meant that banking systems were dinosaurs. In a 1997 article published in The New York Times, he said:
‘‘These changes [referring to the internet] won’t come at the expense of the banking industry. . . the future is bright. . . for institutions that evolve. Technology will let banks get
36 Reported in Culture Club, Newsweek, 11 July 1994, p. 38.

[ 73 ]
D I V E R S I F I C A T I O N O F B A N K I N G A C T I V I T I E S
closer to customers, deliver a wider range of services at lower costs and streamline internal systems so that all customer data is integrated and can be used to spot trends that can lead to new products. . . The Web will offer banks great opportunities – It will be interesting to see which banks step up to this opportunity. . .’’37
The key word is ‘‘evolve’’, to be discussed at the end of the section. Before doing so, the performance of the banking sector is reviewed, together with a discussion of how banks might (and have) turned potential threats into opportunities.
Most studies show that the banking sector underperforms compared to other sectors; and a few argue banks are in an irreversible decline. Some go further, claiming that governments’ (or central banks’) control over interest rates, and therefore price stability, is under threat.
It is useful to begin by looking at some general figures to establish the position of the banking/financial sector at the beginning of the new century. Begin with the performance of banks measured by bank profitability. Figures 2.3(a) and (b) show, respectively, the ratio of pre-tax and post-tax profits to gross income for all banks over the period 1989 – 99. In the 1980s, Japanese banks, already very profitable, became even more so. But banks’ profits elsewhere were either trendless or slipping. The late 1980s were marked by sharp swings in the profits of Anglo-American banks. After 1990, the situation in Japan changed substantially. There were steady falls in profits from 1990, with a dramatic decline in 1996 – 98. The recovery to average levels in 1999 was short-lived. These figures are an indication of the serious problems encountered by Japan’s banks, discussed in detail in Chapters 5 and 6. Banks in France underwent steady declines in profitability in the early period, but profits have gradually improved since 1996. Like the previous decade, banks in the other major OECD countries show slight rises in the late 1990s, after some declines in the early 1990s.
Turning to the growth of bank assets, in the 1970s, bank assets grew rapidly in nominal terms across the 14 countries, but with wide dispersion, as shown in Table 2.3 and Figure 2.4. Luxembourg exhibited the fastest growth rate, which was more than three times faster than the slowest, the USA. More restrictive monetary policies and lower inflation contributed to the sharply lower growth almost everywhere in the 1980s and 1990s. The lower growth rate of assets also reflected a move away from the strategy of asset expansion to create large banks, or growth for growth’s sake, to an emphasis on maximising profits and shareholder value-added. Belgium was the only country where bank assets grew more quickly in the 1990s than the 1980s; and in Portugal, bank asset growth was faster in the 1990s than in the 1970s. Japan’s financial difficulties in the 1990s underline the collapse in bank asset growth – Japan saw the largest rise in the 1980s of the 14 countries, dropping to the lowest in the 1990s.
Figure 2.5 refers to banks’ foreign assets. Though there were some exceptions, foreign asset growth rates tended to outpace domestic assets in all three decades, as a comparison of Figures 2.4 and 2.5 reveals. In the UK, the foreign asset growth rate more than halved
37 Bill Gates (1997), ‘‘No one is really living a Web Lifestyle – Yet’’, New York Times, 29 July 1997; available at www.htimes.com/today/access/columns/0729bill.html.

[ 74 ]
M O D E R N B A N K I N G
Figure 2.3 (a) Ratio of pre-tax profit to gross income.
|
0.5 |
|
|
|
|
|
|
|
|
|
|
|
USA |
|
|
|
|
|
|
|
|
|
|
|
|
|
|
|
0.3 |
|
|
|
|
|
|
|
|
|
|
|
Japan |
|
|
|
|
|
|
|
|
|
|
|
|
UK |
|
|
|
|
|
|
|
|
|
|
|
|
|
|
|
|
0.1 |
|
|
|
|
|
|
|
|
|
|
|
France |
|
|
|
|
|
|
|
|
|
|
|
|
|
Germany |
Ratio |
−0.1 |
89 |
90 |
91 |
92 |
93 |
94 |
95 |
96 |
97 |
98 |
99 |
Canada |
−0.3 |
|
|
|
|
|
|
|
|
|
|
|
|
|
|
|
|
|
|
|
|
|
|
|
|
|
|
|
|
−0.5 |
|
|
|
|
|
|
|
|
|
|
|
|
|
−0.7 |
|
|
|
|
|
|
|
|
|
|
|
|
|
−0.9 |
|
|
|
|
|
|
|
|
|
|
|
|
|
|
Source: OECD Paris (2000) Bank Profitability Statistical Supplement |
|
|
|||||||||
|
|
Pre-tax Profit divided by Gross Income. See note on all banks (1989–1999) |
|
||||||||||
|
1.0 |
|
|
|
|
|
|
|
|
|
|
|
Luxembourg |
|
0.8 |
|
|
|
|
|
|
|
|
|
|
|
|
|
|
|
|
|
|
|
|
|
|
|
|
Belgium |
|
|
|
|
|
|
|
|
|
|
|
|
|
|
|
|
0.6 |
|
|
|
|
|
|
|
|
|
|
|
Netherlands |
|
0.4 |
|
|
|
|
|
|
|
|
|
|
|
Denmark |
|
|
|
|
|
|
|
|
|
|
|
|
Finland |
|
|
0.2 |
|
|
|
|
|
|
|
|
|
|
|
|
Ratio |
|
|
|
|
|
|
|
|
|
|
|
Sweden |
|
|
|
|
|
|
|
|
|
|
|
|
|
||
0.0 |
|
|
|
|
|
|
|
|
|
|
|
|
|
|
|
|
|
|
|
|
|
|
|
|
|
|
|
|
−0.2 90 |
91 |
92 |
93 |
94 |
95 |
96 |
|
97 |
98 |
99 |
|
|
|
−0.4 |
|
|
|
|
|
|
|
|
|
|
|
|
|
−0.6 |
|
|
|
|
|
|
|
|
|
|
|
|
|
−0.8 |
|
|
|
|
|
|
|
|
|
|
|
|
|
−1.0 |
|
|
|
|
|
|
|
|
|
|
|
|
|
|
Source: OECD Paris (2000) Bank Profitability Statistical Supplement |
|
|
|||||||||
|
|
Pre-tax Profit divided by Gross Income. See note on all banks (1990–1999) |
|
||||||||||
|
0.6 |
|
|
|
|
|
|
|
|
|
|
|
Czech Rep |
|
|
|
|
|
|
|
|
|
|
|
|
|
|
|
0.4 |
|
|
|
|
|
|
|
|
|
|
|
Hungary |
|
0.2 |
|
|
|
|
|
|
|
|
|
|
|
Norway |
|
|
|
|
|
|
|
|
|
|
|
|
Poland |
|
|
0 |
|
|
|
|
|
|
|
|
|
|
|
Switzerland |
|
|
|
|
|
|
|
|
|
|
|
|
Turkey |
|
Ratio |
90 |
91 |
92 |
93 |
94 |
95 |
96 |
|
97 |
98 |
99 |
||
|
|
||||||||||||
|
−0.2 |
|
|
|
|
|
|
|
|
|
|
|
|
|
−0.4 |
|
|
|
|
|
|
|
|
|
|
|
|
|
−0.6 |
|
|
|
|
|
|
|
|
|
|
|
|
|
−0.8 |
|
|
|
|
|
|
|
|
|
|
|
|
|
−1 |
|
|
|
|
|
|
|
|
|
|
|
|
Source: OECD Paris (2000) Bank Profitability Statistical Supplement
Pre-tax Profit divided by Gross Income. See note on all banks (1990–1999)

[ 75 ]
D I V E R S I F I C A T I O N O F B A N K I N G A C T I V I T I E S
Figure 2.3 (b) Ratio of post-tax profits to gross income.
|
0.8 |
|
|
|
|
|
|
|
|
|
Luxembourg |
|
|
|
|
|
|
|
|
|
|
|
|
|
0.6 |
|
|
|
|
|
|
|
|
|
Belgium |
|
0.4 |
|
|
|
|
|
|
|
|
|
Netherlands |
|
|
|
|
|
|
|
|
|
|
Denmark |
|
|
|
|
|
|
|
|
|
|
|
|
|
|
0.2 |
|
|
|
|
|
|
|
|
|
Finland |
Ratio |
0.0 |
|
|
|
|
|
|
|
|
|
Sweden |
|
|
|
|
|
|
|
|
|
|
||
−0.2 |
90 |
91 |
92 |
93 |
94 |
95 |
96 |
97 |
98 |
99 |
|
|
|
|
|
|
|
|
|
|
|
||
|
|
|
|
|
|
|
|
|
|
|
|
|
−0.4 |
|
|
|
|
|
|
|
|
|
|
|
−0.6 |
|
|
|
|
|
|
|
|
|
|
|
−0.8 |
|
|
|
|
|
|
|
|
|
|
|
−1.0 |
|
|
|
|
|
|
|
|
|
|
Source: OECD Paris (2000) Bank Profitability Statistical Supplement
Pre-tax Profit divided by Gross Income. See note on all banks (1990–1999)
|
0.4 |
|
|
|
|
|
|
|
|
|
US |
|
|
0.2 |
|
|
|
|
|
|
|
|
|
Japan |
|
|
|
|
|
|
|
|
|
|
|
UK |
||
|
|
|
|
|
|
|
|
|
|
|
||
|
0.0 |
|
|
|
|
|
|
|
|
|
France |
|
|
|
|
|
|
|
|
|
|
|
Germany |
||
|
90 |
91 |
92 |
93 |
94 |
95 |
96 |
97 |
98 |
99 |
||
|
Canada |
|||||||||||
Ratio |
−0.2 |
|
|
|
|
|
|
|
|
|
||
−0.4 |
|
|
|
|
|
|
|
|
|
|
||
|
|
|
|
|
|
|
|
|
|
|
||
|
−0.6 |
|
|
|
|
|
|
|
|
|
|
|
|
−0.8 |
|
|
|
|
|
|
|
|
|
|
|
|
−1.0 |
|
|
|
|
|
|
|
|
|
|
|
|
Source: OECD Paris (2000); Bank Profitability Statistical Supplement |
|
||||||||||
|
Pre-Tax Profit divided by Gross Income. See note on all banks (1990–1999) |
|
||||||||||
|
0.6 |
|
|
|
|
|
|
|
|
|
Czech Rep |
|
|
|
|
|
|
|
|
|
|
|
|
||
|
0.4 |
|
|
|
|
|
|
|
|
|
Hungary |
|
|
|
|
|
|
|
|
|
|
|
Norway |
||
|
|
|
|
|
|
|
|
|
|
|
||
|
0.2 |
|
|
|
|
|
|
|
|
|
Poland |
|
|
0.0 |
|
|
|
|
|
|
|
|
|
Switzerland |
|
|
|
|
|
|
|
|
|
|
|
Turkey |
||
Ratio |
90 |
91 |
92 |
93 |
94 |
95 |
96 |
97 |
98 |
99 |
||
|
||||||||||||
−0.2 |
|
|
|
|
|
|
|
|
|
|
||
|
|
|
|
|
|
|
|
|
|
|
||
|
−0.4 |
|
|
|
|
|
|
|
|
|
|
|
|
−0.6 |
|
|
|
|
|
|
|
|
|
|
|
|
−0.8 |
|
|
|
|
|
|
|
|
|
|
|
|
−1.0 |
|
|
|
|
|
|
|
|
|
|
|
Source : OECD Paris (2000) Bank Profitability Statistical Supplement
Pre-tax Profit divided by Gross Income. See note on all banks (1990–1999)
[ 76 ]
M O D E R N B A N K I N G
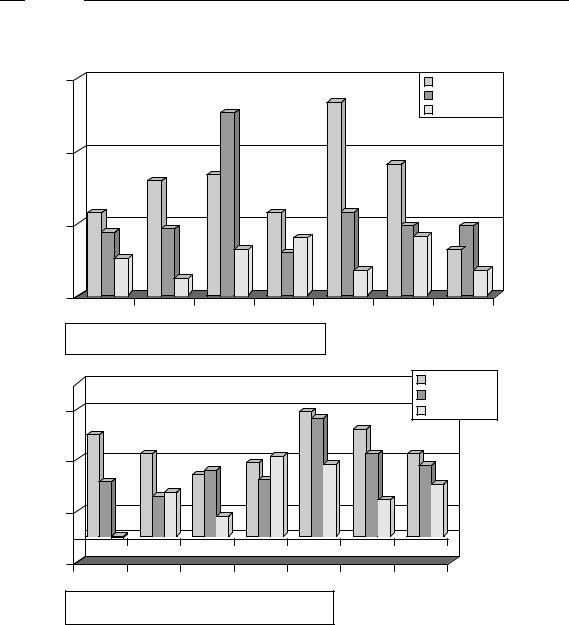
Figure 2.4 Average annual growth rate of domestic bank assets.
Growth Rate (%)
30 |
|
|
|
|
|
1970 to 1979 |
|
|
|
|
|
|
1980 to 1989 |
|
|
|
|
|
|
1990 to 1999 |
20 |
|
|
|
|
|
|
10 |
|
|
|
|
|
|
0 |
|
|
|
|
|
|
US |
J |
UK |
Ge |
Fr |
Can |
Swi |
Source: IMF (2000) International Financial Statistics domestic currency values
Growth Rate (%)
|
|
|
|
|
|
1970 to 1979 |
|
|
|
|
|
|
1980 to 1989 |
25 |
|
|
|
|
|
1990 to 1999 |
15 |
|
|
|
|
|
|
5 |
|
|
|
|
|
|
−5 |
|
|
|
|
|
|
Lux |
NL |
Dk |
Belg |
Por |
Sp |
I |
Source: IMF (2000) International Financial Statistics domestic currency values
between the 1980s and 1990s but in Switzerland, it doubled. Again, Portugal stands out for high and rising growth rates of foreign assets during the two decades.
The average ratio of total assets to nominal GDP for most industrialised countries since 1970 appears in Figure 2.6. For Switzerland, banking assets have been more than 100% of national income since the 1970s, and very nearly so for Japan and Germany. In other

[ 77 ]
D I V E R S I F I C A T I O N O F B A N K I N G A C T I V I T I E S
Figure 2.5 Average annual growth rate of foreign assets.
Growth Rate (%)
30 |
|
20 |
|
10 |
|
0 |
|
US |
J |
Uk |
Ge |
Fr |
Can |

 1970 to 1979
 1980 to 1989
 1990 to 1999
Swi |
Source : IMF (2000) International Financial Statistics domestic currency values
Growth Rate (%)
40 |
|
|
|
|
|
1970 to 1979 |
|
|
|
|
|
|
|
|
|
|
|
|
|
1980 to 1989 |
|
|
|
|
|
|
1990 to 1999 |
30 |
|
|
|
|
|
|
20 |
|
|
|
|
|
|
10 |
|
|
|
|
|
|
0 |
|
|
|
|
|
|
Lux |
NL |
Dk |
Belg |
Por |
Sp |
I |
Source: IMF (2000) International Financial Statistics domestic currency values
countries, there has been a steady rise from 40% to 60% of national income in the 1970s, to well over 100% by the 1990s. The notable exception is the United States, where the 1990s figure is barely higher than the 1970s one. Including foreign assets (Figure 2.7) makes the figures more pronounced, but the trends are unchanged. Thus, even though, in absolute terms, asset expansion has slowed since the 1970s, in most countries banks’ assets as a