

ECHO 2013 / Aortic Stenosis Quantitation It’s Not All About the Gradient
.pdfRisk stratification in AS: Importance of Valvular, Arterial and Ventricular Interplay
163 asymptomatic patients with severe AS
HR= 1.7, p=0.027
Peak aortic velocity ≥ 4.4 m.s-1
HR= 1.9, p=0.013 Zva ≥ 4.9 mmHg.ml-1.m-2 


HR= 2.2, p=0.003
Longitudinal strain ≤ 15.9 %
HR= 2.8, p=0.001
Ind. LA area ≥ 12.2 cm2/m2
0 1 2 3 4 5 6
Lancellotti et al. Heart 2010 |
Hazard-ratio |
|

Severe Aortic Stenosis
VPeak>4 m/s
Mean gradient >40 mm Hg AVA < 1.0 cm²

 Re-evaluation Undergoing CABG or
other heart surgery?
Symptoms?
Yes |
|
|
Equivocal |
|
|
No |
|
|
|
|
Normal |
|
|
|
|
|
Exercise test |
LV ejection fraction |
||
|
Symptoms |
|
||||
|
|
|
|
|
||
|
|
|
|
|
||
|
BP |
<50% |
|
|
Normal |
|
|
|
|
|
|
||
(ESC) |
(ACC/AHA) |
|
|
|
|
|
Yes
Class I |
|
Class I |
|
Class IIb |
|
Class I |
|
Class IIa |
|
Class IIb |
|
|
|
|
|
|
|
|
|
|
|
Very severe AS (<0.6 cm2)
Severe valve calcification (≥3/4) Rapid progression (≥0.3 m /s/yr)
High Zva (<4.5)
Reduced GLS (<15%)
No
Aortic Valve Replacement |
Clinical/ echo follow-up, |
Wait for symptoms
Preoperative coronary angiography

Low-Flow, Low-Gradient AS
NORMAL-LVEF |
NORMAL-LVEF |
LOW-LVEF |
NORMAL-FLOW |
«PARADOXICAL» |
«CLASSICAL» |
HIGH-GRADIENT |
LOW-FLOW |
LOW-FLOW |
|
LOW-GRADIENT |
LOW-GRADIENT |
50-70% |
10-25% |
5-10% |
Case #1
Pibarot & Dumesnil
JACC, in press

LVEF≤40%
P<40
AVA≤1.0
Dobutamine-Stress Echo
|
|
SV ≥ 20 % |
|
|
|
|
|
|
SV < 20 % |
|||||
|
|
|
|
|
|
|
|
|
|
|
|
|
|
|
|
Contractile (Flow) Reserve |
|
No Contractile (Flow) Reserve |
|
|
|||||||||
|
|
|
|
|
|
|
|
|
|
|
|
AS Severity: |
|
|
|
|
|
|
|
|
|
|
|
|
|
|
|||
|
|
|
|
|
|
|
|
|
|
|
|
|||
|
|
|
|
|
|
|
|
|
|
|
|
Indeterminate |
||
|
P≥40 |
|
P<40 |
|
|
|
|
|
|
|||||
AVA<1.0-1.2 |
AVA ≥1.0-1.2 |
|
|
MSCT: Ca Score ≥1650? |
|
|||||||||
|
|
|
|
|
|
|
|
|
|
|
|
|||
|
|
|
|
|
|
|
|
|
|
|
|
|
|
|
|
|
|
|
|
|
|
|
|
|
|
No |
Yes |
||
|
|
|
|
|
|
|
|
|
|
|
|
|||
|
|
|
|
|
|
|
|
|
|
|
|
|
||
|
True-Severe AS |
|
|
Pseudo-Severe AS |
|
|
True-Severe AS |
|
||||||
|
|
|
|
|
|
|
|
|
|
|
|
|
|
|
|
SAVR CABG |
|
MEDICAL Rx TRIAL |
SAVR (High Op. Risk) |
||||||||||
|
|
|
TAVR? |
|||||||||||
|
|
|
|
|
|
|
|
|
|
|
|
|||

2012 ESC/EACTS Guidelines on Management
of VHD: Indications for AVR in AS
Vahanian et al. EHJ 2012

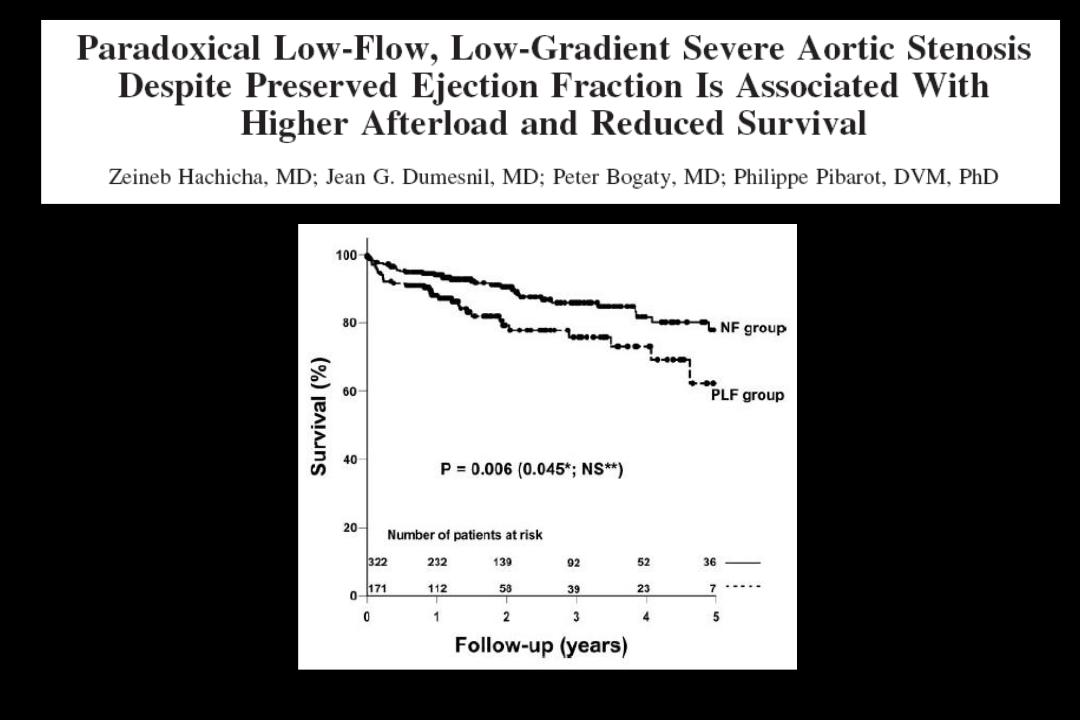
“Paradoxical” Low-Flow,
Low-Gradient AS with
Preserved LVEF
↑Age
Women Hypertension MetS – Diabetes
Hachicha Z et al., Circulation, 2007
Dumesnil et al. Eur Heart J, 2009 Pibarot & Dumesnil JACC, 2012

Doppler-Echo Features of Paradoxical
Low-Flow, Low-Gradient AS
The Aortic Valve:
AVA< 1.0 cm2 AVAi < 0.6 cm2/m2 DVI<0.25
Severely thickened/calcified valve
Mean gradient <40 mmHg
Valvulo-arterial impedance > 4.5
The Left Ventricle
EDD<47 mm EDV< 55 mL/m2
RWT ratio > 0.50
Myocardial fibrosis
Impaired LV filling
LVEF > 50%
GLS < 15%
SVi < 35 mL/m2
Pibarot & Dumesnil, JACC 58;413-415, 2011
Hachicha Z et al., Circulation. 115:2856-2864, 2007

Impact of AVR on Survival in Patients with Paradoxical Low-Flow, Low-Gradient AS
Clavel MA
JACC in press
Tarantini et al. Ann Thorac Surg, 91:1808 –15, 2011
Clavel et al. JACC 2012

Results
KM mortality for LF vs NF
Definitions
Low flow (LF) : SVI ≤ 35 mL/m²
Low ejection fraction (LEF): LV EF ≤ 50% Low gradient (LG): Mean gradient ≤ 40 mmHg
ITT - Cohorts A & B
2-Yr Death (%)
ITT - Cohorts A & B
80% |
|
LF LEF |
|
HR: 1.07 [95% CI: 0.83, 1.37] |
|||
|
|
|
Log-Rank p= 0.616 |
||||
|
|
|
|
||||
70% |
|
LF NEF |
|
|
|||
|
|
|
|||||
60% |
|
|
|
|
|
|
|
50% |
|
|
|
|
|
|
48.9% |
40% |
|
|
|
|
|
|
46.1% |
30% |
|
|
|
|
|
|
|
20% |
|
|
|
|
|
|
|
10% |
|
|
|
|
|
|
|
0% |
|
|
|
|
|
|
|
0 |
4 |
8 |
12 |
16 |
20 |
24 |
|
|
70% |
|
LF (Low Flow) |
|
|
HR: 1.52 [95% CI: 1.24, 1.87] |
|||
|
|
|
|
||||||
|
|
|
|
|
Log-Rank p= <.001 |
||||
|
60% |
|
NF (Normal Flow) |
|
|||||
|
|
|
|
|
|
|
|||
|
|
|
|
|
|
|
|
|
|
(%) |
50% |
|
|
|
|
|
|
47.2% |
|
Death |
30% |
|
|
|
|
|
|
|
|
|
40% |
|
|
|
|
|
|
|
|
2-Yr |
|
|
|
|
|
|
|
33.9% |
|
20% |
|
|
|
|
|
|
|
|
|
|
|
|
|
|
|
|
|
|
|
|
10% |
|
|
|
|
|
|
|
|
|
0% |
|
|
|
|
|
|
|
|
|
0 |
|
4 |
8 |
12 |
16 |
20 |
24 |
|
Numbers at Risk |
|
|
Months |
|
|
|
|
||
|
|
|
|
|
|
|
|||
|
|
|
|
|
|
|
|
|
|
LF |
530 |
422 |
368 |
336 |
308 |
282 |
235 |
|
|
NF |
441 |
368 |
342 |
317 |
300 |
274 |
239 |
|
|
|
|
|
|
|
|
|
|
|
|
Herrmann et al TCT 2012
Numbers at Risk |
|
|
|
Months |
|
|
|
|
|
||
|
|
|
|
|
|
|
|
|
|||
|
|
|
|
|
|
|
|
|
|
|
|
LF LEF LG |
225 |
177 |
154 |
142 |
128 |
119 |
100 |
|
|
||
NF LEF NG |
304 |
214 |
213 |
193 |
179 |
162 |
134 |
|
|
||
|
|
|
|
|
|
|
|
||||
|
|
|
ITT - Cohorts A & B |
|
|
|
|||||
|
|
|
|
|
|
HR: 0.97 [95% CI: 0.65, 1.44] |
|||||
(%) |
70% |
|
|
LF LEF LG |
|
Log-Rank p= 0.886 |
|||||
|
|
|
|||||||||
|
|
|
|
||||||||
60% |
|
|
LF LEF NG |
|
|
|
50.9% |
|
|
||
|
|
|
|
|
|
|
|
||||
|
|
|
|
|
|
|
|
|
|
||
Death |
50% |
|
|
|
|
|
|
|
|
|
|
|
|
|
|
|
|
|
|
|
|
||
40% |
|
|
|
|
|
|
|
48.0% |
|
|
|
|
|
|
|
|
|
|
|
|
|
||
|
30% |
|
|
|
|
|
|
|
|
|
|
|
|
|
|
|
|
|
|
|
|
|
|
Yr |
20% |
|
|
|
|
|
|
|
|
|
|
10% |
|
|
|
|
|
|
|
|
|
|
|
2- |
|
|
|
|
|
|
|
|
|
|
|
|
|
|
|
|
|
|
|
|
|
|
|
|
0% |
|
|
|
|
|
|
|
|
|
|
|
0 |
|
4 |
8 |
12 |
16 |
20 |
24 |
|
|
|
Numbers at Risk |
|
|
|
Months |
|
|
|
|
|
||
|
|
|
|
|
|
|
|
|
|||
|
|
|
|
|
|
|
|
|
|
|
|
LF LEF LG |
147 |
115 |
100 |
94 |
83 |
76 |
67 |
|
|
||
NF LEF NG |
78 |
62 |
54 |
48 |
45 |
43 |
33 |
|
|
||
|
|
|
|
|
|
|
|
|
|
|
|