

ECHO 2013 / Aortic Stenosis Quantitation It’s Not All About the Gradient
.pdfPressure Recovery: Reclassification of AS Severity
Case #2
Severe
AS
Doppler |
|
|
Aorta Diameter (mm) |
|
|
|||
AVA |
|
|
|
|
||||
|
|
|
|
|
|
|
|
|
|
|
|
|
|
|
|
|
|
(cm2) |
20 |
25 |
30 |
35 |
|
40 |
45 |
|
0.4 |
0.5 |
0.4 |
0.4 |
0.4 |
|
0.4 |
0.4 |
|
|
|
|
|
|
|
|
|
|
0.5 |
0.6 |
0.6 |
|
0.5 |
0.5 |
|
0.5 |
0.5 |
|
|
|
|
|
|
|
|
|
0.6 |
0.7 |
0.7 |
|
0.7 |
0.6 |
|
0.6 |
0.6 |
|
|
|
|
|
|
|
|
|
0.7 |
0.9 |
0.8 |
|
0.8 |
0.8 |
|
0.7 |
0.7 |
|
|
|
|
|
|
|
|
|
0.8 |
1.1 |
1.0 |
|
0.9 |
0.9 |
|
0.9 |
0.8 |
|
|
1.1 |
|
|
|
|
|
|
0.9 |
1.3 |
|
1.0 |
1.0 |
|
1.0 |
1.0 |
|
|
|
|
|
|
|
|
|
|
1.0 |
1.5 |
1.3 |
|
1.2 |
1.1 |
|
1.1 |
1.1 |
|
|
|
|
|
|
|
|
|
1.1 |
1.7 |
1.4 |
|
1.3 |
1.2 |
|
1.2 |
1.2 |
1.2 |
1.9 |
1.6 |
|
1.4 |
1.4 |
|
1.3 |
1.3 |
1.3 |
2.2 |
1.8 |
|
1.6 |
1.5 |
|
1.5 |
1.4 |
1.4 |
2.5 |
2.0 |
|
1.7 |
1.6 |
|
1.6 |
1.5 |
1.5 |
2.9 |
2.2 |
|
1.9 |
1.8 |
|
1.7 |
1.7 |
|
|
|
|
|
|
|
|
|
Garcia et al., JACC 2003; 41:435-42

Reclassification From Severe to Non-Severe AS by Pressure Recovery Adjustment
SEAS
N=1563
Bahlman et al. J Am Coll Cardiol Img 2010;3:555–62

Prognostic Value of Energy Loss Index in
Asymptomatic Aortic Stenosis:
A Substudy of the SEAS Trial
Bahlmann et al. Circulation 2013;127:1149-1156

Patients with calcific AS often have reduced Arterial Compliance
40% of patients with calcific AS have markedly reduced arterial compliance
PibarotBriand& Dumesnilet al., JACC,et al2005;46:291., JACC, 2012-8.

Assessing the Total Hemodynamic Load

Valvulo-Arterial Impedance: A New Parameter
to Estimate Total (Valvular + Arterial)
LV Hemodynamic Load
AA 
EOA 
SV
Static Pressure
LVSP |
∆Pnet |
|
|
|
∆P |
SAP
Flow axis
} Valvular Load}
Total Load
} Arterial Load
Briand et al., JACC,
46:291-8, 2005
Hachicha et al., Circulation, 115:2856-2864, 2007
Valvulo-Arterial Impedance |
>3.5: Moderate |
||
>4.5: Severe |
|||
LVSP |
SAP +∆PMean |
||
|
|||
Zva = |
= |
|
|
SVi |
SVi |
Case #1: Zva=5.1 |
|
|
|
||
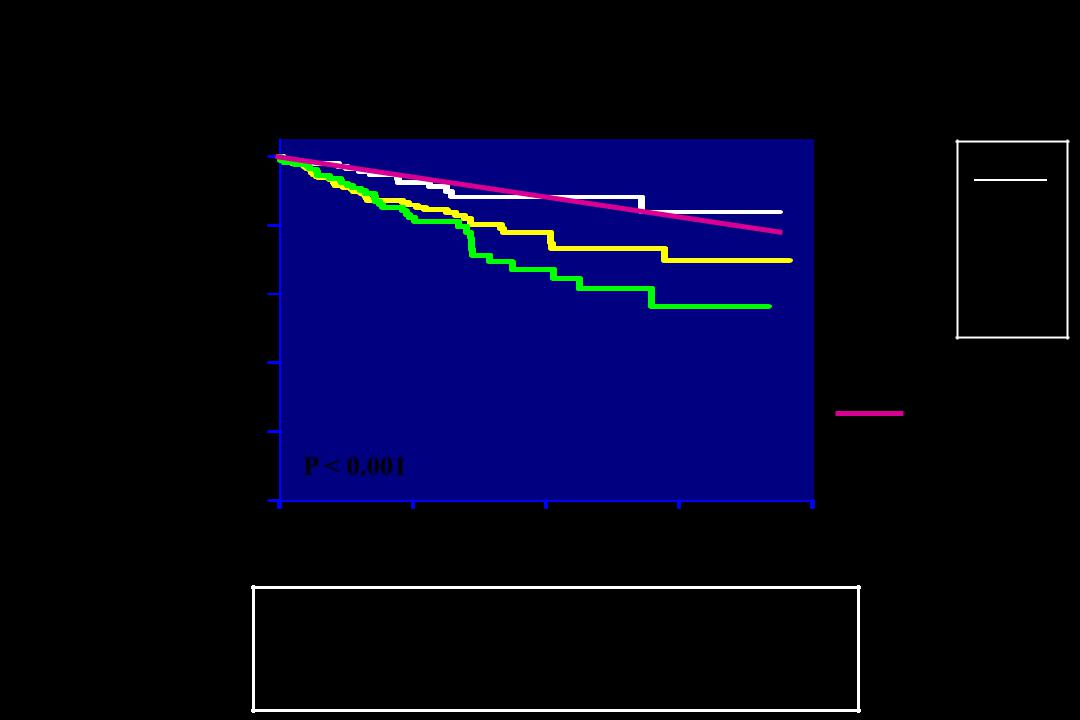
Impact of Valvulo-Arterial Impedance
on Overall Survival
Survival
(%)
544 Pts.
≥ moderate AS Asymptomatic
Hachicha et al. JACC 54; 1003-1011; 2009
100 |
|
|
|
|
80 |
|
|
|
|
60 |
|
|
|
|
40 |
|
|
|
|
20 |
|
|
|
|
|
|
P < 0.001 |
|
|
0 |
|
2 |
4 |
6 |
|
||||
0 |
||||
|
|
Follow-up (years) |
||
3 years
Zva<3.5 88 ± 3%
3.5≤Zva<4.5 80 ± 3%
Zva≥4.5 70 ± 5%
General Canadian Population Matched
for Age-Gender
8
Adjusted Hazard Ratios:
3.5≤Zva<4.5: : 1.7 (95% CI: 1.4-5.6); p=0.01
Zva≥4.5: 2.0 (95% CI: 1.4-6.6); p=0.006

The Left Ventricle
►Identifying LV systolic dysfunction ►Assessing LV outflow

SEVERE AORTIC STENOSIS
Diastole Systole
16 mm |
21 mm |
Wall Thickening: 30%
LVEF: 60%
Longitudinal
12% Shortening
|
|
Case #1: GLS=12% |
Pibarot & Dumesnil et al., JACC, 2012 |
|
|
|
|
|

Cardiology. 109:122-125, 2008