


Appendix D |
583 |
Flat-plate equivalent: fw (Equation 9.8) = CFw × Aww = 0.00345 × 2,130.94 = 7.35ft2.
Vertical Tail
Table D1 gives the basic average 2D flat plate for the V-tail:
CFVTbasic = 0.00251 based on the MACVT; V-tail reference area = 235 ft2
Table D4 summarizes the 3D and other shape-effect corrections ( CFVT) needed to estimate the V-tail CFVT.
Table D4. V-tail CFVT correction (3D and other shape effects)
Item |
CFVT |
% of CFVTbasic |
Supervelocity |
0.000377 |
15 |
Pressure |
0.000015 |
0.6 |
Interference (V-tail – body) |
0.0002 |
8 |
Excrescence (rudder gap) |
0.0001255 |
5 |
Total CFVT |
0.000718 |
28.6 |
|
|
|
Therefore, the V-tail: CFVT = CF VTbasic + CFVT = 0.00251 + 0.000718 = 0.003228 Flat-plate equivalent fVT (see Equation 9.8) = CFVT × AwVT = 0.003228 × 477.05 = 1.54ft2.
Horizotal Tail
Table D1 gives the basic average 2D flat plate for the H-tail:
CFHTbasic = 0.00269, based on the MACHT; the H-tail reference area SHT = 330.5 ft2
Table D5 summarizes the 3D and other shape-effect corrections ( CFHT) needed to estimate the H-tail CFHT.
Table D5. H-tail CFHT correction (3D and other shape effects)
Item |
CF HT |
% of CF HTbasic |
|
Supervelocity |
0.0004035 |
15 |
|
Pressure |
0.0000101 |
0.3 |
|
Interference (H-tail – body) |
0.0000567 |
2.1 |
|
Excrescence (elevator gap) |
0.0001345 |
5 |
|
Total CF HT |
0.000605 |
22.4 |
|
|
|
|
|
Therefore, the H-tail: CF HT = CF HTbasic |
+ CF HT = 0.00269 + 0.000605 = |
||
0.003295 |
|
|
|
Flat-plate equivalent fHT (see Equation 9.8) = CFHT×AwHT = 0.003295×510.34 = 1.68 ft2.
Nacelle, CFn
Because the nacelle is a fuselage-like axisymmetric body, the procedure follows the method used for fuselage evaluation but needs special attention due to the throttledependent considerations.
Important geometric parameters include:
Nacelle length = 17.28 ft
Maximum nacelle diameter = 6.95 ft

584 |
Appendix D |
Average diameter = 5.5 ft
Nozzle exit-plane diameter = 3.6 ft
Maximum frontal area = 37.92 ft2
Wetted area per nacelle Awn = 300 ft2
Table D1 gives the basic average 2D flat plate for the nacelle: CFnbasic = 0.00238, based on the nacelle length
Table D6 summarizes the 3D and other shape-effect corrections, CFn, needed to estimate the total nacelle CFn for one nacelle.
For nacelles, a separate supervelocity effect is not considered because it is accounted for in the throttle-dependent intake drag; pressure drag also is accounted for in the throttle-dependent base drag.
Table D6. Nacelle CFn correction (3D and other shape effects)
Item |
CFn |
% of CFnbasic |
Wrapping (3D effect) |
0.0000073 |
0.31 |
Excrescence (nonmanufacture) |
0.0005 |
20.7 |
Boat tail (aft end) |
0.00027 |
11.7 |
Base drag (aft end) |
0 |
0 |
Intake drag |
0.001 |
41.9 |
Total CFn |
0.001777 |
74.11 |
|
|
|
Thrust Reverser Drag
The excrescence drag of the thrust reverser is included in Table D6 because it does not result from manufacturing tolerances. The nacelle is placed well ahead of the wing; hence, the nacelle–wing interference drag is minimized and assumed to be zero.
Therefore the nacelle: CFn = CFnbasic + CFn = 0.00238 + 0.001777 = 0.00416
Flat plate equivalent fn (Equation 9.8) = CFnt × Awn = 0.00416 × 300 = 1.25 ft2 per nacelle.
Pylon
The pylon is a wing-like lifting surface and the procedure is identical to the wing para- site-drag estimation. Table D1 gives the basic average 2D flat plate for the pylon; CFpbasic = 0.0025 based on the MACp.
The pylon reference area = 28.8 ft2 per pylon. Table D7 summarizes the 3D and other shape-effect corrections ( CFp) needed to estimate CFp (one pylon).
Table D7. Pylon CFp correction (3D and other shape effects)
Item |
CFp |
% of CFpbasic |
Supervelocity |
0.000274 |
10.78 |
Pressure |
0.00001 |
0.395 |
Interference (pylon–wing) |
0.0003 |
12 |
Excrescence |
0 |
0 |
Total CFp |
0.000584 |
23 |
|
|
|
Therefore, the pylon CFp = CFpbasic + CFp = 0.0025 + 0.00058 = 0.00312 Flat-plate equivalent: fp (see Equation 9.8) = CFp × Awp = 0.182 ft2 per pylon.

Appendix D |
585 |
Roughness Effect
The current production standard tolerance allocation provides some excrescence drag. The industry standard uses 3% of the total component parasite drag, which includes the effect of surface degradation in use. The value is froughness = 0.744 ft2, given in Table D8.
Trim Drag
Conventional aircraft produce trim drag during cruise and it varies slightly with fuel consumption. For a well-designed aircraft of this class, the trim drag of ftrim = 0.1 ft2 may be used.
Aerial and Other Protrusions
For this class of aircraft, faerial = 0.005 ft2.
Air-Conditioning
This is accounted for in the fuselage drag as ECS exhaust. It could provide a small amount of thrust.
Aircraft Parasite Drag Buildup Summary and CDpmin
Table D8 provides the aircraft parasite drag buildup summary in tabular form.
Table D8. Aircraft parasite drag buildup summary and CDpmin estimation
|
Wetted |
|
|
|
|
|
|
area Aw ft2 |
Basic CF |
CF |
Total CF |
f (ft2) |
CDpmin |
Fuselage + undercarriage |
4,333 |
0.00186 |
0.00069 |
0.00255 |
11.03 |
0.00918 |
fairing |
|
|
|
|
|
|
Canopy |
|
|
|
|
0.3 |
0.00025 |
Wing |
2,130.94 |
0.00255 |
0.00089 |
0.00346 |
7.35 |
0.00615 |
V-tail |
477.05 |
0.00251 |
0.00072 |
0.00323 |
1.54 |
0.00128 |
H-tail |
510.34 |
0.00269 |
0.00061 |
0.0033 |
1.68 |
0.0014 |
2 × Nacelle |
2 × 300 |
0.00238 |
0.00178 |
0.00415 |
2.5 |
0.00208 |
2 × Pylon |
2 × 58.18 |
0.00254 |
0.000584 |
0.00312 |
0.362 |
0.0003 |
Rough (3%) |
|
|
|
|
0.744 |
0.00062 |
Aerial |
|
|
|
|
0.005 |
0.000004 |
Trim drag |
|
|
|
|
0.1 |
0.00008 |
|
TOTAL |
|
|
|
25.611 |
0.0213 |
Notes:
CDpmin = 0.0213.
Wing reference area Sw =1,202 ft2; CDpmin = f/Sw ISA day; 36,089-ft altitude; and Mach 0.75.
CDp Estimation
The CDp is constructed, corresponding to the CL values, as given in Table D9.
Table D9. CDp estimation
CL |
0.2 |
0.3 |
0.4 |
0.5 |
0.6 |
CDp |
0.00044 |
0 |
0.0004 |
0.0011 |
0.0019 |
Induced Drag, CDi
The wing aspect ratio:
AR = span2 = (111.2)2/1, 320 = 9.37 gross wing area
586 Appendix D
induced drag, C = CL2 = 0 034C2
Di π AR . L
Table D10 gives the CDi corresponding to each CL.
Table D10. Induced drag
CL |
0.2 |
0.3 |
0.4 |
0.5 |
0.6 |
0.7 |
0.8 |
CDi |
0.00136 |
0.00306 |
0.00544 |
0.0085 |
0.01224 |
0.0167 |
0.0218 |
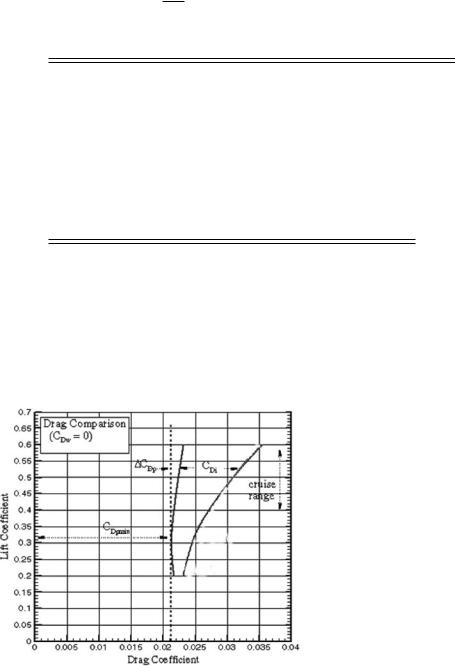
Total Aircraft Drag
Aircraft drag is given as:
CD = CDpmin + CDp + CDi + [CDw = 0]
The total aircraft drag is obtained by adding all the drag components in Table D11. Note that the low and high values of CL are beyond the flight envelope.
Table D11. Total aircraft drag coefficient, CD
CL |
0.2 |
0.3 |
0.4 |
0.5 |
0.6 |
CDpmin |
|
0.0213 from Table 7.9 |
|
||
CDp |
0.00038 |
0 |
0.0004 |
0.0011 |
0.0019 |
CDi |
0.00136 |
0.00306 |
0.00544 |
0.0085 |
0.01224 |
Total aircraft CD |
0.0231 |
0.02436 |
0.02714 |
0.0309 |
0.03544 |
|
|
|
|
|
|
Table D11 is drawn in Figure D2 to show that the PIANO software aircraft drag checks out well with what is manually estimated in this book; hence, the PIANO value is unchanged.
Figure D2. Aircraft drag polar at LRC
Engine Rating
Uninstalled sea-level static thrust = 25,000 lb per engine.
Installed sea-level static thrust = 23,500 lb per engine.
Weight Breakdown (with variations)
Design cruise speed, VC = 350 KEAS
Design dive speed, VD = 403 KEAS
Design dive Mach number, MD = 0.88
Appendix D |
587 |
Limit load factor = 2.6
Ultimate load factor = 3.9
Cabin differential pressure limit = 7.88 psi
Component |
Weight (lb) |
Percentage of MTOW |
Wing |
14,120 |
|
Flaps + slats |
2,435 |
|
Spoilers |
380 |
|
Aileron |
170 |
|
Winglet |
265 |
|
Wing group total |
17,370 |
(above subcomponent weights from [10]) |
Fuselage group |
17,600 |
(Torenbeek’s method) |
H-tail group |
1,845 |
|
V-tail |
1,010 |
|
Undercarriage group |
6,425 |
|
Total structure weight |
44,250 |
|
Power plant group (two) |
15,220 |
|
Control systems group |
2,280 |
|
Fuel systems group |
630 |
|
Hydraulics group |
1,215 |
|
Electrical systems group |
1,945 |
|
Avionics systems group |
1,250 |
|
APU |
945 |
|
ECS group |
1,450 |
|
Furnishing |
10,650 |
|
Miscellaneous |
4,055 |
|
MEW |
83,890 |
|
Crew |
1,520 |
|
Operational items |
5,660 |
|
OEW |
91,070 |
|
Payload (150 × 200) |
30,000 |
|
Fuel (see range calculation) |
41,240 |
|
MTOW |
162,310 |
|
This gives:
Wing-loading = 162,310/1,202.5 = 135 lb/ft2
Thrust-loading = 50, 000/162310 = 0.308
The aircraft is sized to this with better high-lift devices.
Payload Range (150 Passengers)
MTOM – 162,000 lb
Onboard fuel mass: 40,900 lb
Payload – 200 × 150 = 30,000 lb
LRC: Mach 0.75, 36,086 feet (constant condition)
Initial cruise thrust per engine: 4,500 lb
Final cruise thrust per engine: 3,800 lb
Average specific range: 0.09 nm/lb fuel
Climb at 250 KEAS reaching to Mach 0.7
Appendix D |
589 |
Fuel cost = 0.6 U.S.$ per U.S. gallon
Airframe price = $38 million
Two engines price = $9 million
Aircraft price = $47 million
Operating costs per trip – AEA 89 ground rules for medium jet-transport aircraft:
Depreciation |
$6,923 |
Interest |
$5,370 |
Insurance |
$473 |
Flight crew |
$3,482 |
Cabin crew |
$2,854 |
Navigation |
$3,194 |
Landing fees |
$573 |
Ground handling |
$1,365 |
Airframe maintenance |
$2,848 |
Engine maintenance |
$1,208 |
Fuel cost |
$3,066 (5,110.8 U.S. gallons) |
Total DOC |
$31,356 |
DOC/block hour |
$4,449 |
DOC/seat |
$209 |
DOC/seat/nm |
0.0735 U.S.$/seat/nm |
Readers may compare this with data available in the public domain.