


268 |
Aircraft Drag |
Nacelle
Only the external surface of the nacelle is considered the wetted area and it is computed in the same way as the fuselage, taking note of the pylon cutout area. (Internal drag within the intake duct is accounted for as installation effects in engine performance as a loss of thrust.)
9.7.3 Stepwise Approach to Compute Minimum Parasite Drag
In this book, the following seven steps are carried out to estimate the minimum parasite drag, CDpmin:
Step 1: Dissect and isolate aircraft components such as the wing, empennage, fuselage, and nacelle. Determine the geometric parameters of the aircraft components such as the characteristic length and wetted areas.
Step 2: Compute the Re per foot at the LRC condition. Then, obtain the component Re by multiplying its characteristic length.
Step 3: Determine the basic 2D average skin-friction coefficient CF basic, corresponding to the Re for each component (see Figure 9.19b).
Step 4: Estimate the CF as the increment due to 3D effects on each component.
Step 5: Estimate the interference drag of two adjacent components; avoid duplication of this effect.
Step 6: Add the results obtained in Steps 3, 4, and 5 to obtain the minimum parasite drag of a component in terms of flat-plate equivalent
(f)comp = (Aw )comp CF, where (CDpmin)comp = (f)comp/Sw . |
|
area (ft2 or m2); that is, CF = CF 2D + |
CF for the component: |
Step 7: Total all the component minimum parasite drags. Then, add other drags such as the trim and excrescence drags. Finally, add 3% drag due to surface-roughness effects. The aircraft minimum parasite drag is expressed in the coefficient form, CDpmin.
The semi-empirical formulation for each component is provided in the following subsections.
9.8 Semi-empirical Relations to Estimate Aircraft Component Parasite Drag
Isolated aircraft components are worked on to estimate component parasite drag. The semi-empirical relations given here embed the necessary corrections required for 3D effects. Associated coefficients and indices are derived from actual flighttest data. (Wind-tunnel tests are conducted at a lower Re and therefore require correction to represent flight-tested results.) The influence of the related drivers is shown as drag increasing by↑ and drag decreasing by↓. For example, an increase of the Re reduces the skin-friction coefficient and is shown as Re (↓).
9.8.1 Fuselage
The fuselage characteristic length, Lfus, is the length from the tip of the nose cone to the end of the tail cone. The wetted area, Aw f (↑), and fineness ratio (length/ diameter) (↓) of the fuselage are computed. Ensure that cutouts at the wing and
9.8 Semi-empirical Relations to Estimate Aircraft Component Parasite Drag |
269 |
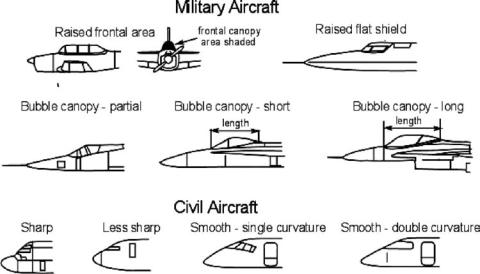
Figure 9.4. Canopy types for drag estimation
empennage junctions are subtracted. Obtain the Ref (↓). The corresponding basic CFf for the fuselage using Figures 9.19 and 9.20 is intended for the flat plate at the flight Mach number. Figure 9.19 is accurate and validated over time.
The semi-empirical formulation is required to correct the 2D skin friction drag for the 3D effects and other influencing parameters, as listed herein. These are incremental values shown by the symbol . There are many incremental effects and it is easy to miss some of them.
1.3D effects [1] are due to surface curvature resulting in a change in the local flow speed and associated pressure gradients, as follows:
(a)Wrapping:
|
CFf = CFf × [k × (length/diameter) × Re−0.2] |
(9.9) |
|
where k is between 0.022 and 0.025 (use the higher value) |
|
|
and Re = the Re of the fuselage |
|
(b) |
Supervelocity: |
|
|
CFf = CFf × (diameter/length)1.5 |
(9.10) |
(c) |
Pressure: |
|
|
CFf = CFf × 7 × (diameter/length)3 |
(9.11) |
2.Other effects on the fuselage (increments are given in a percentage of 2D CFf) are listed herein. The industry has more accurate values of these incremental CFf. Readers in the industry should not use the values given here – they are intended only for coursework using estimates extracted from industrial data. (See Section 3.21 for an explanation of the terminology used in this section.)
(a)Canopy drag. There are two types of canopy (Figure 9.4), as follows:
(i)Raised or bubble-type canopy or its variants. These canopies are mostly associated with military aircraft and smaller aircraft. The canopy drag

270 |
Aircraft Drag |
coefficient CDπ is based on the frontal cross-sectional area shown in the military type aircraft in Figure 9.4 (the front view of the raised canopy is shaded). The extent of the raised frontal area contributes to the extent of drag increment and the CDπ accounts for the effects of canopy rise. CDπ is then converted to CFf canopy = (Aπ ×CDπ )/Aw f , where Aw f is the fuselage wetted area. The dominant types of a raised or bubble-type canopy and their associated CDπ are summarized in Table 9.1.
(ii)Windshield-type canopy for larger aircraft. These canopies are typically associated with payload-carrying commercial aircraft from a small Bizjet and larger. Flat panes lower the manufacturing cost but result in a kink at the double-curvature nose cone of the fuselage. A curved and smooth transparent windshield avoids the kink that would reduce drag at an additional cost. Smoother types have curved panes with a single or double curvature. Single-curvature panes come in smaller pieces, with
a straight side and a curved side. Double-curvature panes are the most expensive and considerable attention is required during manufacturing to avoid distortion of vision. The values in square feet in Table 9.2 are used to obtain a sharp-edged windshield-type canopy drag.
(b) Body pressurization – fuselage surface waviness (use 5.5%), 5 to 6%
(c)Nonoptimum fuselage shape (interpolate the in-between values)
(i)Nose fineness ratio, Fc f (see Figure 4.17 and Table 4.5)
For Fcf ≤ 1.5: 8%
For 1.5 ≤ Fcf ≤ 1.75: 6%
For Fcf ≥ 1.75: 4%
For military aircraft type with high nose fineness: 3%
(ii)Fuselage closure – above Mach 0.6 (see Table 4.5) Less than 10 deg: 0
11 to 12 deg closure: 1%
13 to 14 deg: 4%
(iii)Upsweep closure (see Section 3.21) use in conjunction with (iv) No upsweep: 0
4 deg of upsweep: 2%
10 deg of upsweep: 8%
15 deg of upsweep: 15% (interpolate in-between values)
(iv)Aft-end cross-sectional shape Circular: 0
Shallow keel: 0 to 1% Deep keel: 1 to 2%
(v)Rear-mounted door (with fuselage upsweep): 5 to 10%
(d)Cabin-pressurization leakage (if unknown, use higher value): 3 to 5%
(e)Excrescence (nonmanufacturing types such as windows)
(i)Windows and doors (use higher values for larger aircraft): 2 to 4%
(ii)Miscellaneous: 1%
(f)Wing fuselage belly fairing, if any: 1 to 5% (use higher value if houses undercarriage)

9.8 Semi-empirical Relations to Estimate Aircraft Component Parasite Drag |
271 |
Table 9.1. Typical CDπ associated with raisedor bubble-type canopies
Raised frontal area (older boxy design, sharp edges) Raised flat shield (fewer sharp edges)
Bubble canopy (partial) Bubble canopy (short) Bubble canopy (long)
CDπ = 0.2 CDπ = 0.15 CDπ = 0.12 CDπ = 0.08 CDπ = 0.06
(g)Undercarriage fairing – typically for high-wing aircraft (if any fairing): 2 to 6%
(based on fairing protrusion height from fuselage)
3.The interference drag increment with the wing and empennage is included in the calculation of lifting-surface drag and therefore is not duplicated when computing the fuselage parasite drag. Totaling the CFf and CFf from the wetted area Aw F of the isolated fuselage, the flat-plate equivalent drag, ff (see Step 6 in Section 9.7.3), is estimated in square feet.
4.Surface roughness is 2 to 3%. These effects are from the manufacturing origin, discussed in Section 9.8.4. Because surface-roughness drag is the same percentage for all components, it is convenient to total them after evaluating all components. In that case, the term CFfrough is dropped from Equation 9.13 and it is accounted for as shown in Equation 9.27.
Total all the components of parasite drag to obtain CDpmin, as follows. It should
include the excrescence-drag increment. Converted into the fuselage contribution to [CDpmin]f in terms of aircraft wing area, it becomes:
CFf = 1.03 × Basic CFf + CFf |
(9.12) |
f f = (CFf + CFfwrap + CFfsupervel + CFfpress |
(9.13) |
+ CFfother + CFfrough) × Aw f |
|
[CDpmin] f = f f /SW |
(9.14) |
See the worked-out examples.
9.8.2 Wing, Empennage, Pylons, and Winglets
The wing, empennage, pylon, and winglets are treated as lifting surfaces and use identical methodology to estimate their minimum parasite drag. It is similar to the fuselage methodology except that it does not have the wrapping effect. Here, the
Table 9.2. Typical CDπ associated with sharp windshield type canopies
2-abreast-seating aircraft |
0.1 sq.ft. |
8-abreast-seating aircraft |
0.4 sq.ft. |
4-abreast-seating aircraft |
0.2 sq.ft. |
10-abreast or more |
0.5 sq.ft. |
6-abreast-seating aircraft |
0.3 sq.ft. |
|
|
Adjust the values for the following variations: |
|
|
|
Kinked windshield (less sharp) |
Reduce the value by 10% |
|
|
Smoothed (single-curvature) windshield |
Reduce the value by 20 to 30% |
||
Smoothed (double-curvature) windshield |
Reduce the value by 30 to 50% |
||
|
|
|
|
272 |
Aircraft Drag |
interference drag with the joining body (e.g., for the wing, it is the fuselage) is taken into account bacause it is not included in the fuselage ff.
The methodology for the wing (denoted by the subscript w) is discussed in this section. The Re Rew is calculated first using the wing MAC as the characteristic length. Next, the exposed wing area is computed by subtracting the portion buried in the fuselage and then the wetted area, AWw , using the k factors for the t/c as in Section 9.7.2. Using the Rew , the basic CFw BASIC is obtained from the graph in Figure 9.19b for the flight Mach number. The incremental parasite drag formulae are as follows:
1. |
3D effects [1]. |
|
|
|
|
|
|
|
|
|
|
|
|
|
|
(a) |
Supervelocity: |
|
|
|
|
|
|
|
|
|
|
|
|
|
|
CFw = CFw × K1 × (aerofoil t/c ratio)ave |
|
|
(9.15) |
|||||||||
|
|
where K1 = 1.2 to 1.5 for the supercritical aerofoil and K1 = 1.6 to 2 for the |
||||||||||||
|
|
conventional aerofoil |
|
|
|
|
|
|
|
|
|
|
|
|
|
(b) |
Pressure: |
|
|
|
|
|
|
|
|
|
|
|
|
|
|
|
|
|
|
|
|
|
6 |
|
|
0.125 |
|
|
|
|
|
|
|
|
|
|
|
|
|
|
|
||
|
|
CFw = CFw × 60 × (aerofoil t/c ratio)ave4 |
× |
|
|
|
(9.16) |
|||||||
|
|
AR |
|
|||||||||||
|
|
where the aspect ratio, AR ≥ 2 (modified from [1]). The last term of this |
||||||||||||
|
|
expression includes the effect of nonelliptical lift distribution. |
|
|||||||||||
2. |
Interference. |
|
|
|
|
|
|
|
|
|
|
|
|
|
|
|
2 |
× K2 × |
0.75 |
× |
(t/c)3 |
|
− |
0.0003 |
|
|
|||
|
|
|
root |
|
|
|
|
|||||||
|
|
CFw = CB |
|
Aw |
|
|
|
|
(9.17) |
|||||
|
|
|
|
|
|
|
|
|
||||||
where K2 = 0.6 for highand low-wing designs and CB is the root chord at the fuselage intersection. For the midwing, K2 = 1.2. This is valid for a t/c ratio up to 0.07. For a t/c ratio below 0.07, use the interference drag:
CFw = 3 to 5% of CFw |
(9.18) |
The same relationships apply for the V-tail and H-tail. For pylon interference, use 10 to 12%. Interference drag is not included in the fuselage drag; rather, it is accounted for in the wing drag. (Pylon interference is both at aircraft side and with the nacelle.)
3. Other effects. |
(9.19) |
|
Excrescence (i.e., nonmanufacturing such as control-surface gaps): |
|
|
Flap gaps: 4 to 5% |
|
|
Slat gaps: |
4 to 5% |
|
Others: |
4 to 5% |
|
4. Surface roughness (to be added later).
The flat-plate equivalent of the wing-drag contribution is as follows (the subscripts are self-explanatory):
fw = (CFw + CF f w supervel + CFw press + CFw inter |
|
+ CFw other + CFw rough) × Aww , |
(9.20) |