

Davis W.A.Radio frequency circuit design.2001
.pdf80 MULTIPORT CIRCUIT PARAMETERS AND TRANSMISSION LINES
The sum of the rows can also be shown to be 0. If the same voltage v0 is added to each of the terminal voltages, the terminal currents would remain unchanged:
i1 |
y11 |
y12 |
. . . y1n |
||
i2 |
y21 |
y22 |
. . . y2n |
||
.. |
D |
.. |
.. |
... |
.. |
. |
|
. |
. |
|
. |
in |
yn1 yn2 . . . ynn |
||||
Comparison of this with Eq. (4.143) shows
v1 |
C v0 |
J1 |
|
v2 |
C v0 |
J2 |
4.146 |
|
.. |
C .. |
|
|
. |
. |
|
vn C v0 |
Jn |
|
|
y11 y12
y21 y22
... ...
yn1 yn2
. . . y1n
. . . y2n
... ...
. . . ynn
v0 |
|
|
v0 |
4.147 |
|
.. |
D 0 |
|
. |
|
|
v0
So that the sum of the rows is 0. A variety of other important properties of the indefinite admittance matrix are described in [1, ch. 2] to which reference should be made for further details.
One of the useful properties of this concept is illustrated by the problem of converting common source hybrid parameters of a FET to common gate hybrid parameters. This might be useful in designing a common gate oscillator with a transistor characterized as a common source device. The first step in the process is to convert the hybrid parameters to the equivalent definite admittance matrix (which contains two rows and two columns) by using the formulas in Appendix E. The definite admittance matrix, which has a defined ground, can be changed to the corresponding 3 ð 3 indefinite admittance matrix by adding a column and a row such that rows D 0 and the columns D 0. If the y11 corresponds to the gate and y22 corresponds to the drain, then y33 would correspond to the source:
g d s
gy11 y12 y13
[Y] D d |
y21 |
y22 |
y23 |
4.148 |
s |
y31 |
y32 |
y33 |
|
The common gate parameters are found by forcing the gate voltage to be 0. Consequently the second column may be removed, since it is multiplied by the zero gate voltage anyway. At this point the second row represents a redundant equation and can be removed. In this case row 2 and column 2 are deleted, and a new common gate definite admittance matrix is formed. This matrix can then be converted to the equivalent common gate hybrid matrix.
4.10THE INDEFINITE SCATTERING MATRIX
A similar property can be determined for the scattering matrix. The indefinite scattering matrix has the property that the sum of the rows D 1 and the sum

|
THE INDEFINITE SCATTERING MATRIX |
81 |
|
Z 0 |
|
Z 0 |
|
+ |
|
+ |
|
V |
S |
V |
|
– |
|
– |
|
Z 0
+
V
–
FIGURE 4.22 The indefinite scattering parameter circuit.
of the columns D 1. For the first property the three-port shown in Fig. 4.22 is excited at all three terminals by the same voltage value. The output wave is
bj D Sj1a1 C Sj2a2 C Sj3a3, j D 1, 2, 3 |
4.149 |
Under this excitation all the input waves, aj, have the same amplitude, so Eq. (4.149) becomes
bj D Sj1 C Sj2 C Sj3 a1, j D 1, 2, 3 |
4.150 |
p p
Since from Eqs. (4.132) and (4.134) ak D Z0ICk and bk D Z0Ik , Eq. (4.150) can be written in terms of the incident and reflected currents:
IJ D [Sj1 C Sj2 C Sj3]I1C |
4.151 |
When all the terminal voltages are set equal, then all the terminal currents must be zero, since there can be no voltage difference between any two ports. Thus Ij D IC1 , which means that
Sj1 C Sj2 C Sj3 D 1 |
4.152 |
proving that the sum of the rows D 1.
To show that the sum of the columns D 1, only port-1 is excited with a voltage source. This gives a1 D6 0 and a2 D a3 D 0. By Kirchhoff’s current law the sum
of the currents into the three terminal circuit is zero: |
|
0 D I1 C I2 C I3 |
4.153 |
D I1C I1 C I2C I2 C I3C I3 |
4.154 |

82 |
MULTIPORT CIRCUIT PARAMETERS AND TRANSMISSION LINES |
|
Now, since I2C D I3C D 0 because of a2, a3, |
|
|
|
I1C D I1 C I2 C I3 |
4.155 |
In addition |
|
|
|
bk D Sk1a1 |
|
|
Ik D Sk1I1C |
4.156 |
so |
I1C D [S11 C S21 C S31]I1C |
|
|
4.157 |
|
which affirms that the sum of the columns for the indefinite scattering matrix is 1.
PROBLEMS
4.1Convert the following scattering parameters (related to 50 ') to ABCD parameters:
jS11j |
6 |
S11 |
jS21j |
6 |
S21 |
jS12j |
6 |
S12 |
jS22j |
6 |
S22 |
0.49 |
29 |
3.25 |
85 |
0.10 |
65 |
0.65 |
33 |
||||
4.2Given the S parameters, derive the z parameters.
4.3Two transmission lines are cascaded together. Transmission line 1 has a characteristic impedance of Z01 D 50 ', has a length of 30/8 cm, and is terminated on the right-hand side by a resistive load of 25 '. The lefthand side is connected to transmission line 2 whose characteristic impedance
Z02 D 30 ', and its length is &/4 at 1 GHz. What is the input impedance at the left-hand side of the 30 ' line?
4.4The transmission line circuit of length $ and characteristic impedance Z0 is terminated by a resistance RL. Determine the Q for this circuit at the first appropriate nonzero frequency.
REFERENCES
1.W.-K. Chen, Active Network and Feedback Amplifier Theory, New York: McGraw-Hill, 1980.
2.S. R. Seshadri, Fundamentals of Transmission Lines and Electromagnetic Fields, Reading MA: Addison-Wesley, 1971, pp. 335–350.
3.C. T. Tai, Generalized Vector and Dyadic Analysis, Piscataway, NJ: IEEE Press, 1997.
4.H. A. Wheeler, “Transmission-Line Properties of a Strip on a Dielectric Sheet on a Plane,” IEEE Trans. Microwave Theory Tech., Vol. MTT-25, pp. 631–647, 1977.

REFERENCES 83
5.E. Hammerstad and O. Jensen, “Accurate Models for Microstrip Computer-Aided Design,” 1980 IEEE MTT-S International Microwave Symp. Digest, pp. 407–409, 1980.
6.K. C. Gupta, R. Garg, and R. Chadha, Computer Aided Design of Microwave Circuits, Dedham, MA: Artech House, 1981.
7.R. A. Pucel, D. J. Masse,´ and C. P. Hartwig, “Losses in Microstrip,” IEEE Trans. Microwave Theory Tech., Vol. MTT-16, pp. 342–350, 1968.
8.R. A. Pucel, D. J.Masse,´ and C. P. Hartwig, “Corrections to ‘Losses in Microstrip,’ “IEEE Trans. Microwave Theory Tech., Vol. MTT-16, p. 1064, 1968.

Radio Frequency Circuit Design. W. Alan Davis, Krishna Agarwal
Copyright 2001 John Wiley & Sons, Inc.
Print ISBN 0-471-35052-4 Electronic ISBN 0-471-20068-9
CHAPTER FIVE
Filter Design and
Approximation
5.1INTRODUCTION
The subject of network synthesis became highly refined in the twentieth century due to the work of some very capable electrical engineers. To work through that body of knowledge would be beyond the present purpose of reviewing filter synthesis techniques. This chapter will therefore concentrate on basic techniques and solutions to the filter approximation problem and implementations that have come about by special requirements. At this point in time, operational amplifiers have not made a significant inroad to the RF frequency range, so active filters will not be treated here. However, active filter design is discussed by Chen [1]. Filters and impedance matching circuits are vital in the design of transistor amplifiers. The particular values of impedances needed for an amplifier depend on the device type and its orientation. Formulas for these impedances are summarized in Appendix D.
The solutions to the filter approximation problem and implementations that have arisen because of special requirements are treated in this chapter. The treatment is further limited to filters that perform certain tasks on continuous time varying analog signals by way of linear time-invariant circuit elements. Such filters are called analog filters. These analog filter functions are frequency selective circuits, and they can be analyzed in the time domain or in the frequency domain using Fourier transforms and Laplace transforms.
5.2IDEAL AND APPROXIMATE FILTER TYPES
The function of a filter is to separate different frequency components of the input signal that passes through the filter network. The characteristics of the network are specified by a transfer function, H jω or H s , where s D Cjω represents
84

IDEAL AND APPROXIMATE FILTER TYPES |
85 |
the complex frequency defined for the Laplace transform. The transfer function is the ratio of output signal to input signal, voltage, or current:
H jω D |
Vout |
5.1 |
|
Vin |
|
||
D jH jω jej ω |
5.2 |
||
The transfer phase function, ω , is related to the transfer group delay through a differential with respect to frequency as follows:
d ω |
5.3 |
d ω D dω |
For constant group delay, the phase function must be linear with frequency. In most filters only the magnitude of the transfer function is of interest. However, in modern-day systems using signals with complex modulation schemes, phase and group delay functions are also important.
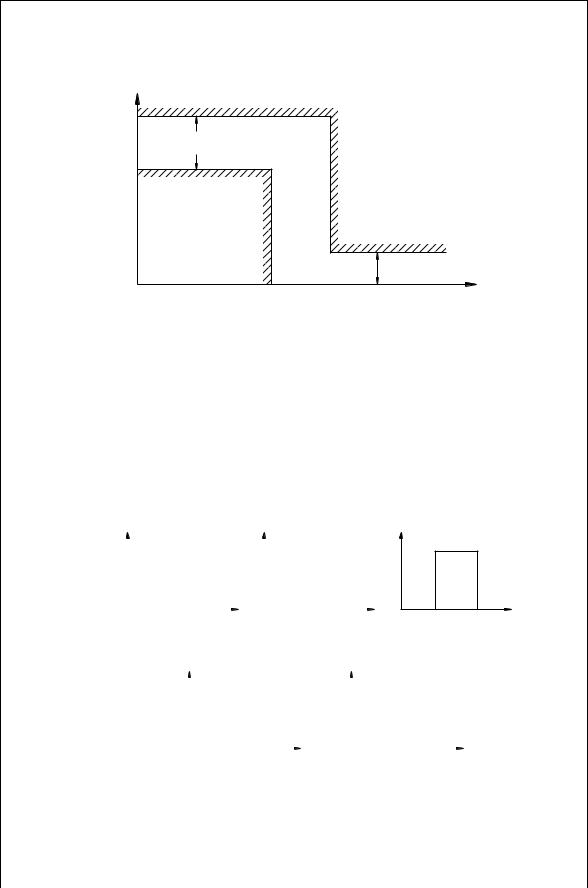
A filter network passes some of the input signal frequencies and stops others, and being a linear circuit, this function is performed without adding or generating new frequency components. The frequency band that passes, ideally without losses (0 dB insertion loss), defines the pass band, and the band that stops the frequencies, ideally with infinite loss, is called the stop band. Figure 5.1 shows this loss representation of the ideal low-pass filter. It is a low pass because it passes all low-frequency signals from dc to some high frequency, ωc and stops all signals above ωc. The frequency, ωc, is called the cutoff frequency of the filter. An ideal low-pass filter is physically not realizable as this requires a circuit with an infinite number of elements due to an abrupt change from pass band to stop band. Such a change is not practical.
This raises a practical issue of how does one specify the filters? The concept of the transition band, ωp to ωs, is the frequency range that separates the pass band and stop band where the loss transitions from a minimum to a maximum value. This is shown in Fig. 5.2. The ratio of ωs/ωp is sometimes referred to as filter selectivity, ratio, or filter steepness. As the selectivity approaches one,
|
|
|
|
|
|
|
0 |
|
|
|
|
|
|
|
|
Pass band |
|
|
Stop band |
|
Pass band |
|
|
Stop band |
|||
L, dB |
|
|
|
T, dB |
|
|
|
||||||
|
|
|
|
|
|
||||||||
|
|
|
|
|
|
|
|
|
|
|
|
||
0 |
|
|
|
|
|
|
|
|
|
|
|
|
|
|
|
ω p |
ω |
|
|
|
ωp |
ω |
|||||
0 |
|
|
|
|
|||||||||
|
|
(a) |
|
|
|
|
|
|
(b) |
|
|
||
FIGURE 5.1 Loss or attenuation characteristics of an ideal low-pass filter.
86 FILTER DESIGN AND APPROXIMATION
α max |
|
|
T, dB |
|
|
|
|
αmin |
|
ω p |
ω |
Pass band |
Transition |
Stop band |
|
band |
|
FIGURE 5.2 Method of specifying a practical low-pass filter.
the more complex and costly the filter becomes. Similar considerations can be applied in the design of filters using phase linearity and/or group delay flatness. The concept of pass band, stop band, and transition band permits specifications of five major types of filters: (1) low pass, (2) high pass, (3) band pass, (4) band stop, and (5) all pass. The transmission behavior of these filters is shown in Fig. 5.3.
H(jω) |
|
|
H(jω) |
|
|
H(jω) |
|||
|
|
||||||||
H0 |
|
|
|
H0 |
|
|
|
|
H0 |
|
|
|
|||||||
|
|
|
|
|
|
|
|
|
|
ω c |
ω |
ω c |
ω |
ω1 |
ω 2 ω |
|||||
Low Pass |
|
High Pass |
|
Band Pass |
||||||
H(jω) |
|
|
|
|
|
H(jω) |
|
|
|
|
|
|
|
|
|
|
|||||
H0 |
|
|
|
|
|
H0 |
|
|
|
|
|
|
|
|
|
|
|
|
|||
|
|
|
|
|
|
|
|
|
|
|
ω1 |
ω 2 ω |
ω |
Band Stop |
All Pass |
|
FIGURE 5.3 The five major filter types using transfer function amplitude response.

IDEAL AND APPROXIMATE FILTER TYPES |
87 |
5.2.1Low-Pass Filter
Low-pass filter networks are realized by using a cascade of series inductors and shunt capacitors. The number of these elements determines the steepness of the filter with the larger number resulting in a more complex and steep filter. The penalties are the complexity of the filter, the in-band loss, higher cost, and larger size. At low frequencies, series inductances produce low impedance, and shunt capacitors produce high impedance, thus allowing the signal to appear at the output of the filter. Above the cutoff frequency, the series inductors behave as large impedances and shunt capacitors as low impedances, thereby impeding the signal transfer to the load.
5.2.2High-Pass Filter
The high-pass filter shown in Fig. 5.3b allows signal frequencies higher than the cutoff frequency to pass through the filter to the load with a minimum loss and stops all frequencies below the cutoff frequency. This behavior is the reverse of the low-pass filter, and sometimes the high-pass filter is referred to as the complement of the low-pass filter. High-pass filter networks are realized by using a cascade of series capacitors and shunt inductors. Capacitors at high frequencies have low impedance, and inductors have high impedance. Thus the high-frequency signal passes through the filter to the output load with a minimum loss. Just the opposite happens at low frequencies, resulting in a high attenuation of the low frequencies.
5.2.3Band-Pass Filter
The band-pass filter shown in Fig. 5.3c shows the signal is transferred to the load in a band of frequencies between the lower cutoff frequency, ωc1, and the upper cutoff frequency, ωc2. Between the lower and upper cutoff frequency is the center frequency, ω, defined by the geometric mean of ωc1 and ωc2.
5.2.4Band-Stop Filter
The band-stop filter is a complement of the band-pass filter and is shown in Fig. 5.3d. The signal in a band-stop filter is transferred to the load in two frequency bands, one from a low frequency to a low cutoff frequency, ωc, and the other from the upper cutoff frequency, ωc2, to infinite frequency. The signal experiences high loss between ωc1 to ωc2, hence the name band stop or band reject.
5.2.5All-Pass Filter
The all-pass filter allows the signal amplitude for all frequencies to pass through the network without any significant loss (Fig. 5.3e). This network has no frequency selective pass band or stop band. The transmitted signal ideally experiences a linear phase shift or constant group delay with frequency.

88 FILTER DESIGN AND APPROXIMATION
Unfortunately, minimum phase networks do not have constant group delay: rather there are peaks near the corner frequency. All passive ladder networks, such as filters that have frequency selectivity, are minimum phase. In the design there is a trade-off between flat group delay and filter selectivity. However, a network that is nonminimum phase can be cascaded with a minimum phase network to achieve both flat group delay and selectivity. All pass networks with nonminimum phase are used as group delay compensation devices.
5.3TRANSFER FUNCTION AND BASIC FILTER CONCEPTS
Before proceeding with the design of filters, it is important to understand the transfer function in the complex frequency domain, s D C jω. The transfer function can easily be transformed from the time to the frequency domain when losses are small so that D 0 and s D jω. As described in Section 5.2, the filter transfer function is the ratio of the output signal voltage to the input signal voltage. One could also easily select the ratio of currents. The transfer function, in general, can be written as a ratio of two polynomials:
H s |
|
P s |
a0 C a1s C a2s2 C Ð Ð Ð C am 1sm |
5.4 |
|
D Q s D b0 C b1s C b2s2 C Ð Ð Ð C bn 1sn |
|||||
|
|
||||
where polynomials P s and Q s in general are of order m and n. These polynomials are Hurwitz stable, which requires that the order of the numerator polynomial m be equal to or less than the denominator polynomial n, m < n. The order of polynomial Q s is the order of the filter as well. Polynomials P s and Q s can be factored and rewritten in the form
H s |
|
s z1 s z2 s z3 . . . s zm |
5.5 |
|
D s p1 s p2 s p3 . . . s pn |
||||
|
|
|||
The values z1, z2, z3, . . . , zm, are called the zeros of the transfer function, or simply transmission zeros. The roots of Q s , p1, p2, p3, . . . , pn, are the poles of the transfer function. The poles and zeros can be real or complex, but complex poles and zeros must occur in conjugate pairs. That is, if 2 C j3 is a pole, then2 j3 must be a pole as well. The magnitude plot of voltage transfer function represents the loss or attenuation of the filter circuit, and in dB is given by
LdB D 20 log jH s j |
5.6 |
Poles and zeros of realizable passive networks must follow certain rules:
1.All poles of a transfer function occur in the left half s-plane. The left half s-plane includes the imaginary jω-axis.
2.Complex poles and zeros occur in complex conjugate pairs. However, on the imaginary axis, poles and zeros may exist singly.

LADDER NETWORK FILTERS |
89 |
5.4LADDER NETWORK FILTERS
The class of minimum phase filters are those filters in which the zeros of the impedance function are chosen to be in the left half-plane. This is a way of saying that the topology of a low-pass filter is a ladder network. The filter is assumed to be lossless and terminated on each side by a real resistance. As indicated in Fig. 5.4, there are four possible choices for the first and last reactive elements. The final reactive element depends on whether the number of elements is even or odd. The basic procedure is to develop a design for a low-pass filter whose terminating resistors are 1 and whose cutoff frequency is ωc D 1 rad/s. Once this normalized low-pass filter is designed, the impedance level is adjusted to the desired value, the cutoff frequency is adjusted, and circuit topology is transformed to a high-pass, band-pass, or band-stop filter as desired.
The notation for the low-pass filter prototype filter with g values, shown in Fig. 5.4, is widely used. In this way convenient recursion formulas can be used for finding the filter values. A g beside an inductor stands for inductance, a g beside a capacitor stands for capacitance, and a g beside a resistor stands for resistance. For the normalized prototype circuit, g0 D 1.
5.4.1The Butterworth Filter
The transducer power gain for a two port circuit is
power delivered to the load |
5.7 |
GT D power available from the source |
which for a passive filter is a quantity 1. A filter with many reactive elements would be expected to more closely approximate an ideal filter with rectangular shape (infinitely steep band edge skirts and flat-pass band) than one with few reactive elements. For a filter with n poles (n reactive elements), the low-pass Butterworth approximation provides the maximum flatness in its pass band near
|
|
g2 |
|
gn |
or |
|
g0 |
g1 |
g3 |
. . . |
|
gn+1 |
gn gn+1 |
|
|
|||||
g1 |
|
g3 |
|
|
or |
gn |
g0 |
g2 |
g4 |
. . . |
gn |
gn+1 |
gn+1 |
|
FIGURE 5.4 The lumped element prototype low-pass filter.