


Monitoring
This chapter will highlight the following tools that exist to help you monitor the traffic in SignalR:
•Using Fiddler
•Enabling performance counters
At this stage, the developer should be capable of monitoring their SignalR-enabled apps and see the traffic more easily.
Looking under the covers with monitoring
Anyone who has been in the software industry more than 15 minutes knows that things don't necessarily go the way one plans out, or things don't work exactly how one thinks. Sometimes we need to attach a debugger or monitoring tool of some kind to figure out what is going on.
Fiddler
A popular, free, and very good tool for debugging HTTP traffic is Fiddler. You can download it for free from http://fiddler2.com. It gives you the opportunity to monitor all HTTP requests happening on your computer.
www.it-ebooks.info

Monitoring
The following list gives a small review of Fiddler:
1.Fiddler sets itself as a proxy for all traffic, and in order to get the best experience from it you need to enable streams, otherwise SignalR will fall back to long-polling, but not immediately—typically after three-five seconds:
2.If the browser and server support web sockets, SignalR might choose to use them as its preferred transport. In this case, you want to open the Log tab:
[ 84 ]
www.it-ebooks.info

Chapter 8
Performance counters
Monitoring messages on a higher level to see the throughput of your application, number of failing messages, and such is vital when putting a system into production.
SignalR has a utilities project that gives you performance counters that can be installed on the server(s) that host your application, as follows:
1.The utility is available through NuGet as a package. So right-click on the references of any of the projects and select Manage NuGet packages, find the package called Microsoft ASP.NET SignalR Utilities and install it:
In order to install the performance counters, we need to open a command prompt in Administrator mode.
2.Navigate to the path of your solution; inside it you should find a folder called packages, and inside it a folder called Microsoft.AspNet.SignalR. Utils.1.0.0.1 or similar, depending on the version you installed; within this you'll find a folder called tools.
[ 85 ]
www.it-ebooks.info

Monitoring
3.Now that you've navigated through all of these, enter signalr ipc and press Enter. This will install all the performance counters:
4.To see the performance counters, we need to open perfmon (Start | Run or for Windows 8 press WinKey+R) and type perfmon and press Enter:
[ 86 ]
www.it-ebooks.info

Chapter 8
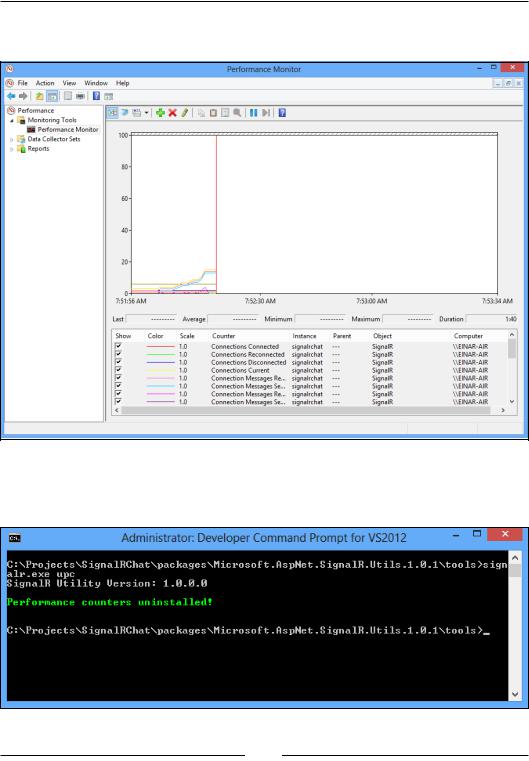
5.Inside perfmon you can expand the monitoring tools and click on the Performance Monitor node and you should see a graph. Click on the big + button at the top so that you can add the SignalR counters you want to look at. If you have your application running, you should see it in the Instances of selected object filter list:
[ 87 ]
www.it-ebooks.info
Monitoring
6.Once added, you can try out the app by sending messages and see the result in the graph.
7.After putting your solution into production, you might want to consider disabling any performance counters enabled on your server by entering signalr upc in the console:
[ 88 ]
www.it-ebooks.info