

Beginning JavaScript With DOM Scripting And Ajax - From Novice To Professional (2006)
.pdf456 |
A P P E N D I X ■ D E B U G G I N G J A V A S C R I P T |
The previously missing curly brace is shown in bold (following the “is in the range” alert() message).
Not closing or closing too many parentheses is another common problem. This happens when you nest functions in if() conditions and later on delete some of them. For example:
if (all = parseInt(getTotal()){ doStuff(); }
This causes an error, as you forgot to close the parentheses of the condition itself.
if (all = parseInt(getTotal())){ ... }
It can also happen when you nest too many methods and returns:
var elm=grab(get(file).match(/<id>(\w+)<\/id>/)[1];
This one lacks the closing parentheses after the [1]:
var elm=grab(get(file).match(/<id>(\w+)<\/id>/)[1]);
In general, this kind of concatenation of functions is not good coding style, but there are situations where you will encounter examples like this one. The trick is to count the opening and the closing parentheses from left to right—good editors also highlight opening and closing parentheses automatically.
You could also write a utility function to do this for you, which in itself is a test of your attention to detail when it comes to coding syntax:
exampleTestingCodeLine.html
function testCodeLine( c ) {
if( c.match( /\(/g ).length != c.match( /\)/g) .length ) {
alert( 'closing ) missing' );
}
}
c = "var elm=grab(get('demo.xml')" + ".match( /<id>(\w+)<\/id>/ )[1] );";
testCodeLine( c );
Concatenation Gone Wrong
Concatenation is happening a lot when you use JavaScript to output HTML. Make sure that you don’t forget the + signs in between the different parts to concatenate to a whole.
father = "Peter"; mother = "Lois"; child = "Chris";
family = father+" "+mother+" "child;

A P P E N D I X ■ D E B U G G I N G J A V A S C R I P T |
457 |
The preceding lacks one addition sign before the child variable:
father = "Peter"; mother = "Lois"; child = "Chris";
family = father+" "+mother+" "+child;
Another obstacle is to make sure you don’t concatenate the wrong data types.
father = "Peter"; fAge = 40;
mother = "Lois"; mAge = 38;
child = "Chris"; cAge = 12;
family = father + ", " + mother +
" and " + child + " Total Age: " + fAge + mAge + cAge;
alert( family );
This will not show the desired result, but this instead:
Peter, Lois and Chris Total Age: 403812
The mistake is that you concatenate strings and numbers as the + operator works from left to right. You need to add parentheses around the age term:
father = "Peter"; fAge = 40;
mother = "Lois"; mAge = 38;
child = "Chris"; cAge = 12;
family = father + ", " + mother +
" and " + child + " Total Age: " + (fAge + mAge + cAge);
alert(family);
This results in the desired outcome:
Peter, Lois and Chris Total Age: 90
458 |
A P P E N D I X ■ D E B U G G I N G J A V A S C R I P T |
Assigning Instead of Testing the Value of a Variable
When testing the value of a variable, it is all too easy to assign it instead of testing it: all you need to do is forget an equal sign.
if(Stewie = "talking") { Brian.hear();
}
This will entice Brian to hear all the time, not only when Stewie has something to say; however, adding one equal sign does make Brian hear only when Stewie talks:
if(Stewie == "talking") { Brian.hear();
}
Tracing Errors with alert() and “Console” Elements
The easiest way to trace errors is to use alert() wherever you want to test a certain value. The alert() method will stop the script execution (with the exception of Ajax calls that might still be going on in the background) and provide you with information about the value of a certain variable, and you can deduce if that value is correct or if it is the cause of the error. In some instances, using an alert() is not the right option, for example, if you want to trace the change of several values while looping through an array. Depending on the size of the array, this can become tedious, as you need to press Enter every time you want to get rid of the alert() and commence to the next array item. A workaround for this problem is coming up with your own debugging console or logging elements. Most JavaScript libraries come with a logging sublibrary (DOJO has dojo.logging, at http://manual.dojotoolkit.org/index.html#infrastructure; Mochikit has Logging, at http://mochikit.com/doc/html/MochiKit/Logging.html), and the DOMhelp library we put together in this book is no exception. You can use the initDebug(), setDebug(), and stopDebug() methods to simulate a debugging console. Simply add a style for the element with the ID DOMhelpdebug and use the methods to show the element and write content to it. For example:
exampleDebugTest.html (excerpt)
#DOMhelpdebug{
position:absolute;
top:0;
right:0;
width:300px;
height:200px;
overflow:scroll;
background:#000;
color:#0F9; white-space:pre;
font-family:courier,monospace;
A P P E N D I X ■ D E B U G G I N G J A V A S C R I P T |
459 |
padding:1em;
}
html>body #DOMhelpdebug{ position:fixed; min-height:200px; height:200px; overflow:auto;
}
exampleDebugTest.html (excerpt)
<script type="text/javascript" src="../DOMhelp.js"></script> <script type="text/javascript">
function DOMDebugTest(){ DOMhelp.initDebug();
for(var i = 0; i < 300; i++ ) {
DOMhelp.setDebug( i + ' : ' + ( i % 3 == 0 ) + '\n' );
}
}
DOMhelp.addEvent( window, 'load', DOMDebugTest, false ); </script>
This example loops through the numbers 0 to 299 and displays whether the number can be divided by 3 without resulting in a floating point number. Instead of hitting Enter 300 times, all you need to do to see the results is to scroll in the “console window” you created with the earlier styles.
Error Handling with try and catch()
You can test scripts using the try ... catch construct. Simply add the code you want to test inside a try condition and if there is an error, the code inside catch() will be executed. For example:
exampleTryCatch.js
try{
alert( 'this is a code example' ); alert( myVariable );
}catch( exceptionObject ) { // Predefine empty output var errorString = '';
for( i in exceptionObject ) {
errorString += i + ':' + exceptionObject[i] + '\n';
}
alert( errorString );
}

460 |
A P P E N D I X ■ D E B U G G I N G J A V A S C R I P T |
The catch() method retrieves an Exception object as a parameter when an error occurs inside the try statement. You can give this object any variable name; in this example we call it exceptionObject. Depending on the error and the browser, this object will have different properties, and the properties that are the same across browsers will have different values. On MSIE 6 on Windows XP, the preceding code shows the bug—which is the second alert() trying to display an undefined variable—the following way:
name:TypeError message:'myVariable' is undefined number:-2146823279
description:'myVariable' is undefined
On Firefox 1.5.0.3 on Windows XP:
message:myVariable is not defined fileName:file:///c:/exampleTryCatch.html lineNumber:11 stack:@file:///c:/exampleTryCatch.html:11 name:ReferenceError
On Opera 8.54 on Windows XP:
message:Statement on line 4: Reference to undefined variable: myVariable Backtrace:
Line 4 of inline#1 script in file://localhost/C:/exampleTryCatch.html alert(myVariable);
opera#sourceloc:4
If you try a different error, you will get the same properties, but different values. Let’s try to call a function that doesn’t exist by misspelling alert().

A P P E N D I X ■ D E B U G G I N G J A V A S C R I P T |
461 |
exampleTryCatchTypo.js
try{
allert( 'this is a code example' );
}
catch( exceptionObject ) { var errorString = '';
for( i in exceptionObject ) {
errorString += i + ':' + exceptionObject[i] + '\n';
}
alert( errorString );
}
The results on MSIE 6 are the following:
name:TypeError message:Object expected number:-2146823281 description:Object expected
On Firefox 1.5.0.3:
message:allert is not defined fileName:file:///c:/exampleTryCatchTypo.html lineNumber:10 stack:@file:///c:/exampleTryCatchTypo.html:10 name:ReferenceError
On Opera 8.54:
message:Statement on line 3: Reference to undefined variable: allert Backtrace:
Line 3 of inline#1 script in file://localhost/C://exampleTryCatchTypo.html allert("this is a code example"); opera#sourceloc:3

462 |
A P P E N D I X ■ D E B U G G I N G J A V A S C R I P T |
Using try and catch in a debugging process can be very helpful, and depending on the browser, you can easily spot the problem.
■Note Notice that Opera reports the line number of the code inside the SCRIPT element, while Firefox reports the line number of the whole HTML document. MSIE leaves you in suspense where the error might have occurred when using try and catch().
However, as the construct in itself is JavaScript, you cannot debug JavaScript syntax errors with it:
exampleTryCatchFailing.js
try{
alert( 'this is a code example' ) );
}catch( exceptionObject ) { var errorString = '';
for( i in exceptionObject ) {
errorString += i + ':' + exceptionObject[i] + '\n';
}
alert( errorString );
}
The extra closing parenthesis after the first alert() is a syntax error that will cause the browser to show its built-in error messaging and stop the script from executing instead of executing the code inside the catch construct.
Sequential Uncommenting
Another very easy way to trace an error is to comment out the whole script and uncomment it function by function or—if it is a single function—line by line. Test the script every time you uncomment a line by reloading it in a browser, and you will quickly get to the one that causes the error. This can take time though, and it would be much easier to know roughly where the error occurs, which is why you need to rely on your browser to give you this information.
A P P E N D I X ■ D E B U G G I N G J A V A S C R I P T |
463 |
Error Reporting in Browsers
Browsers help you to different degrees to debug your code. Following is a roundup of different browsers and their means of displaying errors and locating their origin. As I wanted to give an overview of different browsers you can use, I will not go into much further detail about the different add-ons for each of them. Instead, I will provide you with some information and URLs where to get these add-ons and to read their documentation for yourself. The reason for this is not laziness on my behalf, but the fact that the number of browser add-ons and debugging tools for JavaScript increased a lot in the last year, with the advent of Ajax making JavaScript interesting again to a broader audience. Therefore, detailed explanations of a certain tool might be outdated once this book hits the shops.
Microsoft Internet Explorer 6
MSIE6 is probably still the most common browser on Windows these days. If you’re a developer, though, it doesn’t help you much—most of the time it throws errors other browsers don’t.
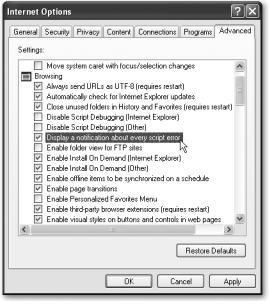
Older versions of MSIE (4 and 5 on PC) showed a report window every time a JavaScript error occurred. This feature has been turned off in newer versions; you can turn it back on in the Browsing section of the Advanced tab under Tools Internet Options as shown in Figure A-4.
Figure A-4. Turning on error reporting in Microsoft Internet Explorer
464 |
A P P E N D I X ■ D E B U G G I N G J A V A S C R I P T |
As the error messages provided by MSIE can be rather cryptic, like “Object does not support this method or property,” and if MSIE is your only option for development, you might want to download the free Microsoft script debugger at http://www.microsoft.com/downloads/ details.aspx?familyid=2F465BE0-94FD-4569-B3C4-DFFDF19CCD99&displaylang=en. The Microsoft Script Debugger is a debugging suite that allows you to set break points that stop the script execution until you tell it to go on. You can also use it to read the values of variables and change them while the script is running. All of this works outside the browser, which means you don’t need to resort to the tricks mentioned earlier like alert(), own debugging consoles, or sequentially comment out of parts of code. An introduction to the Microsoft Script Debugger is available at http://msdn.microsoft.com/library/default.asp?url=/library/en-us/ sdbug/Html/sdbug_1.asp.
Safari
Apple’s flagship browser seemingly does not help you at all with JavaScript debugging. I said “seemingly” because there is a debugging menu in Safari that is very handy; the only problem is that it is hidden by default.
Enabling the debugging menu can be done in two ways: either via the command line or by installing the Safari enhancer. The command-line solution is pretty straightforward.
1.Close Safari.
2.Enter % defaults write com.apple.Safari IncludeDebugMenu 1 in the Operating System console (Applications Utilities Console) and hit Enter.
3.Restart Safari.
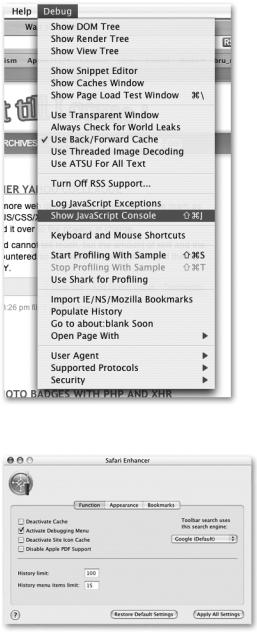
You’ll see that you have a new Debug menu option in the top menubar as shown in Figure A-5. Among many other useful features like a DOM tree viewer and the chance to simulate other browsers for web sites that block out Safari, you have the options either to log JavaScript errors to the OS console or to show errors in a JavaScript console window.
If you prefer a graphical user interface to change Safari, download the Safari enhancer shown in Figure A-6 at http://www.versiontracker.com/dyn/moreinfo/macosx/17776 and tick the box that states Activate Debugging Menu before pressing the Apply All Settings button.
A P P E N D I X ■ D E B U G G I N G J A V A S C R I P T |
465 |
Figure A-5. The debugging menu of Safari
Figure A-6. Enabling the debugging menu with Safari Enhancer