

Semicond. Sci. Technol. 27 (2012) 053001 |
Topical Review |
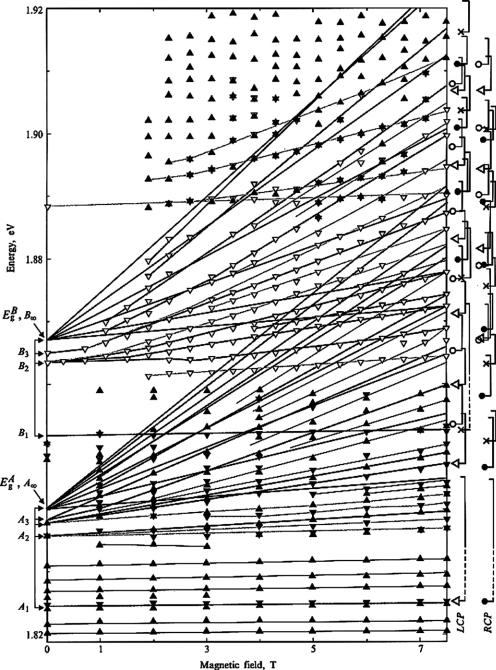
Figure 12. Fan charts for the DE series A and B in a hexagonal CdSe crystal. A vertical scale on the right shows an interpretation of transitions in the quasi-cubic approximation. Designations are analogous to those for cubic GaAs crystals, see figure 8.
8. Observation of the diamagnetic-exciton spectra in semiconductor solid solutions
The magnetic-field growth contributes to the formation of exciton states until there occur potential wells able to capture electrons and holes separately, which destroys the exciton. Such a role could be played, for example, by a defect potential or by potential fluctuations in either solid solutions or doped semiconductors.
We have investigated the formation of the DE spectra in semiconductor solid solutions and carried out the first
observation of the DE spectra in semiconductor compounds
InGaAs [33] (see figure 21) and HgCdTe (1989–93) [34]
as well as in AlGaAs [35] (2004–2008). These experiments
allowed us to observe the DE extended spectra, which creates
a possibility of accurate determination of band parameters for
a given composition.
However, further magnetic-field increase leads to the
broadening of the DE lines and, finally, to presumable
destruction of the spectrum (see figure 22).
9
Semicond. Sci. Technol. 27 (2012) 053001 |
Topical Review |
Figure 13. The Wannier–Mott exciton registration in indium antimonide. Magnetic-field-induced flare-up of exciton-absorption maximum: (I) before annealing, for different magnetic fields
((1) B = 0; (2) B = 5 mT; (3) B = 9 mT; (4) B = 12.5 mT); (II) after annealing, no magnetic field, T = 2 K, p = 6 × 1012 cm−3,
d = 13 μm. I and II are separated simply to aid the eye.
Figure 14. Flare-up of the exciton ground state in Cd0.3Hg0.7Te under magnetic field.
9. Development of the diamagnetic-exciton concept and its application to a broad range of semiconductor crystals
We have used the DE concept in a wide range of semiconductor crystals. Among the experimentally studied crystals, there were more than 15 semiconductors including compounds most attractive from the standpoint of practical applications. Figure 23 presents a chart of substances, that shows their positions on the scale of energy gaps. The values of the parameters β and magnetic fields needed to meet the criterion β = 1 are also indicated. The observed pattern appeared to depend to a great extent on the initial spectrum of the Wannier– Mott exciton (or lack thereof). Possible variants of initial
Figure 15. One-dimensional series of diamagnetic exciton in InSb. Line shapes of the first OMA maxima in the σ − spectrum in InSb at 2 K, B = 3.87 T. Bottom: theoretical positions of the maxima for the DE series originating from the transitions: (I) a+(−1)ac(0), (II) b+(−1)bc(0), including dissociation edges.
Figure 16. The appearance of fine structure against the background of the continuum of the DE states in InSb at more high magnetic field.
spectra for various typical cases are also shown in figure 23. A suitable method to calculate the accurate parameters of the crystal band structure was developed in all of these cases. Both the approximate interpretation of the spectra and the bindingenergy calculation for each DE state were the common part of the methods. This has allowed us to find out the energy of transitions between the hidden Landau subbands [11, 36].
Several methods of calculating the band parameters from the DE spectra were developed. The comparison of transitions in the rightand left-circular polarizations is one of the simplest and most convenient methods. It is based on the difference in the corresponding selection rules for transitions ( l = + 1) and ( l = −1) where l is the Landau quantum number. Subtracting the transition energies from each other, one can find the sum of two adjacent cyclotron energies for
10

Semicond. Sci. Technol. 27 (2012) 053001 |
Topical Review |
Figure 17. Diamagnetic exciton spectra in InSb for principal orientations of crystallographic axes relative to magnetic field, T = 1.8 K. Transitions involved: (I) a+(l)ac(l ± 1); (II) b+(l)bc(l ± 1); (III) a−(l)ac(l ± 1); (IV) b−(l)bc(l ± 1). The theoretical spectra include the binding energy of the DE ground state (ν = 0). The maxima corresponding to DE excited states are specified by arrows. The additional transitions appearing in the B//[1 1 1] orientation are indicated by dashed arrows.
electrons and light and heavy holes (see figures 24 and 25). A more fundamental though laborious method implies the creation of an optimizing program, which would compare a full set of experimental data with the calculated spectrum constructed with varied parameters. Figure 26 illustrates the results obtained with the use of such a program. Here, absolute minima of standard deviations for each of the varied parameters are well monitored. The method sensitivity is high and allows us to determine not only the parameters evidently
involved in the formation of the spectrum of transitions between Landau subbands but also the permittivity controlling the DE binding energy. In doing this, an optimization graph can be constructed for each of the optimizing parameters apart. The latter can make evident the possible error for each determined value.
A substantial portion of these experimental and theoretical studies has been described in two books [11, 36]. In the latter there is a chapter entitled ‘Interband magneto-optics
11

Semicond. Sci. Technol. 27 (2012) 053001 |
Topical Review |
Figure 18. Oscillatory magnetoabsorption in heteroepitaxial films of PbTe/BaF2. B//[1 1 1], T = 2 K. Bottom: the theoretical spectrum calculated for the heavy-mass (o) and light-mass ( ) series. Inset: reciprocal transmission versus E0 [32]. Numeration gives serial numbers of spectral lines.
(a)
(b)
(c )
(d )
Figure 19. Differential electroabsorption in PbTe/BaF2 for E0 < E0 and E0 > E0 plotted against a magnetic field B//[1 1 1].
λ = 3.39 μm, T = 2 K, E1 = 0.2 V cm−1. Values of E0:
(a) 3 V cm−1, (b) 10 V cm−1. Extremum notation: ‘l’ and ‘h’ denote the lightand heavy-mass series, the number specifying the Landau quantum number for l = 0 selection rules. Inset on the right compares, on an enlarged scale, fragments of the electroabsorption spectrum with the OMA spectrum for E = 0 near the extremum to explain the experimental evaluation of RB. Inset on the left presents magnetic-field dependence of (c) exciton Rydberg and (d) E0 [32].
of semiconductors as diamagnetic exciton spectroscopy’. Mainly, these books covered the results of earlier DE studies included in the doctoral R P Seisyan’s thesis, ‘Spectroscopy of diamagnetic excitons’, 1978. They did not include research into low-dimensional systems carried out later. Among them, there are, first of all, studies of quantum wells and, further, of the exciton polariton.
Figure 20. Shape of the dependence of differential signal on electric field E0 at the extremum of the OMA spectrum. The inset presents a fragment of this dependence on the form of ln( I /E0m) plotted
against E0−2 for m = −3/2. (Light-mass extrema, with Bmax = 5.2 T, 1, 2 and 3 stand for different samples) and the same for Bmax = 4.26 T (4 and 5 identify different samples). The calculated
values of E0 obtained from the slopes of the straight lines are: 1,2,3–0.5 V cm−1; 4–6.2 V cm−1; 5–5.8 V cm−1 [32].
Figure 21. The spectrum of the diamagnetic excitons in InxGa1-xAs solid solution (x = 0.53) epitaxially grown on InP substrates. B = 7.5 T, T = 2 K, free samples. Markings are analogous to those for cubic GaAs crystals, see figure 8.
12

Semicond. Sci. Technol. 27 (2012) 053001 |
Topical Review |
Figure 22. The dependence of the linewidth and oscillator strength
of the diamagnetic excitons in In0.53Ga0.47As on the magnetic field. T = 2 K, free sample. The dashed fragment is given simply to aid
the eye. Magnetic field dependence of the oscillator strength
f (B) (B)αmax (B): (1) σ + spectrum, a− (1)ac (0) and b− (1)bc (0) transitions, (2) σ − spectrum, a+ (−1)ac (0) and b+ (−1)bc (0) transitions. The dashed lines show contribution of magnetic (spin) line splitting not resolved experimentally.
Figure 23. Scheme of the fulfilled DE researches in semiconductor crystals. The bottom shows the typical absorption edges prior to magnetic-field application. The upper arrow shows the forbidden-gap range of used crystals, Eg (eV). The β values increasing from left to the right are given underneath at B = 10 T. The last arrow shows the magnetic fields necessary to achieve β = 1.
10. Quantum-well magneto-optics (diamagnetic exciton in a quantum well)
We have carried out one of the first observations of the OMA in GaAs/AlGaAs quantum wells [37]. To analyse magnetooptical spectra, a theory of DE in a quantum well was proposed. It allowed us to calculate the binding energies of the DEs related to various Landau numbers at different sizequantization levels [38] (see figure 27). We used both this theory and the corresponding technique in all subsequent works where the 2D-state magneto-optical effects appeared in one or another way. Making use of the binding energies, one can restore the positions of the Landau levels. In doing this, one can determine the reduced effective mass of excitons involved in the quantum-well optical absorption. The exact value of the initial energy of a size-quantization level (see figure 27) can be also found out. Besides, we have studied some new specific magneto-optical effects of low-dimensional states. Let us dwell on ‘the Coulomb-well effect’, the magneto-optics
Figure 24. The method of calculating the parameters of the band structure of semiconductors, which uses a comparison of DE spectra in rightand left-circular polarizations. InP crystals at T = 2 K, B = 7.5 T, the Faraday geometry. The straight lines are least-squares fits.
13