

Semicond. Sci. Technol. 27 (2012) 053001 |
Topical Review |
(a)
(b)
(c)
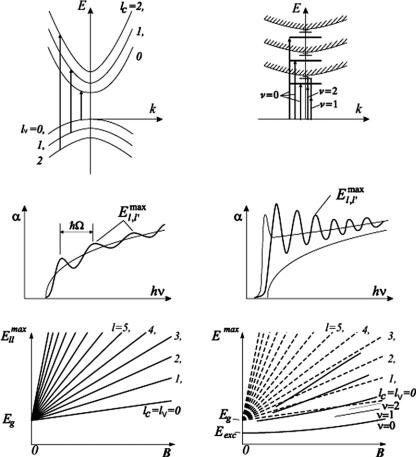
Figure 5. Diamagnetic exciton and transitions between Landau subbands: (a) optical transitions between Landau subbands (left) and between diamagnetic-exciton states with different Landau numbers (right); (b) absorption coefficients; (c) ‘Fan charts’ for transitions between Landau subbands (left) and for the diamagnetic excitons (right), dashed lines are for transitions between Landau subbands.
(see figure 7). The GaAs DE spectra already obtained by us in 1973 had a very unusual view and consisted of many narrow lines. These lines resembled by the structure rather atomic absorption spectra than the ‘classical’ OMA, i.e. oscillating magnetoabsorption. We observed ‘lengthy’ series for the first time in GaAs (1971–1972) [13, 14]. In addition, figure 8 shows a quantitative GaAs DE spectrum, namely the absorptioncoefficient spectrum, measured later [16]. We have carried out similar experiments in InP (1982) [17], in CdTe (1988) [18], and also in ZnTe and ZnSe [19–21]. Let us besides emphasize the InP experiments [22] demonstrating both a row of the DE series and a very sharp transition from the lowto the high-field mode (see figure 9).
of Rydberg atoms are to be naturally considered with the aim of applying the results to the analogue of the hydrogen atom in semiconductors, i.e. to the Wannier–Mott exciton. Table 1 compares the hydrogen excited-state properties and those of an exciton in a typical semiconductor compound of A3B5 type, namely in indium phosphide, InP [22].
We can see that the InP excitons with principal quantum numbers n0 = 3–4 correspond to the excited hydrogen-atom orbits with principal quantum numbers n0 of an order of 30. It is so due to both the high permittivity ε0 and low reduced effective mass μ. In relation to the Rydberg states of excitons in semiconductors, this allows us to propose the following modification of the Elliott–Loudon criterion:
β n02 1, |
(3) |
5. Developing the concept of Quasi-Landau magnetoabsorption by the exciton ‘Rydberg’ states in semiconductors: InP, GaAs and CdTe (years 1990–94)
As is well known, the studies of the behaviours of highly excited states of atoms and molecules have formed the basis of a new physics field. It played a prominent role in the development of the interstellar-matter physics and was named ‘Rydberg States of Atoms and Molecules’ [23]. The properties
which implies that the high-field mode for the excited states can be achieved in the magnetic field n02 times lower. When this condition is fulfilled, the corresponding magnetic-field dependences of the absorption-maximum positions will be linear (as for the Landau levels). If not, in the fields below critical (β n02 = 1), the dependences are approximately quadratic in accordance with the diamagnetic shift in semiconductor crystals. Figure 10 demonstrates this fact well for InP taken as an example [22]. The same situation takes place for GaAs, CdTe and a number of other semiconductor
5
Semicond. Sci. Technol. 27 (2012) 053001 |
Topical Review |
Table 1. Comparison of parameters of the ground and excited states of hydrogen atom and those of the Wannier–Mott exciton in InP.
|
|
|
|
|
|
|
|
|
Hydrogen atom |
|
|
|
|
Semiconductor |
|
||
|
|
|
|
|
|
|
|
|
|
|
|||||||
Parameter |
|
Dependence on n0 |
Measure unit |
n0 = 1 |
n0 = 30 |
|
Coefficient |
n0 = 1 |
n0 = 2 |
n0 = 3 |
|||||||
<r>, a |
|
|
a0n02 |
|
|
10−8 |
cm |
0.53 |
480 |
|
|
ε0 /μ |
106 |
424 |
954 |
||
τ |
|
|
τ 0n03 |
|
|
10−12s |
10−4 |
4.1 |
|
|
ε02 / μ |
0.2 |
1.6 |
5.4 |
|||
Ry |
|
|
Ry /n02 |
|
10−3 |
eV |
13 600 |
15 |
|
|
μ / ε02 |
6.8 |
1.7 |
0.8 |
|||
E ( n |
0 = |
1) |
2Ry n |
n −3 |
10−3 |
eV |
10 000 |
1 |
|
|
μ /ε 2 |
5.0 |
0.6 |
0.2 |
|||
2 |
|
2 |
n0− |
20 |
0 |
T |
|
5 |
2.7 · 10 |
2 |
2 |
0 2 |
6.25 |
1.56 |
0.69 |
||
B (βn0 |
= 1) |
a0− |
|
|
|
2.5 · 10 |
|
|
μ |
/ ε0 |
|||||||
(a)
(b)
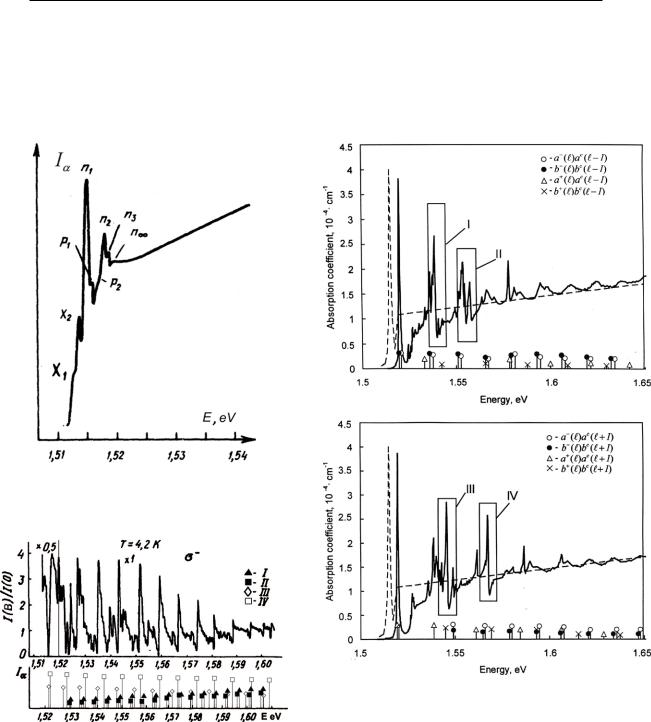
Figure 6. The spectrum of the absorption edge of GaAs crystals at T = 1.7 K (a ‘lengthy’ series, which includes the states with n0 = 1, 2, and 3). X1,2—exciton-impurity-complex (EIC) transitions, p1,2—EIC first excited states.
Figure 7. The first observation of diamagnetic excitons in GaAs with fine multiple-line structure (1972–1973). Note the form characteristic of the Fano effect. T = 4.2 K, B = 2.5 T. Transitions in the Faraday geometry: I—a−ac, II—b−bc, III—a+ac, IV—b+bc.
crystals. Figure 11 presents fragments of the InP absorption spectrum [22], which show DE series including a number of quasi-1D excited states.
6. Diamagnetic excitons in hexagonal crystals
The overwhelming majority of the DE studies had been performed in diamond-like semiconductors. For them, the
Figure 8. The absorption coefficient in GaAs under a high magnetic field: (a) σ + spectrum, (b) σ − spectrum. The Faraday geometry,
T = 1.7 K. The dashed line corresponds to B = 0. Spectral fragments characteristic of the Fano effect are shown in the frames. Bottom: theoretical spectra, right top: transition notations.
theory of the spectra of transitions between the Landau subbands (they form the basis of the DE spectra) was formulated long ago, as far back as 1966 (Pigeon and Brown [24]). In recent years, the role of hexagonal-type GaN crystals significantly increased. That is why we had constructed a theory of the spectra of transitions between the Landau subbands for hexagonal semiconductors too [25]. This allowed us to further develop the quasi-cubic approximation
6
Semicond. Sci. Technol. 27 (2012) 053001 |
Topical Review |
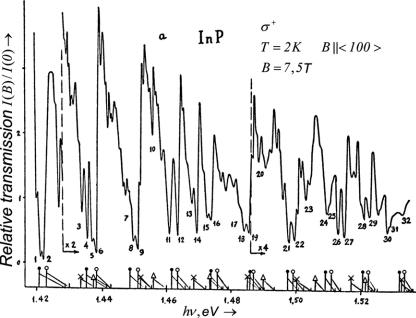
Figure 9. Diamagnetic exciton in indium phosphide. The Faraday geometry, T = 2 K, B = 7.5 T, σ + polarization. Bottom: DE theoretical spectrum, DE binding energies being marked. Dissociation edges are shown by short vertical lines connected with DE ground states by declined lines. Symbols designating DE ground states are the same as in figure 8.
for hexagonal crystals, which is suitable for the analysis of their magneto-optical spectra and calculations of key band-structure parameters [26]. Figure 12 shows a fan diagram typical for the hexagonal A2B6 crystals. In the case of CdSe, it consists of two ‘fans’ separated by the value of the crystal splitting of the valence band.
7. The first observations of excitons in narrow-gap semiconductors: InSb, InAs, HgCdTe (1979–83) and diamagnetic excitons in narrow-gap (gapless) semiconductors
Prior to the 1980s, the exciton absorption in narrow-gap semiconductors was not observed. It seemed to be natural because of microscopic exciton binding energy predicted theoretically in such crystals. For example, it would be merely 0.5 meV in InSb. Nevertheless, InSb was one of the first objects where the OMA with typical DE signs was observed, as early as 1957. Taking into account the magnetic-field excitonabsorption flare-up effect found by us, it was natural to assume that excitons in InSb appear in the presence of the field.
The exciton-absorption spectra were first obtained in InSb crystals in the following way [6]. We had preliminarily selected samples with extremely low concentration of free carriers in order to avoid the screening of the Coulomb interaction between the electron and hole by free charges. Next, to detect excitons in InSb, we applied a magnetic field. Figure 13 represents the results thus obtained.
The spectra of the exciton in InAs [27] were obtained in a similar scenario. In a similar way we have dealt with quasibinary solid solutions CdHgTe [28] where the corresponding
band gap is close to that in InSb at the cadmium concentration of x = 0.2 (see figure 14).
7.1. Observation of a quasi one-dimensional behaviour of excitons in InSb in a high magnetic field (1982–85)
When working with InSb, the Elliott–Loudon criterion values β > 102 are easily achieved. This implies the possibility of modelling the entirely one-dimensional behaviour of the exciton. Figure 15 shows two first absorption maxima in an InSb crystal in the magnetic field. One can see that the view is similar to the spectrum calculated for a quantum wire [29]. The spectrum consists of a series of discrete levels of the 1D exciton with ν = 0, 1, etc. which move into a continuum with the absorption level obeying the inverse-square-root dependence on energy. The states are described by the Landau numbers 0 and 1 and registered in a field less than 4 T. With further increase of the field up to about 8 T, an additional structure appears at the continuum tail. The structure reproduces the distance between the Landau levels of holes [30] (see figure 16). Figure 17 represents an InSb DE spectrum and our interpretation of it. They have allowed us to calculate the most comprehensive set of band structure parameters of this crystal [31].
7.2. Proof of exciton participation in the formation of magneto-optical spectra of PbTe (1986)
Observations of exciton spectra in narrow-gap semiconductors have significantly expanded the range of semiconductors with the dominance of the Coulomb interaction in the processes of interband optical absorption. It has been possible owing to the
7
Semicond. Sci. Technol. 27 (2012) 053001 |
Topical Review |
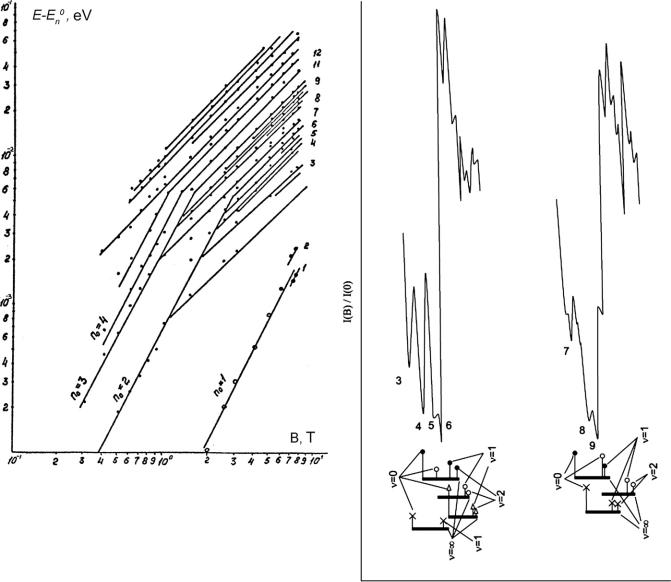
Figure 10. Fan chart for InP in logarithmic energy coordinates (Emax − E0n) versus B, where E0n represent different excited-state energies with n0 = 1, . . . ,5 at B = 0. Kinks mark transitions from the weak-field conditions to the strong-field ones. Any weak-field part has a nearly quadratic slope (diamagnetic shift) whereas a strong-field part is quasi-linear.
original use of the effect of exciton-absorption flare-up of in the magnetic field.
A clarification of the exciton role in the case of PbTe magneto-optics is an extreme task. Here, the permittivity reaches 600–1000, and substantially greater value β can be easily achieved.
As a result, possible exciton binding energy is so microscopic that it has the order of a few tenths of μeV. Therefore, the exciton can be destroyed by the thermal motion even at cryogenic temperatures. However, for such an exciton binding energy, any low magnetic field makes exciton onedimensional (see the Elliott–Loudon criterion, Formula 1). As is well known in the 1D case, the bound state can form in an arbitrarily small attractive potential. A paradoxical situation comes out: (1) an exciton is formed in any very low magnetic field, and (2) its formation probability is the higher, the lower is the probability of the electron–hole binding in the absence of a magnetic field. Then, the question arises: what is the role of excitons in the OMA formation in crystals like PbTe, in which the direct (without magnetic field) observation of excitons is almost impossible? So, the proof of the essential role of the diamagnetic excitons in the observation of an oscillatory
Figure 11. Fragments of the InP DE spectrum corresponding to the quasi-one-dimensional DE series. The DE states with quasi-one-dimensional quantum numbers ν = 0,2,.. are detectable. Numeration gives serial numbers of spectral lines the same as in figure 10.
dependence of the absorption edge of these crystals is the key moment of the DE physics.
To answer the above question, we have registered the PbTe OMA (see figure 18) and got differential electro-absorption spectra in crossed electric and magnetic fields [32]. The differential signal appeared to be very peculiar. Its amplitude rapidly increased with the fixed bias up to 3 V cm−1 and then fell again to almost zero (see figure 19). This decline is linear in the scale corresponding to the dependence of probability of impact ionization of large-radius excitons by free electrons in the accelerating electric field (see figure 20). Using these experimental data, we have been able to extract the PbTeexciton radius and binding energy as a function of applied magnetic field as well as the values of the effective masses of electrons and holes [32].
8