Yang Fluidization, Solids Handling, and Processing
.pdfRecirculating and Jetting Fluidized Beds 275
|
dV |
πD 2 |
|
Eq. (32) |
B |
= G j − U mf |
B |
|
2 |
||
|
dt |
||
where VB = πDB3/12 for a hemispherical bubble.
Equation (32) can be reduced to show the changes of bubble diameter with respect to time in Eq. (33):
|
|
|
D 2 dD |
|
|
= |
dt |
Eq. (33) |
|
|
B B |
|
|
||
(4G |
j |
− 2πU |
mf |
D2 ) |
π |
||
|
|
|
B |
|
|||
Integrating Eq (33) with the boundary condition that DB = 0 at t = 0 gives:
|
|
1 |
é |
|
G |
j |
|
æ |
2G + D |
B |
2π G U |
ö |
|
|
ù |
||||
Eq. (34) |
t = |
ê |
|
|
ln |
ç |
|
j |
|
j |
mf |
|
÷ |
- D |
|
ú |
|||
|
|
|
|
ç |
|
|
|
|
|
|
÷ |
B |
|||||||
|
2U |
ê |
|
2πG |
U |
|
2G |
|
- D |
|
2π G U |
|
ú |
||||||
|
|
|
|
ç |
j |
B |
÷ |
|
|
||||||||||
|
|
mf ë |
|
j mf |
|
è |
|
|
j |
mf |
ø |
|
|
û |
|||||
The maximum bubble size, where the total gas leakage through the bubble boundary equals the total jet flow, can be obtained from either Eq. (32) or Eq. (33):
Eq. (35) |
(DB )max |
= |
2Gj |
|
πU mf |
||||
|
|
|
The total amount of gas leakage from the bubble at a bubble size DB is:
Eq. (36)
|
|
|
é |
|
|
|
|
|
æ |
|
|
|
|
|
|
ö |
|
|
ù |
|
|
|
|
Gj |
|
Gj |
|
|
|
2Gj |
+ DB |
2π Gj Umf |
|
|
3 |
||||||||||
F = |
ê |
|
|
|
ln |
ç |
|
÷ |
- D |
|
ú |
- |
π DB |
|||||||||
|
|
|
|
|
ç |
|
|
|
|
|
|
÷ |
B |
|
||||||||
|
2U |
|
ê |
|
2π G |
U |
|
|
2G |
|
- D |
|
2π G |
U |
|
ú |
12 |
|||||
|
|
|
mf |
|
ç |
j |
B |
÷ |
|
|
||||||||||||
|
|
mf ë |
j |
|
|
è |
|
|
|
j mf |
ø |
|
|
û |
|
|
||||||
Equation (34) and the experimental bubble frequency, n = 1/t, were used to predict the expected bubble diameter. The predicted bubble diameters are very close to those actually observed. Theoretically, Eqs. (34) and (36) can be solved to obtain both the bubble frequency and the bubble diameter if the

276 Fluidization, Solids Handling, and Processing
total gas leakage at the moment of bubble detachment, F, is known. The only correlations available now to predict F are the empirical ones shown in Fig. 20. The bubble growth equations can be similarly derived for a circular jet in a three dimensional bed. The same experimental observation and conclusions described above for a semicircular bed are expected to hold as well.
Figure 20. Comparison between the experimental bubble flow and the total flow through the jet nozzle.
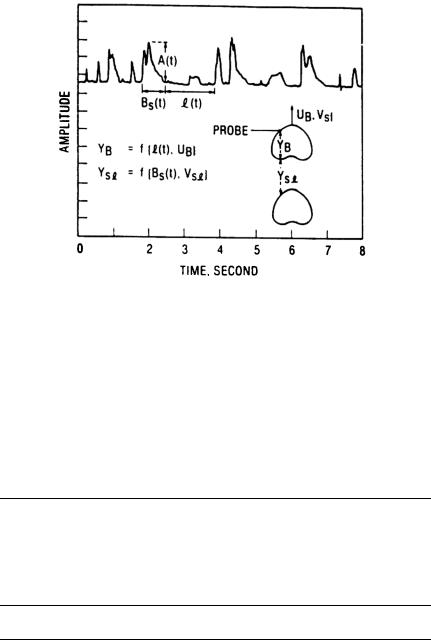
Bubble frequency from the jet was also studied using a force probe in the same bed (Ettehadieh et al., 1988). The frequency characteristics of the force probe responses and their average power spectrums were calculated. Typical average power spectrum plots of the density fluctuations measured along the bed height are shown in Fig. 21. The frequencies of the more pronounced peaks in the average power spectrum plots represent the characteristic frequencies of the periodic components of the fluctuations. Due to the presence of overlapping periodic phenomena in the lower jetting sections of the bed such as jet pulsations, bubble formation and bubble coalescence, multiple major frequencies are observed in these


278 Fluidization, Solids Handling, and Processing
frequency of the oscillations measured in the lower jetting and bubble coalescing portions of the bed by in effect extending the bubble coalescence region. The figures also show that regardless of the jet flow rates and the size of the two different jet diameters, the frequency profiles all level off into a narrow frequency band at approximately 2 m above the jet inlets. All visually observed jet penetration depths fall within this jet influence zone.
Bubble frequencies measured visually in the three viewing area by the frame-by-frame analysis of motion pictures are also shown in Figs. 22 and 23. Bubbling frequencies reported from the motion pictures are the frequencies of all bubbles, random or periodic, which were observed within the viewing areas. Whereas the force probe results are measured at specific bed elevations and represent the passage frequency of the most periodic single or coalesced bubbles. The slight discrepancy between the results reported by the two different sampling methods is therefore not unexpected. In the upper portions of the bed, where bubble coalescence is almost complete, the frequencies measured by the force probes are very close to the visually observed bubbling frequencies. In the lower bubble formation and coalescence portions of the bed, where bubbles form randomly and coalesce into larger bubbles, the characteristic frequencies are smaller than the overall bubbling frequencies observed visually.
~ c.. (..)
>- (..) z w :) c w ~ 1.1,.
Figure 22. Profiles of the characteristic major frequencies measured along the bed height with the 25.4-cm jet assembly.

Recirculating and Jetting Fluidized Beds 281
3.2Gas Mixing Around the Jetting Region
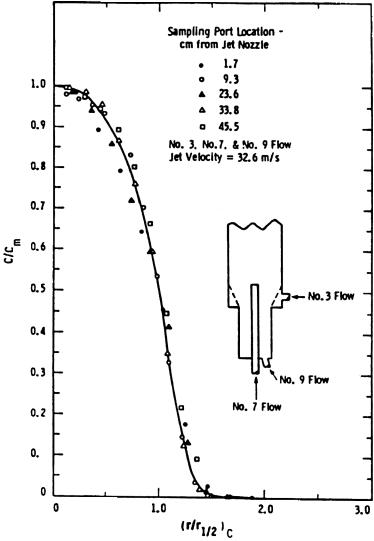
Gas Mixing Around Single Jets. The gas exchange between the jet and the outside emulsion phase was studied by tracer gas injection and by integration of gas velocity profiles in the jet at various heights above the jet nozzle in a 28.6 cm diameter bed with a 3.5 cm jet and polyethylene beads as bed material (Yang et al., 1984a). The typical tracer concentration profiles across the bed obtained at five different elevations are shown in Figs. 25 and 26 for a nominal jet velocity of 32.6 m/s and with two different aeration flows outside the jet. The concentration profiles penetrate farther into the emulsion phase when there is less aeration flow outside the jet. The concentration profiles obtained at different elevations are also approximately similar if the local tracer concentration is normalized with the maximum tracer concentration at the axis, C/Cm, and plotted against a normalized radial distance, r/(r1/2)c, where (r1/2)c is the radial position where the tracer concentration is just half the maximum tracer concentration at the axis (see Figs. 27 and 28). Thus, we experimentally determined that, in a permanent flamelike jet in a fluidized bed, not only the velocity profiles in the jet, but also the gas concentration profiles, are similar.
The gas mixing between the jetting region and the emulsion phase and the gas flow pattern around the jet were determined by solving the tracer gas conservation equation numerically along with the axial velocity profiles in the jet obtained with a pitot tube as discussed in the section, “Momentum Dissipation of a Gas-Solid Two-Phase Jet.” It is concluded that the gas mixing in a jetting fluidized bed with a permanent flamelike jet is due primarily to convection and that diffusion plays a negligible role.
The resulting velocity profiles and the flow pattern inside and around the jet are shown in Figs. 29 and 30 for a jet velocity of 32.6 m/s and with two different aeration flows. The jet boundary at Vz = 8 m/s shown in Figs. 29 and 30 was calculated from Tollmien similarity. The boundary where the tracer gas concentration becomes zero, C = 0, was determined from the normalized experimental tracer gas concentration profiles shown in Figs. 27 and 28. The arrows in Figs. 29 and 30 indicate the actual axial and radial flow components, and the magnitudes are in m/s. The gas flow direction is predominantly from the emulsion phase into the jet at distances close to the jet nozzle. This flow can be from the aeration flow in the emulsion phase, as in the cases of high jet velocity or high aeration flow, or from the flow recirculated from the upper part of the jet. The


Recirculating and Jetting Fluidized Beds 283
Figure 26. Experimental Concentration Profiles at Different Distances from the Jet Nozzle (Run GJ35).