

Chapter 1 |
Pinch Technology |
15 |
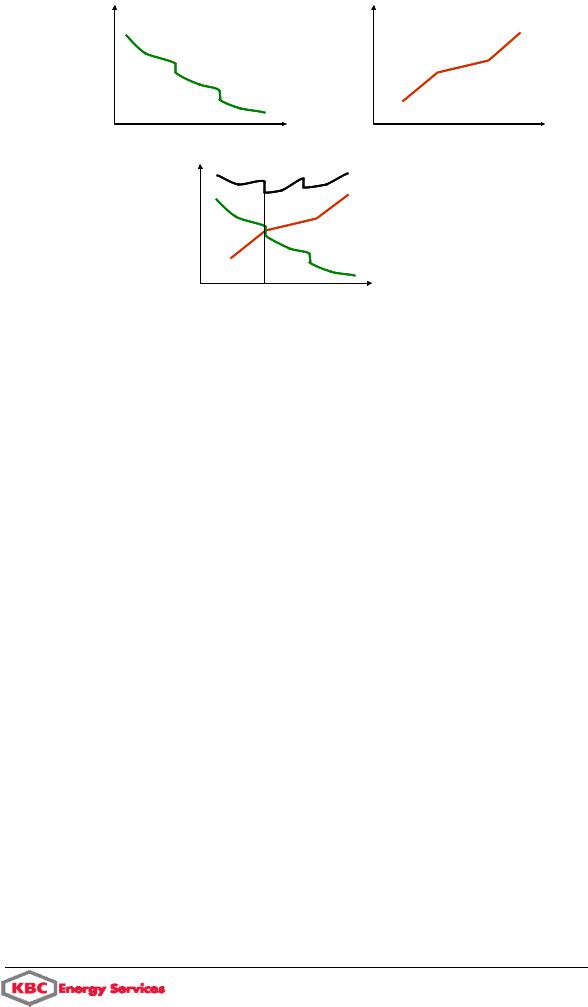
Capital |
Energy |
Cost |
Cost |
Tmin |
Tmin |
Cost
|
|
|
l |
|
|
ta |
|
|
o |
|
|
|
T |
|
|
|
|
|
y |
|
|
g |
|
|
|
r |
|
|
e |
|
|
|
n |
|
|
|
E |
|
|
|
Ca |
||
|
|
|
pital |
Topt |
|
|
Tmin |
The trade-off between energy and capital costs gives the optimum DTmin for minimum cost in new designs
This provides an optimum DTmin for the network ahead of design [3, 8]. It is important to note that the capital cost targeting algorithm is based on the simplifying assumption that any hot stream can match against any cold stream. It does not consider matching constraints between specific hot and cold streams. Therefore the capital cost targeting technique and DTmin optimisation is particularly applicable for systems with fewer matching constraints such as atmospheric and vacuum distillation preheat trains, FCC unit, etc..
The description above has assumed pure counter-current heat exchangers. However, in SuperTarget PROCESS there is an additional option to target based on shell and tube exchangers with one shell pass and two tube passes. This is the most common exchanger type found in industrial use.
1.7.2 Retrofit
Pinch Technology is applicable to both new design and retrofit situations. The number of retrofit applications is much higher than the number of new design applications.
In this section techniques are discussed for setting targets for energy saving for an existing plant based on capital-energy trade-off for retrofit projects. The SuperTarget PROCESS module developed by KBC [4] contains tools which employ these techniques.
Retrofit Targeting based on Capital-energy trade-off
The illustration below provides an understanding of the capital - energy trade-off for a retrofit project using an area-energy plot.
Pinch Technology Introduction

16 |
Pinch Technology |
Chapter 1 |
|
Poor |
|
Area |
economics |
|
|
|
|
Good |
|
|
economics |
|
|
ideal scenario |
|
Don’t discard |
‘Grassroots’ |
Existing |
existing area |
|
||
optimum |
network |
|
|
|
Grassroots |
INFEASIBLE |
|
trade-off curve |
Energy
Capital energy trade off for retrofit applications
The curve (enclosing the shaded area) is based on new design targets for the process. The shaded area indicates performance better than the new design targets (which is infeasible for an existing plant). An existing plant will typically be located above the new design curve. The closer the existing plant is to the new design curve the better the current performance. In a retrofit modification, for increased energy saving, the installation of additional heat exchanger surface area is expected. The curve for the additional surface area that is closest to the new design area-energy curve provides the most efficient route for investment (good economics). The following section explains how such a curve for a retrofit application can be developed ahead of design.
Maintaining Area Efficiency
The figure below depicts an approach for retrofit targeting based on the concept of "area efficiency". An area efficiency factor α can be determined for an existing network according to the following equation:
α = [ At / Aex]Eex = [A1/ A2] Eret
where:
Eex : Existing energy consumption
Aex : Existing surface area of the network
At : Target surface area for the new design at the existing energy consumption (Eex).

Chapter 1 |
Pinch Technology |
17 |
Area |
|
Atarg |
|
A1 |
|
α |
= |
= |
|
||
Aexist |
A2 |
|
|||
|
|
E |
E |
||
|
|
|
exist |
|
retro |
A2 |
|
|
|
|
|
A1 |
|
|
|
|
|
Aexist |
|
|
|
constant-α |
|
|
|
|
|
retrofit curve |
|
Atarg |
|
|
grassroots |
|
|
Eretro |
|
Eexist |
Energy |
|
|
Area Efficiency concept
Area efficiency determines how close the existing network is to the new design area target. In order to set a retrofit target, one approach is to assume that the area efficiency of the new installed area is the same as the existing network as shown in the figure [3, 9].
Payback
From the area-energy targeting curve the saving versus investment curve for the retrofit targeting can be developed. This is shown below.
Saving
1 yr payback |
2 yr payback |
f(Eretro)
Choose
• energy savings
• investment
• payback
f(Aretro) Investment
Existing design
Targeting for retrofit applications
Various pay-back lines can be established as shown in the figure. Based on the specified pay-back or investment limit, the target energy saving can be set. This will in turn determine the targeted DTmin value for the network. From the target DTmin value, the cross pinch heat flow and the cross pinch heat exchangers that need to be corrected are calculated. This forms the basis for the network design modification as further discussed in "Heat Exchanger Network Design".
Pinch Technology Introduction

18 |
Pinch Technology |
Chapter 1 |
This targeting procedure is based on the constant α assumption. This assumption is particularly valid if the α for the existing network is high (say above 0.85). In situations where the existing α is low (say 0.6) the constant α assumption is conservative. In such cases it can be assumed that the additional area can be installed at a higher area efficiency (say 0.9 or 1).
The retrofit targeting procedure is particularly applicable for processes with few matching constraints such as atmospheric and vacuum distillation preheat trains. For other applications the targeting methods described in the following sections are more applicable.
Retrofit targeting based on DTmin - Energy curves
Exchanger capital cost and heat transfer information is required to set the retrofit targets based on capital energy trade-off. In addition, the process may have heat exchanger matching constraints which create inaccuracies in the capital cost targets as described in "Payback". Finally the project time constraints may limit the use of the capital cost targets for retrofit targeting. In this section a simpler approach to retrofit targeting based on the analysis of energy target variation with DTmin is described.
Targeting for retrofit applications
The figure above shows an example of a DTmin- Energy plot for a process. The plot can be directly obtained from the process composite curves. The vertical axis can represent energy target or energy cost. Existing design corresponds to the DTmin of 36ºC between the composite curves. The plot shows that the variation of energy target (or energy cost) is quite sensitive to DTmin in the temperature range of 30ºC to 20ºC. However between 20ºC and 8ºC the energy target is not sensitive to DTmin. On the other hand the capital cost may rise substantially in this region. It therefore implies that 20ºC is an appropriate target for the retrofit.
Although the DTmin - Energy plot does not directly account for the capital cost dimension, it is expected that dominant changes in the energy dimension will have an impact on the capitalenergy trade-off. The above approach, coupled with previous application experience on similar processes (see "Retrofit targeting based on experience DTmin values") provides practical targets in many situations.
DTmin Calculation in PinchExpress and PROCESS
In PinchExpress and SuperTarget PROCESS, an option for automatically calculating a suitable DTmin for a process is available. This calculation is done by considering an areaenergy trade-off based on one of two benchmark processes built in to the software. These processes are used as they represent two extremes of plant economics.

Chapter 1 |
Pinch Technology |
19 |
A Crude Oil Project is used as the benchmark for above ambient processes because it displays a well behaved trade-off between area cost and capital cost. In addition, the optimum DTmin for this process is high because the composite curves are narrow, leading to high area requirements. This means that it represents one extreme of plant economics, where the optimum DTmin can be greater than 30°C. Using this benchmark will ensure that a lower DTmin is selected for an above ambient process with diverging composite curves.
An Ethylene cold-end project is used as the benchmark for below ambient processes because it requires refrigeration utilities at temperatures as low as -100°C. This is very expensive so the economic DTmin is sensitive to the cost of the refrigeration utilities. This therefore represents the other extreme of plant economics, where driving forces are tight to minimise expensive refrigeration. The optimum DTmin for an ethylene cold-end may be as low as 2°C. Using this as a benchmark will ensure that other processes requiring less extreme refrigeration will use a higher DTmin.
A process that is similar to one of these two will be adequately represented by the benchmark trade-off between area cost and energy cost. This trade-off can be fine tuned by changing the benchmark DTmin values.
For each benchmark, the software defines two different DTmin values, one for a New Design and one for a Retrofit project. The values for retrofit are usually slightly higher than those for New Design (i.e. saving less energy) due to the difficulty of re-arranging the existing heat exchangers.
A process that is significantly different from either benchmark will fit into one of the following categories:
1.It has divergent composite curves and scope for use of intermediate utilities. For these processes the optimum DTmin is usually determined by a sharp change in the plot of DTmin vs. Energy Cost. This means that the trade-off between Energy Cost and Capital Cost can vary significantly without hardly changing the optimum DTmin at all. In other words, the answer is not very sensitive to the trade-off so the benchmark values are perfectly adequate.
2.It is a mixture of above and below ambient parts. In this case the program will automatically use both benchmarks when determining the trade-off between energy cost and capital cost.
From this discussion it should now be clear that PinchExpress / PROCESS has sufficient information to calculate a suitable DTmin for any type of process. Most importantly, this can be done without knowing specific information about individual heat exchanger costs or heat transfer coefficients.
A final point worth making is that this new method can be regarded as a combination of all the other methods described in this chapter, for the following reasons:
1.The use of benchmark processes is analogous to the use of experience values (see next section).
2.For a refinery process the method will explore the trade-off between area cost and energy cost, in a similar manner to that described in earlier sections.
Pinch Technology Introduction