

опыт трансформации старопромышленных городов / 2007-08
.pdfDiscussion Papers on Entrepreneurship, Growth and Public Policy |
20 |
twenty creative class centers, while fourteen of the top twenty regions on the Innovation Index do so as well.
Table 13
Technology Index Ranking for Benchmarked Statistical Areas
(Rank Ordered List)
Target Statistical Area |
Technology Index |
Philadelphia NJ-PA |
0.619 |
Chicago IL |
0.616 |
Pittsburgh PA |
0.589 |
St. Louis IL-MO |
0.533 |
Baltimore MD |
0.497 |
Cleveland OH |
0.465 |
Milwaukee WI |
0.450 |
Detroit MI |
0.350 |
Source: Kevin Stolarick, PhD - Carnegie Mellon University
While Baltimore is located in proximity to the I-270 Technology Corridor, it ranks only fifth among peer metropolitan regions on the overall Technology Index (see table 13). However, the Innovation Index—measured by utility patent outputs—ranks Baltimore first among the benchmarked metropolitan area (see table 14). Patents translate the society’s underlying creativity and innovation into economic outcomes. At the county level, Queen Anne’s County shows above expectation results with 250% patent grant increase from 1990 to 2000.
Table 14
Utility Patents by Benchmarked Statistical Area
(Rank Ordered List by Percent Change)
Change 1990-1999
Target Statistical Area |
1999 |
Number |
Percent |
Baltimore, MD PMSA |
664 |
295 |
80% |
Queen Anne's County |
14 |
10 |
250% |
Harford County |
64 |
39 |
156% |
Carroll County |
44 |
25 |
132% |
Howard County |
152 |
74 |
95% |
Baltimore City |
142 |
63 |
80% |
Baltimore County |
164 |
70 |
74% |
Anne Arundel County |
84 |
14 |
20% |
St. Louis, MO-IL MSA |
743 |
307 |
70% |
Philadelphia, PA-NJ PMSA |
1,849 |
636 |
52% |
Detroit, MI PMSA |
1,964 |
622 |
46% |
Chicago, IL PMSA |
2,929 |
843 |
40% |
Cleveland, OH PMSA |
786 |
181 |
30% |
Milwaukee, WI PMSA |
530 |
119 |
29% |
Pittsburgh, PA MSA |
809 |
68 |
9% |
Source: US Patent and Trademark Office
Discussion Papers on Entrepreneurship, Growth and Public Policy |
21 |
Territory Dimension
From a territorial perspective Baltimore is unique. The wealth of territorial amenities is a major selling point for the Baltimore Region: from winning sports teams through the uniqueness of Fells Point to the wealth of green spaces, parks and trails. It is the home of the railroad, Fort McHenry, the Naval Academy, the Inner Harbor, and the Chesapeake Bay. The Baltimore waterfront presents the region with an opportunity to improve its territorial assets and create an open, inclusive, and diverse community through a working harbor designed for both work and leisure. The city has a great urban fabric connecting universities, water, excellent transportation, and affordable housing.
The latter category, translating into housing costs, affects the attractiveness of a community especially for young adults at the beginning of their careers and peak of their mobility. When assessing the number of households spending less than 35% of their income on housing costs (including: renters, owners with mortgage, and owners without mortgage), on the MSA level Baltimore’s share increased but not at the rate this phenomenon occurred in similar industrial cities with Chicago in the lead (see table 15). At the county level, Baltimore fared surprisingly well once more.

Discussion Papers on Entrepreneurship, Growth and Public Policy |
22 |
|||||
|
Table 15 |
|
|
|
|
|
|
Households Paying Less than 35% of Income for Housing |
|
|
|||
|
(Rank Ordered List by Percent Change) |
|
Change 1990-2000 |
|||
|
|
|
|
|||
|
Target Statistical Area |
2000 |
Number |
Percent |
|
|
|
Chicago, IL PMSA |
1,927,092 |
481,543 |
33% |
|
|
|
Cleveland, OH PMSA |
629,102 |
116,895 |
23% |
|
|
|
Pittsburgh, PA MSA |
683,302 |
93,641 |
16% |
|
|
|
Milwaukee, WI PMSA |
417,831 |
38,339 |
10% |
|
|
|
St. Louis, MO--IL MSA |
736,290 |
64,880 |
10% |
|
|
|
Baltimore, MD PMSA |
694,902 |
47,051 |
7% |
|
|
|
Howard County |
69,333 |
17,942 |
35% |
|
|
|
Harford County |
|
59,791 |
13,763 |
30% |
|
|
Carroll County |
|
40,409 |
9,207 |
30% |
|
|
Queen Anne's County |
|
10,326 |
2,152 |
26% |
|
|
Anne Arundel County |
|
136,411 |
24,126 |
21% |
|
|
Baltimore County |
|
228,171 |
19,556 |
9% |
|
|
Baltimore City |
|
171,891 |
-18,265 |
-10% |
|
|
Detroit, MI PMSA |
1,222,496 |
73,890 |
6% |
|
|
|
Philadelphia, PA--NJ PMSA |
1,331,992 |
75,650 |
6% |
|
|
Source: American FactFinder - U.S. Census Bureau
The importance of affordable housing is highlighted by Florida (2005) in his second book, The Flight of the Creative Class. To express this dimension statistically, Dr. Kevin Stolarick of Carnegie Mellon University compiled the Wage Inequality and Housing Inaffordability Index. The Wage Inequality Index shows a population’s tendency to earn considerably above or bellow average salary. There is a strong correlation between inequality in wages and creativity: more creative regions show more prominent income inequality. Baltimore ranked first on the Wage Inequality scale, meaning that the income divide is great in the region (see table 16). While a good number of people earn above average income, a considerable segment of the population earns bellow average salaries.

Discussion Papers on Entrepreneurship, Growth and Public Policy |
23 |
|||
|
Table 16 |
|
|
|
|
Wage Inequality Index Ranking for Benchmarked |
|
|
|
|
Statistical Areas |
|
|
|
|
(Rank Ordered List) |
|
|
|
|
|
|
|
|
|
Target Statistical Area |
Within Size Ranking |
|
|
|
Baltimore MD |
|
17 |
|
|
Philadelphia NJ-PA |
|
30 |
|
|
Pittsburgh PA |
|
33 |
|
|
Chicago IL |
|
36 |
|
|
Detroit MI |
|
40 |
|
|
Cleveland OH |
|
45 |
|
|
Milwaukee WI |
|
47 |
|
|
St. Louis IL-MO |
|
52 |
|
Source: The Flight of the Creative Class, by Richard Florida
The latter segment may be the reason why Baltimore ranks only sixth on the housing costs table (see table 15) and fourth on the housing inaffordability table (see table 17). The Housing Inaffordability Index is calculated using total housing costs categorized by housing types (rental, owned, mortgage, no mortgage, etc.) and weighed by the number of people in each type. This index is significantly and negatively correlated with total population.
Table 17
Housing Inafordability Index Ranking for Benchmarked Statistical Areas
(Rank Ordered List)
Target Statistical Area |
Within Size Ranking |
Chicago IL |
26 |
Philadelphia NJ-PA |
28 |
Cleveland OH |
38 |
Baltimore MD |
45 |
Milwaukee WI |
46 |
Pittsburgh PA |
53 |
Detroit MI |
57 |
St. Louis IL-MO |
60 |
Source: The Flight of the Creative Class, by Richard Florida
Conclusion
While there are lots of examples of high-tech regions becoming creative (Silicon Valley, Seattle, Boston Route 128), what we need are examples of creative economy transformations for
Discussion Papers on Entrepreneurship, Growth and Public Policy |
24 |
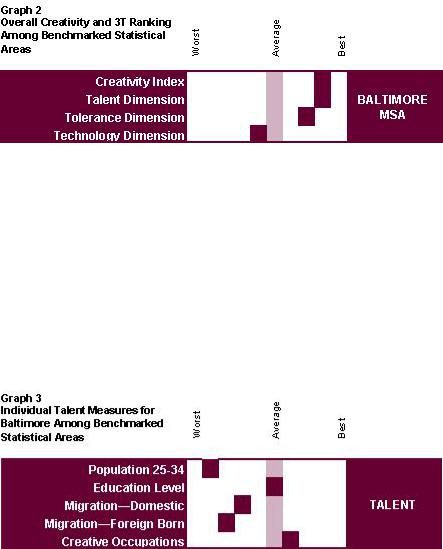
industrial cities. Baltimore, as a South-East anchor of the old industrial parallelogram, more than any other city in the region has the opportunity to capitalize on its creative economy. This unique opportunity is given by the region’s proximity to Washington, DC and its high ranking on dimensions of talent, tolerance, and technology. The Baltimore MSA ranks 17th in the creativity index among all cities of over 1 million inhabitants—right after Minneapolis and before Los Angeles (see table 2)—and first on the Creativity Index among benchmarked metropolitan areas (see table 3). Baltimore also ranks favorably in overall measures of 3Ts when compared to Philadelphia, Chicago, St. Louis Milwaukee, Cleveland, Pittsburgh and Detroit (see graph 2).
Along individual measurements of 4T, Baltimore shows both strengths and areas of improvement. The region fares relatively well in its population’s educational levels and concentration of creative occupations in the region (see graph 3). Nevertheless on both these categories there’s room for improvement. On the Talent Dimension, Baltimore’s greatest weakness is its declining population aged 25-34. Also, the current rate of inward migration is not actively attracting creative talent.
Discussion Papers on Entrepreneurship, Growth and Public Policy |
25 |
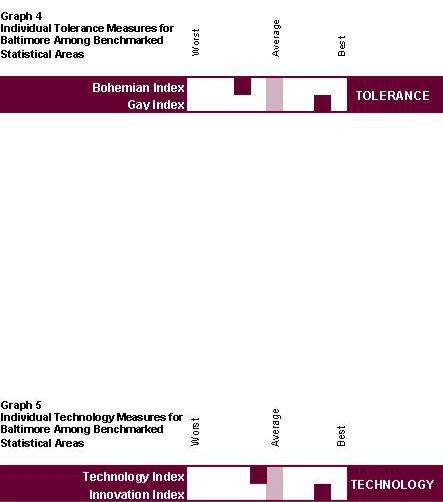
The region shows capacity to nurture creativity with high overall tolerance levels, ranking second among peer cities (see graph 2). The Tolerance Dimension is strong in Baltimore’s profile, with high ranking on the Gay Index (see graph 4). Areas of improvement in the diversity dimension are expressed through the Bohemian Index. The Baltimore region and Maryland in general fails to adequately invest resources in its arts and entertainment scene.
The region is a leader in technological innovation and has shown great signs of success in the Technology Dimension. Nevertheless, there is still room for growth. Baltimore ranks very high in creative high-tech indexes and has a high number of biotechnology companies compared to the national average. The region’s strengths are its potential for technological innovation through utility patents (see graph 5). Nevertheless, Baltimore needs to find ways to tap into Washington, DC’s creative labor pool and leverage talent from the reserve provided by local universities in order to further improve in this dimension overall (see graph 2).
On the Territory Dimension, the Baltimore MSA has a lot to offer: access to the Atlantic Ocean through the Chesapeake Bay, four state parks in Baltimore County, historic towns, and ethnic neighborhoods. Housing costs in the region became more affordable to an additional 7% of population over the past decade, with an even greater impact at the county level. The region

Discussion Papers on Entrepreneurship, Growth and Public Policy |
26 |
shows capacity to attract creativity with high wage inequality and low housing inaffordability measures (see graph 6). Baltimore’s Wage Inequality Index suggests strong presence of the creative class, but housing affordability could be increased to attract even more talented young professionals to the area.
Baltimore fits the model of a creative community, especially considering its traditionally industrial profile. Moreover, its proximity to Washington, DC—a truly modern and creative high-tech nucleus —and access to the largest reservoir of creative talent in the nation provide grounds for this region to pioneer an unprecedented economic turnaround. Baltimore owns resources and can develop further capabilities to pull creative talent from its surrounding area. Nevertheless, to do that, civic and community leadership must come together to actively seek policies that favor creativity and implement a strategic plan towards harnessing the creative potential.
Acknowledgements
The authors are extending their special thanks to Richard Florida, of George Mason University, for his intellectual contributions and engagement over the span of several discussions and to Kevin Stolarnick, of Carnegie Melon University, for providing research data on various creativity measures. Additionally, our gratitude is offered to Wim Wiewel, Provost at the University of Baltimore, for his support and funding. We also thank Annabel Acs, undergraduate student at Boston University, for her input as Research Assistant.
Discussion Papers on Entrepreneurship, Growth and Public Policy |
27 |
References
Acs, Z. J. and Storey, D. B. 2004 Entrepreneurship and regional development: Essays in honour of David Keeble, Regional Studies, 38.8: 871-877.
Armington, C. and Acs, Z. 2002 The determinants of regional variation in new firm formation,
Regional Studies, 36.1: 33-45.
Bartik, T. 1989 Small business start-ups in the US: Estimates of the effects of characteristics of states, Southern Economic Journal, 55: 1004-1018.
Blanchflower, D. and Oswald, A. 1990 What makes an entrepreneur, Journal of Labor Economics, 16: 26-60.
Cattell, R. B. and Butcher, H. 1968 The prediction of achievement and creativity (Indianapolis: Bobbs-Merrill).
Chell, E. Haworth, J. M. and Brearley, S. 1991 The entrepreneurial personality: Concepts, cases and categories (London: Routledge).
Desrochers, P. 2001 Local diversity, human creativity, and technological innovation, Growth and Change, 32.
Evans, D. S. and Leighton, L. S. 1989 Some empirical aspects of entrepreneurship, American Economic Review, 79: 519-535.
Evans, D. S. and Leighton, L. S. 1990 Small business formation by unemployed and employed workers, Small Business Economics, 2: 319-330.
Florida, R. 2002 The Rise of the Creative Class: And How It's Transforming Work, Leisure, Community and Everyday Life (New York: Basic Books).
Discussion Papers on Entrepreneurship, Growth and Public Policy |
28 |
Florida, R. 2005 The Flight of the Creative Class: The New Global Competition for Talent (New York: HarperCollins)
Florida, R. and Gates, G. 2001 Technology and Tolerance: The Importance of Diversity to HighTechnology Growth (Washington DC: The Brookings Institution).
Jacobs, J. 1961 The Death and Life of Great American Cities (New York: Random House). Jones, T. McEvoy, D. and Barrett, G. 1993 Labour intensive practices in the ethnic minority
firm, in Atkinson, J. and Storey, D. (eds) Financing and the small firm (London: Routledge)
Kieschnick, M. 1981 Taxes and Growth: Business Incentives and Economic Development
(Washington, DC: Council of State Planning Agencies).
Kirchhoff, B. Armington, C. Hasan, I. and Newbert, S. 2002 The influence of R&D expenditures on new firm formation and economic growth. Research report prepared by BJK Associate for U.S. Small Business Administration.
Lee, S. 2001 Entrepreneurship and business development among African Americans, Koreans, and Jews: Exploring some structural differences, in Cordero-Guzman, H. R. (ed.)
Migration, transnationalization, and race in a changing New York, (Philadelphia: Temple University Press), 258-278.
Lee, S. Florida, R. and Acs, Z. J. 2004 Creativity and entrepreneurship: A regional analysis of new firm formation, Regional Studies, 38.8: 879-892.
Lee, S. Florida, R. and Gates, G. 2002 Innovation, human capital, and creativity. Software Industry Center Working Paper, Carnegie Mellon University.
Lucas, R. 1988 On the mechanics of economic development, Journal of Monetary Economics,
22.
Discussion Papers on Entrepreneurship, Growth and Public Policy |
29 |
Reynolds, P. Miller, B. and Maki, W. 1995 Explaining regional variation in business births and deaths: US 1976-1988, Small Business Economics, 7: 389-407.
Park, R. Burgess, E. and McKenzie, R. 1925 The City (University of Chicago Press: Chicago) Reynolds, P. Storey, D. and Westhead, P. 1994 Cross-national comparison of the variation in
new firm formation rates, Regional Studies, 28: 443-456.
Saxenian, A. 1999 Silicon Valley’s new immigrant entrepreneurs. Report prepared by the Public Policy Institute of California.
Sternberg, R. J. 1988 A three-facet model of creativity, in Sternberg, R.J. (ed.) The nature of creativity: Contemporary psychological perspectives (Cambridge: Cambridge University Press), 125-147.
Stolarnick, K. 2005, Personal Communication.
Storey, D. 1994 Understanding the Small Business Sector (New York: Routledge).
Stuart T. and Sorenson, O. 2003 The geography of opportunity: spatial heterogeneity in founding rates and the performance of biotechnology firms, Research Policy, 32: 229-253.
Thompson, W. 1965 A preface to urban economics. Report prepared by the Johns Hopkins Press. US Census Bureau:
http://factfinder.census.gov/servlet/DatasetMainPageServlet?_program=DEC&_submenu Id=datasets_0&_lang=en
Yoon, I. 1997 On my own: Korean businesses and race relations in America (Chicago: University of Chicago Press).