

опыт трансформации старопромышленных городов / 2007-08
.pdfDiscussion Papers on Entrepreneurship, Growth and Public Policy |
10 |
percentile of the Creative Index. It ranks 17th on this national list, with an overall Creativity
Index of 0.903.
Table 3
Creativity Index Ranking for Benchmarked Statistical Areas
(Rank Ordered List by Creativity Index)
Target Statistical Area |
Creativity Index |
Talent Index |
Tolerance Index |
Technology Index |
Baltimore MD |
0.903 |
0.874 |
0.671 |
0.497 |
Philadelphia NJ-PA |
0.867 |
0.812 |
0.595 |
0.619 |
Chicago IL |
0.855 |
0.811 |
0.724 |
0.616 |
St. Louis IL-MO |
0.698 |
0.716 |
0.408 |
0.533 |
Milwaukee WI |
0.559 |
0.701 |
0.525 |
0.450 |
Cleveland OH |
0.498 |
0.589 |
0.436 |
0.465 |
Pittsburgh PA |
0.438 |
0.655 |
0.242 |
0.589 |
Detroit MI |
0.272 |
0.725 |
0.534 |
0.350 |
Source: Kevin Stolarick, PhD - Carnegie Mellon University
The region performs even better in the context of peer cities that fit the old industrial parallelogram. On a list of seven comparable metropolises Baltimore ranks first, showing unique potential in becoming the prototype of an industrial region successfully integrating an open, inclusive, and diverse economy (see table 3). While Baltimore is at the forefront measured both by the Creativity and Talent Index, it is outperformed only by Chicago on the Tolerance Index. The Technology Index places Philadelphia in the lead and Baltimore into fifth place among the benchmarked regions.
The 3Ts explain why cities like St. Louis and Pittsburgh fail to grow despite their deep reservoirs of technology and world-class universities. They have not been sufficiently tolerant and open to attract and retain top creative talent. The interdependence of the 3Ts also explains why cities like Miami and New Orleans do not make the grade even though they are lifestyle meccas: they lack the required technology base. The most successful places such as the San Francisco Bay area, Boston, Austin and Seattle put all 3Ts together. They are truly creative places.
Discussion Papers on Entrepreneurship, Growth and Public Policy |
11 |
Methodology
This paper analyzes the extent to which the Baltimore Metropolitan Statistical Area (Baltimore MSA), in the State of Maryland, represents an environment that attracts and stimulates creativity on the dimensions of 4T: talent, tolerance, technology, and territory.
Measures of the talent dimension include data from the U.S. Census Bureau on population 25-34 years of age, educational levels of population 25+, migration of population aged 5+ to the region, information on foreign born population, and data on occupations considered creative.
Data on the Gay Index and Bohemian Index was provided by Dr. Kevin Stolarick of Carnegie Mellon University, who has done extensive statistical research in various measures of creativity. These two indexes give an insight in the analyzed regions’ tolerance dimension.
Aptitude in technology will be shown by data on utility patents granted by the U.S. Patent and Trademark Office. Finally, the dimension of territory will be described with focus on the Wage Inequality Index and Housing Inaffordability Index provided by Dr. Stolarick, and data on housing costs from the U.S. Census Bureau.
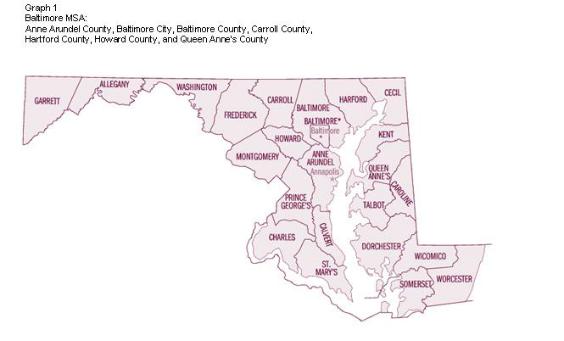
The 4T dimensions of the Baltimore MSA are studied both independently and as compared to seven similar industrial regions. The Baltimore MSA incorporates Anne Arundel County, Baltimore City, Baltimore County, Carroll County, Hartford County, Howard County, and Queen Anne’s County (see graph 1).
Discussion Papers on Entrepreneurship, Growth and Public Policy |
12 |
The benchmarked Metropolitan Statistical Areas (MSA) and Primary Metropolitan Statistical Areas (PMSA) are: Chicago, IL; Cleveland, OH; Detroit, MI; Milwaukee, WI; Philadelphia, PA; Pittsburgh, PA; and St. Louis, MO. These regions were selected because they fit the old industrial parallelogram and are comparable to Baltimore.
Talent Dimension
The statistical correlations between the Talent Index and the creative class centers are understandably among the strongest of any variables in the analysis because creative class people tend to have high levels of education. Baltimore, being ranked first among the peer industrial cities, outperforms its benchmarks with a higher talent rank for the percent of its population that is a part of the creative class (see table 4).

Discussion Papers on Entrepreneurship, Growth and Public Policy |
13 |
Table 4
Talent Index Ranking for Benchmarked Statistical Areas
(Rank Ordered List)
Target Statistical Area |
Talent Index |
Baltimore MD |
0.874 |
Philadelphia NJ-PA |
0.812 |
Chicago IL |
0.811 |
Detroit MI |
0.725 |
St. Louis IL-MO |
0.716 |
Milwaukee WI |
0.701 |
Pittsburgh PA |
0.655 |
Cleveland OH |
0.589 |
Source: Kevin Stolarick, PhD - Carnegie Mellon University
Population 25-34
When it comes to converting human creativity into economic output, the individuals aged 25-34 play a particularly important role. Representing the majority of today’s creative class, this is the hardest working segment of the population at the peak of their mobility.
Table 5
Population Aged 25-34
(Rank Ordered List by Percent Change)
Change 1990-2000
Target Statistical Area |
2000 |
Number |
Percent |
Chicago, IL PMSA |
1,280,225 |
143,847 |
13% |
Cleveland, OH PMSA |
295,069 |
-12,443 |
-4% |
Pittsburgh, PA PMSA |
284,780 |
-41,583 |
-13% |
Detroit, MI PMSA |
644,314 |
-123,458 |
-16% |
Milwaukee, WI PMSA |
205,841 |
-48,381 |
-19% |
Philadelphia, PA--NJ PMSA |
686,005 |
-162,936 |
-19% |
St. Louis, MO--IL MSA |
345,294 |
-84,502 |
-20% |
Baltimore, MD MSA |
352,427 |
-91,977 |
-21% |
Howard County |
36,519 |
-2,717 |
-7% |
Anne Arundel County |
72,235 |
-7,824 |
-10% |
Harford County |
28,685 |
-5,301 |
-16% |
Carroll County |
17,896 |
-3,354 |
-16% |
Queen Anne's County |
4,724 |
-981 |
-17% |
Baltimore County |
101,340 |
-23,276 |
-19% |
Baltimore City |
93,248 |
-44,633 |
-32% |
Source: American FactFinder - U.S. Census Bureau
Nationally, the size of this cohort has been shrinking over the past decade. With the exception of Chicago, industrial urban areas are loosing their young adult population, what translates into a creative brain-drain. Cleveland experiences considerably less brain drain than its peers. While Baltimore ranks last on this category, the picture significantly improves at the

Discussion Papers on Entrepreneurship, Growth and Public Policy |
14 |
county level. Howard and Anne Arundel counties—located geographically to the South, between the Cities of Baltimore and Washington, DC—lost less young population than the rest of the MSA (see table 5). Loss of young creative adults encumbers Baltimore’s progress towards a creative economy; however, the region’s proximity to Washington, DC provides a talent resource that can augment the region as long as Baltimore takes measures to attract this talent.
Education Levels
Educational levels are highly correlated with creativity, innovation, and economic growth. Baltimore ranks forth within the benchmarked MSAs, while education levels within the counties forming the Baltimore MSA are even higher (see table 6). At the county level, 58% of the population has a bachelor’s degree or above in areas North of Baltimore City: Carroll and Hartford Counties.
Table 6
Population Aged 25+ with a Bachelor's Degree or Higher
(Rank Ordered List by Percent Change)
Change 1990-2000
Target Statistical Area |
2000 |
Number |
Percent |
Chicago, IL PMSA |
1,586,055 |
631,110 |
66% |
Cleveland, OH PMSA |
350,620 |
108,834 |
45% |
Pittsburgh, PA PMSA |
391,691 |
114,657 |
41% |
Baltimore, MD MSA |
493,842 |
132,064 |
37% |
Carroll County |
15,786 |
5,793 |
58% |
Harford County |
25,564 |
9,347 |
58% |
Queen Anne's County |
4,606 |
1,607 |
54% |
Anne Arundel County |
62,371 |
18,894 |
43% |
Howard County |
48,210 |
14,287 |
42% |
Baltimore County |
92,487 |
21,562 |
30% |
Baltimore City |
43,746 |
3,665 |
9% |
Milwaukee, WI PMSA |
260,981 |
66,598 |
34% |
Detroit, MI PMSA |
661,889 |
164,428 |
33% |
St. Louis, MO--IL MSA |
428,849 |
102,532 |
31% |
Philadelphia, PA--NJ PMSA |
932,498 |
210,499 |
29% |
Source: American FactFinder - U.S. Census Bureau
Migration
The mobility of the creative class highly contributes to the social and economic rise or fall of urban regions. Migration can happen at the domestic, as well as international level.

Discussion Papers on Entrepreneurship, Growth and Public Policy |
15 |
Geographic relocation is probably the fastest way a region can gain creative workers. Although other industrial regions enjoy a considerably higher percentage of inward mobility, Baltimore shows a 6% gain of creative population through domestic migration (see table 7). This figure is expected to increase significantly, as creative talent will be driven from the Washington, DC due to housing inaffordability in that region.
Table 7
Migration of Population Aged 5+ to Benchmarked Statistical Area
(Rank Ordered List by Percent Change)
Change 1990-2000
Target Statistical Area |
2000 |
Number |
Percent |
Chicago, IL PMSA |
820,247 |
233,365 |
40% |
Cleveland, OH PMSA |
183,719 |
31,511 |
21% |
Detroit, MI PMSA |
361,116 |
49,320 |
16% |
Pittsburgh, PA PMSA |
171,262 |
22,647 |
15% |
Milwaukee, WI PMSA |
155,498 |
11,385 |
8% |
Baltimore, MD MSA |
307,220 |
17,090 |
6% |
Carroll County |
13,778 |
2,049 |
17% |
Queen Anne's County |
5,952 |
851 |
17% |
Baltimore City |
59,479 |
6,290 |
12% |
Baltimore County |
66,995 |
5,735 |
9% |
Howard County |
52,348 |
2,305 |
5% |
Anne Arundel County |
85,086 |
2,766 |
3% |
Harford County |
23,582 |
-2,906 |
-11% |
Philadelphia, PA--NJ PMSA |
477,595 |
26,264 |
6% |
St. Louis, MO--IL MSA |
251,309 |
11,891 |
5% |
Source: American FactFinder - U.S. Census Bureau
Nationwide, approximately 40% of population growth is the result of international immigration. Comparable to domestic migration, Baltimore receives a considerable share of international talent even if less than other industrial areas (see table 8). At the county level, Baltimore fares even better with impressive results in Howard County, laying South of Baltimore City.

Discussion Papers on Entrepreneurship, Growth and Public Policy |
16 |
|||||
|
Table 8 |
|
|
|
|
|
|
Foreign Born Population |
|
|
|
|
|
|
(Rank Ordered List by Percent Change) |
|
Change 1990-2000 |
|||
|
|
|
|
|||
|
Target Statistical Area |
2000 |
Number |
Percent |
|
|
|
Detroit, MI PMSA |
145,532 |
89,600 |
160% |
|
|
|
St. Louis, MO--IL MSA |
41,073 |
25,021 |
156% |
|
|
|
Milwaukee, WI PMSA |
37,044 |
21,809 |
143% |
|
|
|
Cleveland, OH PMSA |
40,630 |
22,319 |
122% |
|
|
|
Pittsburgh, PA PMSA |
24,938 |
12,755 |
105% |
|
|
|
Chicago, IL PMSA |
639,887 |
325,505 |
104% |
|
|
|
Baltimore, MD MSA |
61,275 |
30,634 |
100% |
|
|
|
Howard County |
28,113 |
16,746 |
147% |
|
|
|
Queen Anne's County |
|
972 |
498 |
105% |
|
|
Carroll County |
|
3,046 |
1,491 |
96% |
|
|
Anne Arundel County |
|
23,211 |
9,944 |
75% |
|
|
Baltimore County |
|
53,784 |
21,281 |
65% |
|
|
Harford County |
|
7,364 |
2,344 |
47% |
|
|
Baltimore City |
|
29,638 |
6,171 |
26% |
|
|
Philadelphia, PA--NJ PMSA |
145,971 |
60,236 |
70% |
|
|
Source: American FactFinder - U.S. Census Bureau
While immigration is important to regional growth, it is less important for innovation. Innovation is a measure best described by diversity indexes and detailed later in this paper. Furthermore, places that are open to immigration do not necessarily number among the leading creative class centers.
Creative Occupations
The creative class, as defined by Richard Florida (2002), consists of the super-creative core and of creative professionals. The super-creative core includes occupations like: scientists, writers, artists, educators, architects, engineers, athletes, entertainers, etc. They add economic value to the region through their creativity. Creative professionals incorporate occupations in knowledge-intensive industries such as: high-tech, financial, legal, health, and business management sector. These professionals engage in creative problem solving that typically requires a high degree of formal education.
Table 9 combines data on both the super-creative core and creative professionals. In the benchmarked industrial areas, super-creative core and creative professional occupations show

Discussion Papers on Entrepreneurship, Growth and Public Policy |
17 |
tremendous increase. Baltimore, once more, ranks fourth with impressive results at the county level.
Table 9
Creative Class Occupations
(Rank Ordered List by Percent Change)
Change 1990-2000
Target Statistical Area |
2000 |
Number |
Percent |
|
Chicago, IL PMSA |
3,034,880 |
1,907,431 |
169% |
|
Cleveland, OH PMSA |
797,622 |
479,935 |
151% |
|
Pittsburgh, PA PMSA |
860,316 |
500,473 |
139% |
|
Baltimore, MD MSA |
1,085,823 |
605,048 |
126% |
|
Howard County |
160,244 |
101,607 |
173% |
|
Carroll County |
|
62,562 |
39,092 |
167% |
Queen Ann's County |
|
16,119 |
10,036 |
165% |
Harford County, |
|
91,669 |
55,276 |
152% |
Anne Arundel County |
|
211,545 |
121,580 |
135% |
Baltimore County |
|
332,903 |
185,977 |
127% |
Baltimore City |
|
210,781 |
91,480 |
77% |
Philadelphia, PA--NJ PMSA |
2,014,021 |
1,110,070 |
123% |
|
Milwaukee, WI PMSA |
585,560 |
322,558 |
123% |
|
St. Louis, MO--IL MSA |
976,952 |
527,075 |
117% |
|
Detroit, MI PMSA |
1,519,267 |
788,855 |
108% |
|
Source: American FactFinder - U.S. Census Bureau
Tolerance Dimension
Tolerance is a complex set of relationships that explain how people work and live together to create innovations that stimulate growth through technology and talent. Among the benchmarked MSAs, Baltimore ranks second on the overall tolerance index (see table 10). Creative people are attracted to places that score high on the Gay Index and the Bohemian Index, the main components of the overall Tolerance Index.

Discussion Papers on Entrepreneurship, Growth and Public Policy |
18 |
Table 10
Tolerance Index Ranking for Benchmarked Statistical Areas
(Rank Ordered List)
Target Statistical Area |
Tolerance Index |
Chicago IL |
0.724 |
Baltimore MD |
0.671 |
Philadelphia NJ-PA |
0.595 |
Detroit MI |
0.534 |
Milwaukee WI |
0.525 |
Cleveland OH |
0.436 |
St. Louis IL-MO |
0.408 |
Pittsburgh PA |
0.242 |
Source: Kevin Stolarick, PhD - Carnegie Mellon University
A measure of a region’s openness to diversity is its tolerance towards individuals’ sexual orientation. The Gay Index ranks a region based on its openness to the gay and lesbian population, and is a good measure of diversity because gays have been subject to discrimination. The Gay Index is a very strong predictor of a region’s high-tech industry concentration. This does not indicate a correlation between high-tech professionals and their sexual orientation. It simply means that open areas that tolerate diversity are favored by the creative class worker. Among the benchmarked MSAs, Baltimore is the most open to diversity (see table 11).
Table 11
Gay Index For Bechmarked Statistical Areas
(Rank Ordered List)
Target Statistical Area |
Gay Index |
Baltimore MD |
1.02 |
Chicago IL |
0.98 |
Philadelphia NJ-PA |
0.96 |
Milwaukee WI |
0.75 |
Cleveland OH |
0.74 |
St. Louis IL-MO |
0.72 |
Detroit MI |
0.69 |
Pittsburgh PA |
0.64 |
Source: Kevin Stolarick, PhD - Carnegie Mellon University
On the other hand, Baltimore ranks only sixth on the Bohemian Index scale just before Pittsburgh and Cleveland (see table 12). The Bohemian Index takes into account the extent to which the region fosters artists, performers, musicians, etc. and their lifestyles. In a recent

Discussion Papers on Entrepreneurship, Growth and Public Policy |
19 |
national listing of musical and entertainment events by state, Maryland—including the Baltimore MSA—had absolutely nothing scheduled. A region that does not organize artistic events fails to provide stimuli that attract creative artists.
Table 12
Bohemian Index For Bechmarked Statistical Areas
(Rank Ordered List)
Target Statistical Area |
Bohemian Index |
Chicago IL |
1.14 |
Detroit MI |
1.10 |
Milwaukee WI |
1.08 |
Philadelphia NJ-PA |
1.00 |
St. Louis IL-MO |
0.98 |
Baltimore MD |
0.91 |
Pittsburgh PA |
0.88 |
Cleveland OH |
0.87 |
Source: Kevin Stolarick, PhD - Carnegie Mellon University
Florida (2002) makes a distinction between smaller-scale street-level amenities and the traditional big-ticket attractions like professional sports, museums, the symphony, opera, etc. Baltimore is blessed with several such attractions—i.e. the Orioles Stadium and Baltimore Symphony Orchestra—yet Florida found little evidence that big-ticket attractions are effective at attracting talented people and generating high-tech industries. Cultural amenities that are appealing to the creative class are: vibrant street life, readily available outdoor recreation, and a cutting-edge music scene. These vital and potentially effective street-level amenities have been neglected in Baltimore, which gives rise to serious concern.
Technology Dimension
The Technology dimension is quantified by the Technology Index and Innovation Index. Both innovation and high-tech industry are strongly associated with locations of the creative class and of talent in general. Fifteen of the top twenty high-tech regions also rank among the top