

Литература / UMTS-Report
.pdfUMTS 30.06 version 3.0.0 |
61 |
TR 101 146 V3.0.0 (1997-12) |
3. PERFORMANCE EVALUATION
As a part of the work in the ETSI/SMG2 concept group Alpha, Wideband DS-CDMA, a performance evaluation of the WCDMA concept has been carried out by means of simulation for the FDD mode. Results exist also for the TDD mode, but not for the prioritised test cases.
The SMG document UMTS 30.03 (“30.03”) [2] describes how this evaluation is to be made. It lists a large number of environments and services to be tested. In Tdoc SMG2 260/97 [3] a subset of all these test cases are listed as prioritised. In addition to this, at SMG2#23 some additional test cases were identified, see Tdoc SMG2 329/97 [4]. Simulation results obtained so far are for the test cases described in these two documents. The prioritised simulations from Tdoc SMG2 260/97 and Tdoc SMG2 329/97 are shown in Table 3.
Environment |
Service mixture |
Propagation model |
Cell |
Link |
System |
|
|
|
type |
level |
level |
|
|
|
|
|
|
Outdoor to indoor |
UDD 384 |
Outdoor to indoor |
Micro |
X |
X |
and pedestrian |
Speech |
and pedestrian A |
|
X |
X |
|
|
|
|||
3 km/h |
LCD 144 |
|
|
X |
|
|
|
|
|
||
|
UDD 2048 |
|
|
X |
|
|
|
|
|
|
|
Indoor office |
UDD 2048 |
Indoor office A |
Pico |
X |
X |
3 km/h |
Speech |
|
|
X |
|
|
LCD 384 |
|
|
X |
|
|
50% speech + 50% UDD 384 |
|
|
|
X |
|
LCD 2048 |
|
|
(X) |
(X) |
|
|
|
|
|
|
Vehicular |
UDD 144 |
Vehicular A |
Macro |
X |
|
120 km/h |
Speech |
|
|
X |
X |
|
LCD 384 |
|
|
X |
X |
|
50 % speech + 50 % UDD 384 |
|
|
(X) |
(X) |
|
|
|
|
|
|
Vehicular |
Speech |
Vehicular B |
Macro |
(X) |
|
120 km/h |
|
|
|
|
|
|
|
|
|
|
|
Vehicular |
Speech |
Vehicular B |
Macro |
(X) |
|
250 km/h |
|
|
|
|
|
|
|
|
|
|
|
Table 3. Required simulations according to Tdoc SMG2 260/97 and Tdoc SMG2 329/97. Optional results in brackets.
This document contains the WCDMA simulation results for the services in Table 3. Compared to the results presented in the draft 1.0 version of the Evaluation document [7], a number of improvements have been made, both on link-level and system-level. Also, results are presented for those services where results were missing in the previous version of this document.
3.1 Implementation of WCDMA/FDD simulations
For the moment the most comprehensive WCDMA simulation results come from the original FRAMES FMA2 proposal. In this section, the FMA2 simulation results are reported. However, the WCDMA concept differs in some areas compared to the FMA2 concept. The largest difference is that the WCDMA concept uses time multiplexed control information in the downlink while FMA2 uses code/IQ
UMTS 30.06 version 3.0.0 |
62 |
TR 101 146 V3.0.0 (1997-12) |
multiplexing in both links. Hence, the simulation chain does not agree fully with the current WCDMA group concept. However, this difference between time and IQ/code multiplexing has been evaluated, and is being further evaluated, and there is evidence that there is no major performance difference between the two techniques. It can even be argued that the current WCDMA concept should have slightly better downlink performance compared to the original FMA2 downlink. The downlink performance figures presented here should then be slightly pessimistic.
Also, simulations performed by NEC agree well with the results obtained with the FMA2 simulation
chain. The NEC simulations were done with time multiplexing in both uplink and downlink, and are described in [5].
3.1.1 Link-Level Simulations
3.1.1.1 Simulation Model
The WCDMA system description is the basis for the simulation model. However, the downlink simulations use the original FMA2 downlink, described in [1]. Once again one should note that the performance is basically the same.
In the simulations sampling was made at chip level, i.e. with no oversampling and no pulse-shaping filters. Comparative simulations showed negligible performance differences between the filtered and non-filtered case.
Fast power control is included in all simulations. Instead of sending the uplink power control commands on the downlink and vice versa, power control commands are passed through a binary symmetric channel with error probability of 1 %. Simulations have verified that the 1 % error probability agrees well with real errors on transmitted power control commands. Link-level simulations assume unlimited dynamic range for the fast power control, and the delay in the power control loop is one slot. The power amplifier is not modelled, i.e. an ideal amplifier is assumed.
The uplink simulations assume receiver antenna diversity with zero correlation between the antennas, while the downlink assumes one receiver antenna only. Ordinary RAKE reception is used in all simulations. Channel estimation is done through simple averaging of pilot symbols from two consecutive slots.
A fixed searcher is used in the receiver, i.e. the receiver knows the delay of all rays and picks up the energy of some rays using a fixed set of fingers in the RAKE. In the section on channel models the rays picked up by the RAKE are shown.
All interference is modelled as additive white Gaussian noise.
3.1.1.2 Searcher Performance
This chapter shows the results on the practical serarcher in WCDMA derived from the testbed results presented in Tdoc SMG2 UMTS A41/97, [6]. The searcher used in the evaluation consisted of the following steps:
∙Correlation between the received signal and the spreading code is calculated at each pilot symbol position with the specified timing resolution.
∙Complex correlation values at the step 1 are summed up over the time length-1 (vector integration time) after removing pilot modulation for SINR improvement.
∙Squared value of the summation obtained at the step 2 is summed up over the time length-2 (power integration time) for noise and interference smoothing.
∙Path timings are selected in descending order from the timings with large squared value given at the step 3.
The number of path timings to be selected was equal to the number of fingers of the RAKE receiver at maximum. At step 4, the power level of a path candidate was compared with the noise and interference floor level as well as the level of the first selected path timing (the maximum power) so that path to be selected efficiently contributes to the path diversity effect at the RAKE receiver. The guard time is also introduced between the path timing already chosen and a path candidate for path separation. In order to
UMTS 30.06 version 3.0.0 |
63 |
TR 101 146 V3.0.0 (1997-12) |
utilize path diversity effect due to multipaths coming at very close timing, the performance with the guard time of less than 1 chip duration often outperforms over the one with 1 chip guard time.
The BER performance with the adaptive searcher was compared to the one with fixed searcher, which knows the optimum setting of RAKE fingers in advance. Test were done both with and wihtout power control and the test environment was set to Vehicular B with Doppler frequencies ranging from 5 Hz to 240 Hz. Two antenna branches were used, and one searcher was provided per one antenna branch. Path timings with the four largest powers were set to RAKE receiver fingers out of 8 path timing candidates, each 4 of which were detected by the searcher for each antenna. As a service, LCD 32kbps was used for evaluation.
From the results it can be concluded that the performance degradation due to using the practical searcher is very little, 0.2-0.3 dB at most, if the proper parameter setting is used.
In higher speed environment, though instantaneous power level of each channel path fluctuates due to Rayleigh fading more rapidly, the power level can be averaged for shorter obeservation time at searcher. Therefore, for UMTS link-level simulation, the fixed searcher based on average power level gives a link performance very similar to the one with non-fixed searcher in high speed environment, though it may not enjoy instantaneous path-selection diversity effect which only gives a small fraction of dB at most.
In practical environment, path timings (channel profile) vary according to the change of radio propagation. The higher the speed becomes, the more rapid change occurs in channel profile. This factor has not been considered in the UTRA link-level simulation based on 04.02. It is partly because the practical modeling of channel profile change is very difficult. But the main reason, we believe, is that properly designed searcher can track this channel change without significant performance degradation, which is explained below.
A good measure of this channel change is the de-correlation length of the long-term fading, at which the auto-correlation of shadowing becomes 0.5. A typical de-correlation length for vehicular environment is 20 m[2], which takes 288 ms when travelling at 250 km/h. With 80 ms path search time, the autocorrelation of shadowing based on the calculation in [2] is 0.82 at 250 km/h and 0.68 at 500 km/h. The studies for different seracher times have shown that degradation is at most 1 dB at BER of 10-3 with path search time of 20 ms, in the case of which the auto-correlation of shadowing is 0.95 at 250 km/h and 0.82 at 500 km/h. Therefore, the channel profile change is not so great even in high-speed vehicular environment. Thus a properly designed searcher tracks channel changes in practical situations without causing significant degradation in performance.
Thus it can be concluded that no significant performance degradation is caused by the implemented searcher. Also, the discussion indicates that path timing change is not so rapid to make searcher output obsolete at practical vehicle speeds. The studies done conclude that properly designed searcher gives no significant degradation to link-level performance in WCDMA and also that simulation results in the Alpha group evaluation document can be used for the performance comparison with other groups’ results, if other groups also take the proper assumption into account.
3.1.1.3 Channel Models
The channel models given in 30.03 cannot be used right away, since the time resolution of the simulation model is one sample. For the simulations the following modelling of the 30.03 channel models was used:
Each ray is split into two rays, one to the sample to the left and one to the sample to the right. The power of these new rays is such that the sum is equal to the original power, and the power of each of the new rays is inversely proportional to the distance to the original ray. Finally, the power of all rays on one sample are added up and normalised. This yields a model with a number of independently Rayleigh fading rays on the sampling instants.
In the Vehicular B channel the delay spread is very large, so moving the rays to the nearest sampling instant have only marginal impact on the look of the impulse response. Hence, for this channel the rays have been moved instead of interpolated to sampling instants.
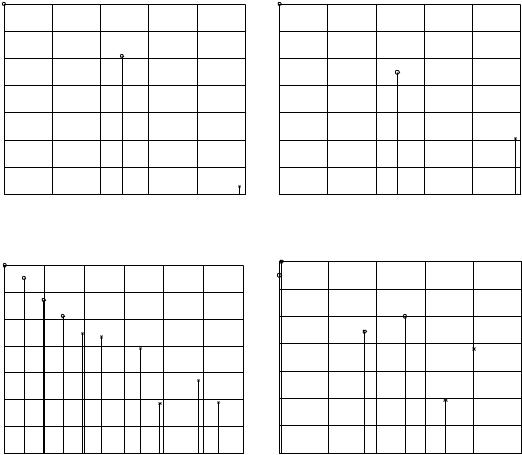
In the simulations the sampling time is equal to the chip time, resulting in the channel models in Figure 38 that were used in simulations.
UMTS 30.06 version 3.0.0 |
64 |
TR 101 146 V3.0.0 (1997-12) |
Average power [dB]
Average power [dB]
0
−5
−10
−15
−20
−25
−30
−35
0
0
−5
−10
−15
−20
−25
−30
−35
0
Indoor office A
|
|
|
|
|
|
|
0 |
|
|
|
|
|
|
|
−5 |
|
|
|
|
|
|
[dB] |
−10 |
|
|
|
|
|
|
|
|
|
|
|
|
|
|
power |
−15 |
|
|
|
|
|
|
Average |
−20 |
|
|
|
|
|
|
|
|
|
|
|
|
|
|
|
−25 |
|
|
|
|
|
|
|
−30 |
100 |
200 |
300 |
400 |
500 |
|
−35 |
|
|
0 |
||||||
|
Relative delay [ns] |
|
|
|
|
||
|
Vehicular A |
|
|
|
|
0 |
|
|
|
|
|
|
|
|
|
|
|
|
|
|
|
|
−5 |
|
|
|
|
|
|
[dB] |
−10 |
|
|
|
|
|
|
|
|
|
|
|
|
|
|
power |
−15 |
|
|
|
|
|
|
Average |
−20 |
|
|
|
|
|
|
|
|
|
|
|
|
|
|
|
−25 |
|
|
|
|
|
|
|
−30 |
500 |
1000 |
1500 |
2000 |
2500 |
3000 |
|
−35 |
|
0 |
||||||
Relative delay [ns]
Indoor to outdoor and pedestrian A
100 |
200 |
300 |
400 |
500 |
|
Relative delay [ns] |
|
|
|
Vehicular B
5 |
10 |
15 |
20 |
25 |
|
Relative delay [us] |
|
|
|
Figure 38. Modified channel models used in the simulations.
The rays picked up by the RAKE receiver are marked with “o” in the figure, while other rays are marked “x”. No special link simulations were made for soft handover situations. In a soft handover the result from two single connection RAKEs are combined. For the Vehicular case this would mean 8 RAKE fingers. However, the number of RAKE fingers can be lowered in soft handover without affecting the performance, so 4 - 6 fingers should suffice.
Simulations have been made for mobile station speeds of 3, 120 and 250 km/h, corresponding to Doppler frequencies of 5.6, 213 and 444 Hz respectively for the uplink.
3.1.2 System-Level Simulations
3.1.2.1 Simulation Environment
The simulation environments are described in 30.03. Implementation assumptions are described below.
The Outdoor to indoor and pedestrian deployment environment is a Manhattan-like environment with the block size of 200 m and low speed (3 km/h) users. The environment consists of 72 base stations and are located as described in 30.03. The base stations are using omni-directional antennas and are deployed 10 m above ground, which is below the roof tops. The radio propagation going above roof tops is also included in the system simulation model. The street width is 30 m and it is assumed that the pedestrians are moving in the middle of the street.
The Indoor office environment characterises a three floors office building where users are moving (3 km/h) between an office room to the corridor or vice versa. The base stations (60 base stations all using omni-directional antennas) are deployed in every second office room.
The Vehicular environment is a classic macro environment with site-to-site distance of 6 km. Trisectored sites are used, i.e. each site is serving three sectors (cells). The speed of the mobile stations is
UMTS 30.06 version 3.0.0 |
65 |
TR 101 146 V3.0.0 (1997-12) |
120 km/h. Wrap around is used in order to make an infinite cell plan, i.e. there are no border effects in the simulations.
3.1.2.2 Downlink Orthogonality
The downlink will not be perfectly orthogonal due to multipath propagation. The downlink orthogonality factor, i.e. the fraction of the total output power that will be experienced as intra-cell interference, has been calculated for the different environments and is presented in Table 4. An orthogonality factor of zero corresponds to a perfectly orthogonal downlink, while a factor of one is a completely non-orthogonal downlink. As seen in the table below, 40% of the power transmitted from the own cell will act as intra-cell interference in the Vehicular environment.
Propagation model |
Orthogonality factor |
|
|
Indoor office A |
0.10 |
|
|
Outdoor to indoor and |
0.06 |
pedestrian A |
|
|
|
Vehicular A |
0.40 |
|
|
Table 4. Orthogonality factor for the environments’ different propagation models.
The orthogonality factor has been derived in the following way:
Two simulations were made, one with white Gaussian noise and one with intra-cell interference. The BER was then plotted as a function of Eb/No and Eb/Io respectively. These curves may differ significantly, where the Eb/Io curve is to the left of the Eb/No curve. A difference of 10 dB means that a given Eb/Io gives the same BER as Eb/No = Eb/Io + 10. Consequently, a certain Io in the system simulations is equivalent to having 10 dB less No in the link-level simulations. Hence, one can say that the orthogonality removes 90% of the interference, or we have an orthogonality factor of 10% (10% of the interference remains).
3.1.2.3 Soft / Softer Data Combining
For the Indoor office and the Outdoor to indoor and pedestrian environment soft handover is used between base stations. This means that the uplink C/I (or SIR = PG×C/I) is calculated as selection
diversity and the downlink as maximum ratio combining (a sum of the received C/I from each base station). For the Vehicular environment softer handover is used, i.e. the mobile is connected to several sectors belonging to the same site, which will affect the calculation of the uplink C/I. Therefore the uplink C/I for all sectors belonging to one site is calculated as maximum ratio combining. Soft handover in the Vehicular environment is treated as regular selection diversity.
The softer handover data combining (maximum ratio combining) is performed on layer 1 in the WCDMA concept. Softer handover is used only in the Vehicular environment. In the uplink and downlink the SIR during softer handover is modelled as:
SIRcombined = åSIRsec tor sec tors
The combined downlink (maximum ratio combining) SIR during soft handover is modelled as:
SIRDL,combined = åSIRsec tors sec tors
The combined uplink (selection diversity) SIR during soft handover is modelled as:
SIRUL,combined = max(SIRsec tor ) sec tors
3.1.2.4 Increase in TX Power due to Power Control
One effect of the fast power control is that the transmitted power from each mobile will vary with time, and this can cause an increase in background interference power.
UMTS 30.06 version 3.0.0 |
66 |
TR 101 146 V3.0.0 (1997-12) |
For the speech service the average transmitter power increase is used when calculating the interference to other cells (the power increase will not affect the own cell). A good model of the power increase is perfect tracking of the fast fading. This assumption is valid only for the 3 km/h cases (Indoor office and Outdoor to indoor and pedestrian). The power increase in the Vehicular environment is negligible since the power control cannot track the fading, and is therefore not included in the system simulations.
For the UDD simulations fast fading values from the link-level simulations are used in the system-level simulator to adjust the output power of the transmitters for each frame. This means that for each frame a new fading value will be used when calculating the gain matrix (including path loss, shadow fading and fast fading).
3.1.2.5 Radio Resource Management
Fast SIR based power control is assumed in both uplink and downlink, and the power of the transmitters are balanced to meet the averaged SIR during one frame.
The downlink power control may introduce a “near-far” problem if a user near the base station is interfered by the power transmitted to a user at the cell border, due to a non-orthogonal downlink. This problem is avoided by having a limited dynamic range in the downlink. A 20 dB dynamic range per bearer (traffic channel) is assumed in the simulations.
Soft/softer handover is used for the circuit-switched services. The soft/softer handover algorithm simply connects the strongest, based on pathloss (excluding fast fading), base stations within the handover window. The soft/softer handover window threshold is set to 3 dB and the algorithm is executed every 0.5 second and the maximum active set size is two. No significant performance improvement is expected by having an active set size of three or more in these environments. Measurement errors are not included. No soft handover is currently used in the packet simulations; the user simply connects to the strongest base station.
For the UDD service dedicated channel packet transmission is used. No random access / forward access signalling is included in the results.
We assume that a RLC block can be re-transmitted in the next frame, i.e. that the ACK/NACK channel is error free and infinitely fast. A packet data user is queued if no resources are available. If there is a choice between queuing two users, the latest arrived user is queued.
3.1.2.6 Performance Measures
Circuit-Switched Services
Two circuit-switched services, speech and LCD 384, have been evaluated by means of dynamic system simulations. The performance measure of the speech (8 kbps, 50% voice activity) and LCD 384 services is that 98% of the users are satisfied. A user is satisfied if all three of the following constraints are fulfilled:
1.The user does not get blocked when arriving to the system.
2.The user has sufficiently good quality more than 95% of the session time. The quality threshold is defined as BER =10-3 (speech) or BER = 10-6 (LCD).
3.The user does not get dropped. A speech user is dropped if BER > 10-3 during 5 s and a LCD 384 user is dropped if BER > 10-6 during 26 s.
Packet Services
Two different packet data services have been evaluated: UDD 384 and UDD 2048.
The performance measure of the packet services is that 98% of the users are satisfied. A user is satisfied if all three of the following constraints are fulfilled:
1.The user does not get blocked.
2.The user does not get dropped.
The active session throughput shall not be below 38.4 kbps (UDD 384) or 204.8 kbps (UDD 2048).
UMTS 30.06 version 3.0.0 |
67 |
TR 101 146 V3.0.0 (1997-12) |
The time waiting on ACK/NACK (i.e. when the transmitter buffer is empty) is not included when calculating the active session throughput. If the data packet that shall be transmitted has less bits than can be transmitted in a frame, dummy bits (or rather dummy blocks) are added. These dummy bits are not included when calculating the session throughput, however they will increase the interference in the system. A data packet will be divided into data blocks of 320 bits (300 information bits). Several blocks are then put into a frame, e.g. 8 blocks per frame for the UDD 384 service. For a detailed description, see section 3.2.1.3.
3.2 Results
3.2.1 Link-Level Simulations
The Eb/No values presented here are the actual Eb/No values needed in the receiver to achieve the corresponding BER, FER and BLER. The Eb/No values include all overhead, i.e. the DPCCH (Dedicated Physical Control Channel: pilot bits, power control bits, FCH) and overhead on the DPDCHs (Dedicated Physical Data Channels) such as CRCs, block numbers and tail bits for the convolutional code. In other words, the Eb value contains all energy needed to transmit one information bit. Energy from common broadcast channels are not included in the link-level results.
The user bit stream is coded using convolutional codes and possibly also a Reed-Solomon code. After coding of the DPDCH rate matching is applied, using puncturing or repetition. On the DPCCH rate matching is always performed using repetition. The rate matching used for the different services are given below, e.g. 9/10 rate matching means “9 bits in, 10 bits out” or repetition of every 9:th bit.
All plots with link-level results are found in Part 3, together with tables specifying the parameters used for the simulations.
3.2.1.1 Speech Service
The speech-service simulations assume a hypothetical 8 kbps speech codec with a user BER requirement of 10-3. The simulations have been carried out with interleaving over one frame only (10 ms) and two frames (20 ms), both of which should satisfy the UMTS requirements of a one-way delay of at most 20 ms. Larger inter-frame interleaving can be applied if more delay is allowed. This would improve performance, especially for medium-speed mobile terminals. A convolutional code of rate 1/3 with constraint length 9 was used for both uplink and downlink. Since the variable rate speech service only has two different bit rates, 0 and 8 kbps, blind rate detection is easily done. Hence, simulations have been made both with and without explicit rate information (FCH, Frame Control Header).
In the simulations the FCH was restricted to two values of the 64 possible. This yields an FCH word error rate of around 10-4 for all environments, which means that the rate detection will have virtually no impact on link quality.
The simulation results are shown in Table 5 below.
UMTS 30.06 version 3.0.0 |
68 |
TR 101 146 V3.0.0 (1997-12) |
Environment & |
|
Eb/N0 @ BER = 10-3 [dB] |
|
|
mobile speed |
|
(Diversity / No diversity) |
|
|
|
|
|
|
|
|
10 ms interl. |
10 ms interl. |
20 ms |
20 ms interl |
|
With FCH |
No FCH |
interl. |
No FCH |
|
|
|
With FCH |
|
|
|
|
|
|
Indoor office A, |
4.2 / 7.4 |
- / 7.1 |
3.7 / - |
3.1 / 6.4 |
3 km/h |
|
|
|
|
|
|
|
|
|
Outdoor to indoor and |
4.5 / 8.0 |
- / 7.5 |
4.1 / - |
3.3 / 6.7 |
pedestrian A, |
|
|
|
|
3 km/h |
|
|
|
|
|
|
|
|
|
Vehicular A, |
6.5 / 9.0 |
- / 8.8 |
6.1 / 8.0 |
5.0 / 7.6 |
120 km/h |
|
|
|
|
|
|
|
|
|
Vehicular B, |
|
|
|
4.9 / 7.7 |
120 km/h |
|
|
|
|
|
|
|
|
|
Vehicular B, |
7.0 / - |
|
6.4 / - |
6.0 / 8.2 |
250 km/h |
|
|
|
|
|
|
|
|
|
Table 5. Link-level results, speech 8 kbps service.
3.2.1.2 LCD Services
In order to reach the BER=10-6 requirement for LCD services, outer Reed-Solomon coding of rate 4/5 is used together with an inner convolutional code and interleaving over 120 ms. The inner convolutional coding is made over one frame or part of a frame.
LCD 144, 384 and 2048 have been simulated in different environments. The LCD 144 uses an inner convolutional code of rate 1/3, while the LCD 384 and 2048 services use a rate of 1/2.
Results are found in Table 6 below. The values without antenna diversity have been estimated from the simulated case with antenna diversity. Based on the speech and UDD simulations, a difference of 3 dB is assumed for the Indoor office and Outdoor to indoor and pedestrian environments, while a difference of 2.5 dB is assumed for the Vehicular environment.
|
Service |
Environment & |
Eb/N0 @ BER = 10-6 [dB] |
|
|
mobile speed |
(Diversity / No diversity) |
|
|
|
|
|
LCD 144 |
Outdoor to indoor and pedestrian A, |
1.3 / 4.3 |
|
|
3 km/h |
|
|
|
|
|
|
LCD 384 |
Indoor office A, |
2.1 / 5.1 |
|
|
3 km/h |
|
|
|
|
|
|
|
Vehicular A, |
3.1 / 5.6 |
|
|
120 km/h |
|
|
|
|
|
|
LCD 2048 |
Indoor office A, |
3.0 / 6.0 |
|
|
3 km/h |
|
|
|
|
|
|
|
Table 6. Link-level results, LCD services. |
|
3.2.1.3 UDD Services |
|
|
|
For the UDD services, packets to be transmitted are divided into blocks of 320 bits each, which constitutes the retransmittable unit. The user data rates that have been simulated are 240 kbps, 480 kbps, and 2.4 Mbps. These rates are then used in the system-level simulations to get an active
UMTS 30.06 version 3.0.0 |
69 |
TR 101 146 V3.0.0 (1997-12) |
session throughput of at least 10 % of the packet bit rate. The 320 bit blocks includes data, CRC, block number, and encoder tail.
Rate 1/2 convolutional coding with constraint length 9 is used, and on top of that an ARQ protocol. However, the effects of ARQ are included in the system-level simulations. The aim of the link-level simulations is to find the required Eb/No to achieve certain BLERs. Interleaving is made over one or two frames (10-20 ms).
The performance of the FCH is very good for these services. Since the power of the DPCCH can be relatively high and still not affect the overhead too much, the FCH error rate is much less than 10-4 for the target BLER when there are 8 different FCH words to distinguish between.
Results are found in Table 7 below.
Service |
Environment & |
Link-level |
Eb/N0 @ BLER = 10% [dB] |
|
mobile speed |
bit rate [kbps] |
(Diversity / No diversity) |
|
|
|
|
UDD 144 |
Vehicular A, |
240 |
1.9 / 4.2 |
|
120 km/h |
|
|
|
|
|
|
UDD 384 |
Indoor office A, |
240 |
0.2 1 / 2.8 |
|
3 km/h |
|
|
|
|
|
|
|
Outdoor to indoor and pedestrian A, |
240 |
0.2 / 3.2 2 |
|
3 km/h |
|
|
|
|
|
|
UDD 2048 |
Indoor office A, |
480 |
0.2 / 2.8 |
|
3 km/h |
|
|
|
|
|
|
|
|
2400 |
0.7 / 3.3 3 |
|
|
|
|
|
Outdoor to indoor and pedestrian A, |
480 |
0.2 / 3.2 |
|
3 km/h |
|
|
|
|
|
|
|
|
2400 |
0.6 / 3.6 3 |
|
|
|
|
Table 7. Link-level results, UDD services.
Note 1: The simulation without antenna diversity shows that equal Eb/N0 performance can be obtained for 240 and 480 kbps bearers. The 240 kbps figure with antenna diversity is thus assumed to be the same as the corresponding 480 kbps figure.
Note 2: The simulation with antenna diversity shows that equal Eb/N0 performance can be obtained for 240 and 480 kbps bearers. The 240 kbps figure without antenna diversity is thus assumed to be the same as the corresponding 480 kbps figure.
Note 3: Estimated value without antenna diversity based on Eb/N0 difference between 480 and 2400 kbps with antenna diversity.
3.2.2 System-Level Simulations
Dynamic system simulations have been performed for three different services in three different environments described in 30.03. In these simulations all base stations are assumed to be equipped with one 4.096 Mcps WCDMA carrier using 5 MHz carrier spacing (assuming 3 carriers within 15 MHz). It is likely that the concept will perform better if a larger bandwidth is used for higher data rates due to a better truncing efficiency. Therefore all results of higher data rate services shall be regarded as pessimistic results. Also, the simulations of the UDD services have only used a fixed bit-rate radio bearer, which will also decrease the performance of the UDD services.
The system simulation parameters are listed more in detail in Part 3.
3.2.2.1 Circuit-Switched Services
Two circuit-switched services, speech and LCD 384, have been evaluated by means of dynamic system simulations. The performance measure of the speech (8 kbps, 50% voice activity) and LCD 384
UMTS 30.06 version 3.0.0 |
70 |
TR 101 146 V3.0.0 (1997-12) |
services is that 98% of the users are satisfied. No admission control has been used, therefore no users are blocked. Also, the simulation results show that cell capacity in all cases is limited by the requirement that a satisfied user must have sufficiently good quality more than 95% of the session time and not by the dropping criteria. This mean that we have no blocking nor dropping in these simulation results, hence the offered load (Erlang capacity) is same as the served load.
The WCDMA concept uses fast power control also in downlink. This means that slow moving users can compensate for the fast channel fading, hence no substantial diversity gain from connecting more base stations (i.e. increase the maximum number of active set) is seen. Connecting more base stations will only increase the required capacity of base station to base station controller transmission. High speed users do not require good tracking of the fast channel fading due to the gain from coding and interleaving.
The system simulation parameters are listed in Part 3. In Table 8 speech results are found for 20 ms interleaving. LCD results are presented in Table 9.
The speech service is evaluated using 50% voice activity. However, the DPCCH is transmitted with constant bit-rate independent of the speech user information rate (8 kbps or 0 kbps information bit-rate). Therefore, the spectrum efficiency will increase more than 30% if a voice activity of 100% is used, due to the decreased DPCCH (relative) overhead.
A C/I based soft handover algorithm has been studied in the Outdoor to indoor and pedestrian environment, in order to show the improvements that can be achieved by such an algorithm. The basic strategy behind the C/I based algorithm is that the MSs connect to the BS/BSs that requires the lowest amount of output power. Since the handover decision is network evaluated in this case, the MSs still measure the pathlosses to different BSs and report them to the network. In the new scheme, the interference received at the different BSs is also added to the handover decision. Thus, no signaling of interference levels is required over the air interface. The increase in uplink spectrum efficiency (from 127 to 189 kbps/MHz/cell) is due to the load sharing, i.e. the downlink will be the limited link in that case. Another way to achieve a similar load sharing effect is to have a large active set and a large handover margin. The evident disadvantage of that approach is the increased number of mobiles in soft handover.
Service |
Environment |
Eb/No @ BER = 10-3 |
Cell capacity |
Spectrum efficiency |
|
|
[dB] |
[Erlang/carrier/cell] |
[kbps/MHz/cell] |
|
|
(UL / DL) |
(UL / DL) |
(UL / DL) |
|
|
|
|
|
Speech |
Outdoor to |
3.3 / 6.7 |
159 / 204 |
127 / 163 |
(8 kbps, 50% VA) |
indoor and |
|
237 / - |
189 / - (C/I based HO) |
pedestrian A |
|
|||
|
|
|
|
|
|
|
|
|
|
|
Vehicular A |
5.0 / 7.6 |
123 / 98 |
98 / 78 |
|
|
|
|
|
Table 8. Spectrum efficiency of the speech service: 8 kbps, 50% voice activity, 20 ms interleaving.