UMTS 30.06 version 3.0.0 |
241 |
TR 101 146 V3.0.0 (1997-12) |
Percentage of Blocked User
0.14
0.13
0.12 

 600 channel per cell
32 channel per cell
0.11
0.10
0.09
0.08
0.07
0.06
0.05
0.04
0.03
0.02
0.01
0.00
-0.01 


 110 115 120 125 130 135 140 145 150 155 160
Accomodated load (kbps/MHz/cell)
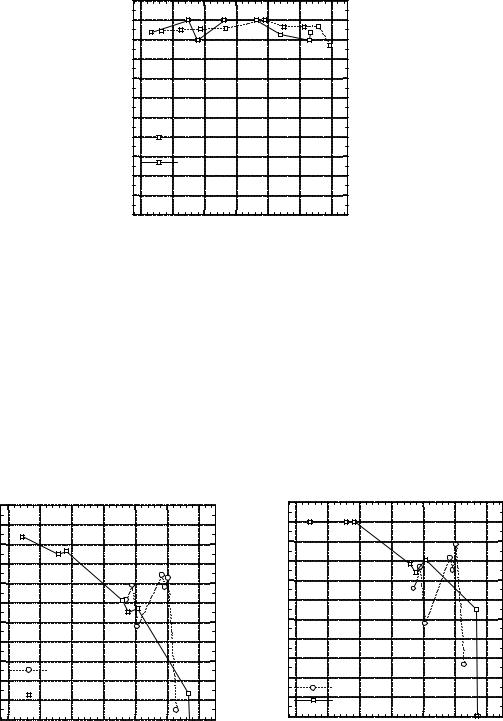
Figure 41: Blocking versus Load
It can be seen than at a load of 135kbps/MHz/cell, blocking does not occur. For a speech service with 15MHz system bandwidth blocking can therefore be ignored. Additionally, at 32 channels per cell case, it is impossible to achieve a load of greater than 135 kbps/MHz/cell.
The system level simulation used a simulation time of only 120s to collect the statistical values for the evaluation of speech service scenario. Ideally a longer time is needed and results with a longer time will be provided before December.
For each environment (Pedestrian/Vehicular), quality statistical are only measured on marked BS which are allocated in the middle of the assumed service area. For evaluation of the pedestrian environment 66 base stations are needed to cover the whole of the service area including 6 marked BS. For evaluation of the vehicular environment 21 base stations are needed to cover the service area including 3 marked BS.
12.1.2 Statistical calculations
1)System load
The system load is calculated in the whole service area using the equation in document
ETR 0402. The calculated system load does not include blocked user.
1.Number of handoffs per call
This value is also calculated for the whole of the service area, by counting all handoff execution and number of total calls generated during the observation duration.
2.Blocked users
Blocked users are only collected at marked BS, although blocking occurs at other base stations. Each new MS attempts to connect to the BS which has the lowest pathloss and long term fading. Blocking occurs when this is a shortage of channels (no more logical channels available at this BS).
3.Dropped users
Dropped users are only collected at marked BS, though dropping might occur at other base stations, as described in ETR-0402. Connections will drop according to condition described in ETR 0402.
4.Not satisfied users
Not satisfied users are calculated according to conditions described in ETR-0402.
UMTS 30.06 version 3.0.0 |
242 |
TR 101 146 V3.0.0 (1997-12) |
At every 0.5 seconds, the BER is collected at every connection within the service area. The quality statistical calculation is also performed at every MS which are connected to the marked BS. ( If a MS was originally connected to a ‘marked BS’ as is disconnected during this period it is not included.)
5.Total BER
ETR-0402 does not require to submit this quality statistical value, but it has been calculated as reference. This value is collected for the whole of the service area.
12.1.3 Pathloss calculation
According to ETR-0402, mobiles position should be updated at every shadowing decorrelation length. As OFDMA operates fast power control, discrete mobility of MS is not acceptable for precise evaluation. Samples of long term fading value are therefore collected at every decorrelation length and interpolation performed for calculating long term fading for every point between the discrete samples of the long term fading.
12.1.4 Fading calculation
Fading is created according to the channel impulse response model described in section B.1.4.2 of ETR-0402. The total number of fading spectors is set to 16. The fading envelope is calculated for each diversity antenna branch. The distance between diversity antenna is set as 7.5cm (at MS).
12.1.5 Neighbour BS Information
All BS inside the system area have a priori knowledge of neighbour BS. This information is used for cell search and handoff.
12.1.6 Interference Restriction
This procedure reduces the simulation time. To be precise the co-channel interference power should be collected from all cells. However, the total interference power is dominated by a couple of relatively large interferes. For instance, a -20dB interference from 1 MS is much larger than the sum of -40dB interference from 10 or more MS. In the simulation therefore, the interference power is calculated by restricting the source of interference as follows.
L1[dB] is defined as the pathloss between MS being considered and its connected BS. This base station is named Bsa.
L2[dB] is defined as the pathloss between MS and other cell's BS. These basestations are named BSx.
1) If L1 + Threshold < L2,
To BSx, up link interference from this MS should be omitted. To this MS, down link interference from BSx should be omitted.
Threshold is set to 35[dB].
Each MS will therefore search all interference candidates from the BS and check to see it is visible from the MS location. If candidate is not treated as visible, then this MS will ignore it when calculating interference.
This procedure is done at every update of the MS position. For uplink the same procedure is used.
UMTS 30.06 version 3.0.0 |
243 |
TR 101 146 V3.0.0 (1997-12) |
12.1.7 Traffic Management
Circuit switched traffic is expressed by the Poisson process with additional minimum call duration, according to ETR-0402. Each call is generated after calculated interval from previous call generation. Calls will be terminated when call termination timer is expired, or when call is forced to be dropped. Dropped calls occur according to condition described in ETR-0402. At system level simulation, 1 MS is used for initialisation and the number of communicating MS increases rapidly during the first 10 seconds. The total traffic then reaches input load with some variation according to Poisson process.
If activity factor is 100%, then ON state will last until call termination. If activity factor is not 100%, then another call state will be selected at each state of timer expiration. ON state and OFF state timer are set according to description in ETR-0402. During the OFF duration, ACCH is transmitted with a lower bit rate (1/4 or 1/8 compared to continuous TCH transmission) to maintain power control. In the current system level simulation no information is transmitted during the ‘OFF’ state to simplify simulations.
12.1.8 MS Mobility
MS mobility is implemented according to ETR-0402 except the frequency of the location updates As described above, the MS location is updated more frequently than the long term fading decorrelation length. The MS location is updated at every 1.15msec which is 1 TDMA frame duration. If the MS moves outside the service area for the vehicular case, the MS is forced to go back in the opposite direction to stay in the service area. In the case of pedestrian, every MS is located in the centre of the street.
12.1.9 Handoff
Handoff is triggered by a simple pathloss comparison which does not including fading attenuation. The MS attempts to connect to the closest BS during handover. Handoff check is initiated every 73.6 msec. If the BS which the MS attempts to create a connection, does not have vacant channel, handoff will fail, and this MS will stay connected to the previous BS.
12.1.10 Power Control
Power control is achieved for every slot by returned power control command. Power control command is returned to transmitter without errors, as ETR-0402 requires to evaluate up/down link separately. Power control step is set to 1dB. Power control command is reflected to exact transmission with some time lag. In case of 4 TDMA structure, returned power control command is reflected 3 TDMA frames later.
In the case of the multi slot usage for higher bit rate transmission, the power control command will be achieved uniquely for 1 time slot unit. Power control command is decided by mean quality among received 1 time slot unit.
12.2 System Level Simulation Results (Speech)
Speech service system capacity (circuit switched service) has been evaluated using dynamic system simulations. A voice activity of 50% is considered.

UMTS 30.06 version 3.0.0 |
244 |
TR 101 146 V3.0.0 (1997-12) |
12.2.1 Outdoor to Indoor and Pedestrian A
The following figures show the speech service spectrum efficiency for an outdoor to Indoor and pedestrian A environment. Figure 42 shows the satisfied user rate versus system load using the described system level simulation.
As explained before, this evaluation is based on system band width of 3.2MHz, considering 15MHz bandwidth we can eliminate all blocked users from the ‘unsatisfied users’. Using the full bandwidth of 15MHz the accommodated load is smaller than 135kbps/MHz/cell, so the actual rate of blocked users is 0% (considering Figure 43 which shows blocked user rate versus system load at 3.2Mhz).
Finally Figure 44 shows the final system level simulation results assuming 15MHz system bandwidth (satisfied user rate versus system load). No dropping was observed at all evaluated system loads, the mean number of handoff procedures per user is 2.7.
It should be noted that OFDMA has the ability to accommodate more than the presented load figures because all plots in Figure 44 show a satisfied user rate above 98%. As described before, we could not measure quality statistics at higher load (occurrence of blocking).
user |
1.01 |
|
|
|
|
|
|
|
1.00 |
|
|
|
|
|
|
|
of |
0.99 |
|
|
|
|
|
|
|
Percentage |
|
|
|
|
|
|
|
0.98 |
|
|
|
|
|
|
|
0.97 |
|
|
|
|
|
|
|
0.96 |
|
|
|
|
|
|
|
|
|
|
|
|
|
|
|
|
0.95 |
|
|
|
|
|
|
|
|
0.94 |
|
|
Down link Satisfied User |
|
|
0.93 |
|
|
(unsatisfied including Blocked User) |
|
|
|
Up link Satisfied User |
|
|
|
|
|
|
|
|
|
0.92 |
|
|
(unsatisfied including Blocked User) |
|
0.91 |
|
|
|
|
|
|
|
|
0.90 |
70 |
80 |
90 |
100 |
110 |
120 |
130 |
|
|
|
|
|
System Load (kbps/cell/MHz) |
1.01 |
|
|
|
|
|
|
|
1.00 |
|
|
|
|
|
|
|
0.99 |
|
|
|
|
|
|
|
0.98 |
|
|
|
|
|
|
|
0.97 |
|
|
|
|
|
|
|
0.96 |
|
|
|
|
|
|
|
0.95 |
|
|
|
|
|
|
|
0.94 |
|
|
|
|
|
|
|
0.93 |
|
|
|
|
|
|
|
0.92 |
|
|
Down link Not Blocked User |
|
|
|
|
|
0.91 |
|
|
Up link Not Blocked User |
|
0.90 |
70 |
80 |
90 |
100 |
110 |
120 |
130 |
System Load (kbps/cell/MHz)
Figure 42: System Bandwidth 3.2MHz |
Figure 43: System Bandwidth 3.2MHz |
UMTS 30.06 version 3.0.0 |
|
|
|
245 |
|
|
TR 101 146 V3.0.0 (1997-12) |
user |
1.01 |
|
|
|
|
|
|
|
1.00 |
|
|
|
|
|
|
|
of |
0.99 |
|
|
|
|
|
|
|
Percentage |
|
|
|
|
|
|
|
0.98 |
|
|
|
|
|
|
|
|
|
|
|
|
|
|
|
|
0.97 |
|
|
|
|
|
|
|
|
0.96 |
|
|
|
|
|
|
|
|
0.95 |
|
|
|
|
|
|
|
|
0.94 |
|
|
Down link Satisfied User |
|
|
0.93 |
|
|
(unsatisfied excluding Blocked User) |
|
|
|
Up link Satisfied User |
|
|
|
|
|
|
|
|
|
0.92 |
|
|
(unsatisfied excluding Blocked User) |
|
0.91 |
|
|
|
|
|
|
|
|
0.90 |
70 |
80 |
90 |
100 |
110 |
120 |
130 |
|
|
|
|
|
System Load (kbps/cell/MHz) |
Figure 44: System Bandwidth 15MHz
12.2.2 Vehicular A
The following figures show the spectrum efficiency for a speech service scenario at Vehicular A environment. Figure 46 shows the satisfied user rate versus system load evaluated by dynamic system level simulation. Figure 45 shows the blocked user rate versus system load and Figure 47 finally gives the system level simulation results assuming 15MHz system bandwidth (here again the assumption of no blocking with a system bandwidth of 15MHz is valid). No dropped users were observed at all evaluated system loads, the mean number of handoff procedures per user is 3.3.
1.01 
1.00
0.99
0.98
0.97
0.96
0.95
0.94
0.93
Down Link Satisfied User
0.92(unsatisfied including blocked user)
0.91 |
|
|
|
|
|
|
|
Down Link Satisfied User |
|
|
|
|
|
|
|
|
|
|
|
|
|
|
|
|
|
|
|
|
(unsatisfied including blocked user) |
0.90 |
|
|
|
|
|
|
|
|
|
|
|
|
|
|
|
|
|
|
|
|
|
|
|
|
|
70 |
80 |
90 |
100 |
110 |
120 |
130 |
|
System Load (kbps/cell/MHz)
user |
1.01 |
|
|
|
|
|
|
|
1.00 |
|
|
|
|
|
|
|
of |
0.99 |
|
|
|
|
|
|
|
Percentage |
|
|
|
|
|
|
|
0.98 |
|
|
|
|
|
|
|
0.97 |
|
|
|
|
|
|
|
0.96 |
|
|
|
|
|
|
|
|
|
|
|
|
|
|
|
|
0.95 |
|
|
|
|
|
|
|
|
0.94 |
|
|
|
|
|
|
|
|
0.93 |
|
|
|
|
|
|
|
|
0.92 |
|
|
Down Link Not Blocked User |
|
|
0.91 |
|
|
|
|
|
|
Up Link Not Blocked User |
|
|
|
|
|
|
|
0.90 |
70 |
80 |
90 |
100 |
110 |
120 |
130 |
|
|
|
|
|
System Load (kbps/cell/MHz) |
Figure 46: System Bandwidth 3.2MHz |
Figure 45: System Bandwidth 3.2MHz |
UMTS 30.06 version 3.0.0 |
246 |
TR 101 146 V3.0.0 (1997-12) |
1.01 
1.00
0.99
0.98
0.97
0.96
0.95
0.94
0.93
Down Link Satisfied User
0.92(unsatisfied excluding blocked user)
0.91 |
|
|
|
|
|
|
|
Up Link Satisfied User |
|
|
|
|
|
|
|
|
|
|
|
|
|
|
|
|
|
|
|
|
|
|
|
|
(unsatisfied excluding blocked user) |
0.90 |
|
|
|
|
|
|
|
|
|
|
|
|
|
|
|
|
|
|
|
|
|
|
|
|
|
70 |
80 |
90 |
100 |
110 |
120 |
130 |
|
System Load (kbps/cell/MHz)
Figure 47: System Bandwidth 15MHz
12.2.3 Indoor Office A
The following figures show the spectrum efficiency for a speech service scenario for the indoor office A environment. Figure 48 shows the satisfied user rate versus system load evaluated by the dynamic system level simulation. Figure 44 shows the blocked user rate versus system load and Figure 50 gives the system level bandwidth of 15MHz is valid). No dropped users were observed at all evaluated system loads. The simulation results assuming 15MHz system bandwidth (here again the assumption of no blocking with a system summarised results are shown in Table 12.
UMTS 30.06 version 3.0.0 |
|
|
247 |
of user |
1.0 |
|
|
|
|
|
|
|
|
|
|
|
|
|
Percentage |
0.9 |
|
|
|
|
|
|
0.8 |
|
|
|
|
|
|
|
|
|
|
|
|
|
|
0.7 |
|
|
|
|
|
|
|
0.6 |
|
Downlink Satisfied User |
|
|
|
Uplink Satisfied User |
|
|
|
|
|
|
|
|
0.5 |
80 |
90 |
100 |
110 |
120 |
130 |
|
70 |
System Load (kbps/MHz/cell)
of user |
1.0 |
|
|
|
|
|
|
|
|
|
|
|
|
|
Percentage |
0.9 |
|
|
|
|
|
|
0.8 |
|
|
|
|
|
|
|
|
|
|
|
|
|
|
0.7 |
|
|
|
|
|
|
|
0.6 |
|
Downlink Not Blocked User |
|
|
|
Uplink Not Blocked User |
|
|
|
|
|
|
0.5 |
80 |
90 |
100 |
110 |
120 |
130 |
|
70 |
|
|
|
|
System Load (kbps/MHz/cell) |
Figure 48 System Bandwidth 3.2 MHz
TR 101 146 V3.0.0 (1997-12)
Figure 49 System Bandwidth 3.2 MHz
user |
1.01 |
|
|
|
|
|
|
1.00 |
|
|
|
|
|
|
of |
|
|
|
|
|
|
|
|
|
|
|
|
|
Percentage |
0.99 |
|
|
|
|
|
|
0.98 |
|
|
|
|
|
|
0.97 |
|
|
|
|
|
|
|
|
|
|
|
|
|
|
0.96 |
|
|
|
|
|
|
|
0.95 |
|
|
|
|
|
|
|
0.94 |
|
|
|
|
|
|
|
0.93 |
|
Downlink Satisfied User |
|
|
0.92 |
|
|
|
|
Uplink Satisfied User |
|
|
|
|
|
|
|
|
0.91 |
|
|
|
|
|
|
|
0.90 |
80 |
90 |
100 |
110 |
120 |
130 |
|
70 |
|
|
|
|
System Load (kbps/MHz/cell) |
Figure 50 System Bandwidth 15 MHz
UMTS 30.06 version 3.0.0 |
248 |
TR 101 146 V3.0.0 (1997-12) |
12.2.4 Speech System Level Simulation (Summary)
Table 12 summarises the system level simulation results for speech services according to ETR0402.
Table 12: Speech System Level Simulation Summary
Service |
Environment |
Cell Capacity |
Spectrum |
|
|
|
(#User/MHz/Cell) |
Efficiency |
Mean BER |
|
|
|
|
(kbps/MHz/Cell) |
|
|
|
(UL/DL) |
(UL/DL) |
(UL/DL) |
Speech |
Indoor Office A |
33.0 |
/ 31.0 |
132 / 124 |
6.5e-5 / 4.0e-5 |
(8kbps, 50% VA) |
|
|
|
|
|
|
Outdoor to Indoor |
30.75 |
/ 32.25 |
123 / 129 |
5.8e-5 / 2.2e-5 |
|
and Pedestrian A |
|
|
|
|
|
Vehicular A |
27.0 |
/ 30.5 |
108 / 122 |
2.1e-4 / 3.7e-4 |
For speech services the BDMA system requires only a very small guard band (e.g. 200kHz or 400kHz on each side) to full fill adjacent system spurious emission requirements. Therefore the results we presented should be normalised by a factor of (15-2*0.4)/15=0.95.
12.3 System Level Simulation Results (LCD 384)
12.3.1 Vehicular A
The following figures show results of the spectrum efficiency simulation of LCD 384kbps services for the Vehicular A environment. For LCD 384kbps service system level simulation, we assume 13.6MHz system bandwidth and the rest of 1.4 MHz as guard band. LCD 384kbps service requires 800kHz bandwidth (8 bandslots) per connection, in total 17 carriers are available to operate LCD 384 services using 13.6MHz.
Two scenarios were simulated, the first simulation uses the maximum transmit power specified in the link budget template(see Table 1.3 in ETR-0402), and the second simulation uses optimised transmitter power2 for the OFDMA SRTT.
Table 13: LCD 384 Concept Optimising Parameters
|
|
|
|
Downlink |
Uplink |
Test Environment |
|
Vehicular A |
Vehicular A |
Test Service |
|
LCD 384 |
LCD 384 |
Concept Optimising Parameters |
|
|
|
Max. TX power per Traffic Channel |
[dBm] |
45.0 |
33.0 |
Average TX power per Traffic Channel |
[dBm] |
44.4 |
32.4 |
TX antenna gain |
[dBi] |
17 |
2 |
|
|
|
|
|
|
2For the down-link the maximum TX power per band-time slot is the same TX power specified in ETR-0402 to support voice services (36.0dBm), therefore no modification in the BS transmitter is necessary to operate a LCD 384kBps service.
For the up-link the maximum TX power of the MS is the same as defined in the GSM specifications (2 W) which is a realistic assumption.
UMTS 30.06 version 3.0.0 |
249 |
TR 101 146 V3.0.0 (1997-12) |
RX antenna gain |
[dBi] |
2 |
17 |
Figure 51 shows the satisfied user rate versus system load and Figure 52 shows the dropped user rate versus system load. No blocking was observed at the simulated system load values. These results are achieved using the specified (ETR0402) maximum transmitter power. We emphasise that because of the fundamental transmitter power shortage, there is no possibility to accommodate a certain amount of users under the (non optimised) conditions described in ETR-0402. We believe this problem is not limited to the OFDMA SRTT. No information can be received if the received Eb/No is smaller than the required Eb/No, this is valid for any radio access scheme.
of user |
0.20 |
|
|
|
|
|
|
|
|
|
|
|
|
|
|
|
|
|
|
|
|
|
|
|
|
|
|
|
|
|
Percentage |
0.15 |
|
|
|
|
|
|
|
Down Link Satisfied User |
|
|
|
|
|
|
|
|
Up Link Satisfied User |
|
0.10 |
|
|
|
|
|
|
|
|
|
|
|
|
|
|
|
|
|
|
|
|
|
|
|
|
|
|
|
|
|
|
|
|
|
|
|
|
|
|
|
|
|
|
|
|
0.05
0.005 |
|
|
|
|
|
|
|
|
30 |
10 |
15 |
20 |
25 |
|
|
|
|
System Load (kbps/cell/MHz) |
Figure 51: Satisfied User Rate
user |
0.50 |
|
|
|
|
|
0.45 |
|
|
|
|
|
of |
0.40 |
|
|
|
|
|
Percentage |
|
|
|
|
|
0.30 |
|
|
|
|
|
|
0.35 |
|
|
|
|
|
|
0.25 |
|
|
|
|
|
|
0.20 |
|
Down Link Not Droped User |
|
|
|
Up Link Not Dropped User |
|
|
|
|
|
|
0.15 |
|
|
|
|
|
|
0.10 |
|
|
|
|
|
|
0.05 |
|
|
|
|
|
|
0.005 |
10 |
15 |
20 |
25 |
30 |
|
|
|
System Load (kbps/cell/MHz) |
Figure 52: Not Dropped User Rate
Figure 53 shows the satisfied user rate versus system load, and Figure 54 shows blocked user rate versus system load. No dropping was observed at each simulated system load, These results are based on the optimised transmitter power assumption.
user |
1.01 |
|
|
|
|
|
|
|
1.00 |
|
|
|
|
|
|
|
of |
0.99 |
|
|
|
|
|
|
|
Percentage |
|
|
|
|
|
|
|
0.98 |
|
|
|
|
|
|
|
0.97 |
|
|
|
|
|
|
|
0.96 |
|
|
|
|
|
|
|
|
|
|
|
|
|
|
|
|
0.95 |
|
|
|
|
|
|
|
|
0.94 |
|
|
|
|
|
|
|
|
0.93 |
|
|
|
|
|
|
|
|
0.92 |
|
Down Link Satisfied User |
|
|
|
Up Link Satisfied User |
|
|
|
0.91 |
|
|
|
|
|
|
|
|
|
|
|
|
0.90 |
120 |
140 |
160 |
180 |
200 |
220 |
240 |
|
|
|
|
|
|
System Load (kbps/cell/MHz) |
Figure 53: Satisfied User Rate
user |
1.01 |
|
|
|
|
|
|
|
1.00 |
|
|
|
|
|
|
|
of |
0.99 |
|
|
|
|
|
|
|
Percentage |
|
|
|
|
|
|
|
0.98 |
|
|
|
|
|
|
|
0.97 |
|
|
|
|
|
|
|
0.96 |
|
|
|
|
|
|
|
|
|
|
|
|
|
|
|
|
0.95 |
|
|
|
|
|
|
|
|
0.94 |
|
|
|
|
|
|
|
|
0.93 |
|
|
Down Link Not Blocked User |
|
|
|
Up Link Not Blocked User |
|
|
|
|
|
|
|
0.92 |
|
|
|
|
|
|
|
|
0.91 |
|
|
|
|
|
|
|
|
0.90 |
120 |
140 |
160 |
180 |
200 |
220 |
240 |
|
|
|
|
|
|
System Load (kbps/cell/MHz) |
Figure 54: Not blocked User Rate
The following table summarises the results for LCD 384 services.
UMTS 30.06 version 3.0.0 |
250 |
TR 101 146 V3.0.0 (1997-12) |
Table 14: LCD 384 System Level Simulation Summary
Service |
Environment |
Cell Capacity |
Spectrum |
|
|
|
(#User/MHz/Cell) |
Efficiency |
Mean BER |
|
|
|
(kbps/MHz/Cell) |
|
|
|
(UL/DL) |
(UL/DL) |
(UL/DL) |
LCD 384kbps |
Indoor Office A |
T.B.D. / T.B.D. |
T.B.D. / T.B.D. |
T.B.D. / T.B.D. |
(with specified |
|
|
|
|
transmitter |
|
|
|
|
power) |
|
|
|
|
|
Outdoor to Indoor |
T.B.D. / T.B.D. |
T.B.D. / T.B.D. |
T.B.D. / T.B.D. |
|
and Pedestrian A |
|
|
|
|
Vehicular A |
/ |
None / None |
not measured |
LCD 384kbps |
Indoor Office A |
T.B.D. / T.B.D. |
T.B.D. / T.B.D. |
T.B.D. / T.B.D. |
(with optimised |
|
|
|
|
transmitter |
|
|
|
|
power) |
|
|
|
|
|
Outdoor to Indoor |
T.B.D. / T.B.D. |
T.B.D. / T.B.D. |
T.B.D. / T.B.D. |
|
and Pedestrian A |
|
|
|
|
Vehicular A |
/ |
152 / 208 |
not measured |
For 800kHz services like LCD 384kbps, the BDMA system requires approximately 700800kHz guard band to fulfil adjacent system spurious emission requirements. Therefore the results we presented should be normalised by a factor of (15-2*0.7)/15=0.91