

Английский для Тх / ie9503656
.pdfSubscriber access provided by TU BERGAKADEMIE FREIBERG
Article
Bubble Column Reactors for Wastewater Treatment. 1. Theory and Modeling of Continuous Countercurrent Solvent Sublation
Jeffrey S. Smith, Kalliat T. Valsaraj, and Louis J. Thibodeaux
Ind. Eng. Chem. Res., 1996, 35 (5), 1688-1699 • DOI: 10.1021/ie9503656
Downloaded from http://pubs.acs.org on January 29, 2009
More About This Article
Additional resources and features associated with this article are available within the HTML version:
•Supporting Information
•Links to the 1 articles that cite this article, as of the time of this article download
•Access to high resolution figures
•Links to articles and content related to this article
•Copyright permission to reproduce figures and/or text from this article
Industrial & Engineering Chemistry Research is published by the American Chemical Society. 1155 Sixteenth Street N.W., Washington, DC 20036

+ |
+ |
1688 |
Ind. Eng. Chem. Res. 1996, 35, 1688-1699 |
GENERAL RESEARCH
Bubble Column Reactors for Wastewater Treatment. 1. Theory and Modeling of Continuous Countercurrent Solvent Sublation
Jeffrey S. Smith, Kalliat T. Valsaraj,* and Louis J. Thibodeaux
Department of Chemical Engineering, Louisiana State University, Baton Rouge, Louisiana 70803
Solvent sublation is a nonfoaming wastewater treatment process that combines the benefits of bubble fractionation and liquid-liquid extraction in a way that does not require mixers, settlers, or subsequent downstream treatment. A review of past work on small lab-scale batch columns revealed that removal efficiencies of nonvolatile and volatile organic compounds are generally higher than those observed in bubble fractionation, air stripping, and conventional liquid-liquid extraction. In this work, the first of a three-part series, the transport mechanisms in a threephase continuous, countercurrent sublation process are presented. Two mathematical models, namely, the series CSTR model (SCM) and the two-phase axial dispersion model (ADM2), are developed. It is shown that these two models are equivalent and can be used interchangeably with the aid of a simple expression. Nondimensional correlations, based upon simulated data obtained from the SCM, are generated to predict the steady-state fractional removal, FR, and the separation factor, ª (ratio of effluent solvent concentration to effluent water concentration), for strongly hydrophobic compounds. The effects of operational, hydrodynamic, thermodynamic, and design variables on sublation performance are discussed.
Introduction
Processes which exploit the tendency for organic compounds, ions, or particles to adsorb or to attach to air-water interfaces of rising bubbles are generally referred to as ªadsorptive bubble processesº (Sebba, 1962; Karger et al., 1967b; Karger, 1972). There are two types of adsorptive bubble processes, foaming and nonfoaming. In foaming processes, surfactants are introduced to generate a froth or foam for the removal of particles by flotation. In some processes, the particles which are removed are sufficiently hydrophobic that surfactant is not necessary. Important applications include the cleaning and recovery of coal and graphite as well as valuable metals from ores and minerals (Finch and Dobby, 1990). In nonfoaming processes, surfactant may be used, but not under conditions which produce a foam or a froth for flotation purposes. Nonfoaming processes are better suited for wastewater treatment since procedures to collapse and dispose wet foams are not required (Valsaraj, 1995). The classic example of a nonfoaming adsorptive process is bubble fractionation (Lemlich, 1966; Kown and Wang, 1971). Bubble fractionation is basically air-stripping in a bubble column. Other examples of nonfoaming processes are predispersed solvent extraction and solvent sublation (Valsaraj, 1995). These processes are unique in that they blend the benefits of bubble fractionation with other separation processes.
In predispersed solvent extraction, gas (air) and solvent (oil) are mixed with surfactant to generate polyaphrons and colloidal gas aphrons (CGAs) (Michelsen et al., 1986; Caballero et al., 1989). Polyaphrons are globules of oil (95%) and water (5%) that range from submicron to approximately 50 ím in size. They are stabilized in aqueous solutions by thin soap films which
* To whom correspondence should be addressed.
surround each globule. CGAs (25-150 ím) are similar except that they contain gas inside the soap film instead of oil. In the water column, the polyaphrons adhere to the surfaces of the CGAs. As the CGAs rise, solute molecules in the aqueous phase partition themselves between the polyaphrons and the water. At the surface of the column, the polyaphrons coalesce forming a layer of solvent containing the solute. In principle, this technique is an effective means of removing organic compounds from water; however, it removes compounds at the expense of contaminating the water with residual solvent and surfactant. Therefore, the effluent water from a predispersed solvent extraction column must undergo further treatment (Valsaraj, 1995).
A process related to predispersed solvent extraction is solvent sublation (Sebba, 1962; Karger, 1972). In a review paper (Valsaraj et al., 1991), the authors have described the transport mechanisms that are important to solvent sublation as well as discussed the general ªstate-of-the-artº. The basic advantage of solvent sublation over predispersed solvent extraction and conventional solvent extraction is that intimate contact between the organic solvent and the aqueous phase is prevented. This feature overcomes the problem of residual solvent in the aqueous phase. Furthermore, the use of a surfactant is not crucial to the operation. There have been a number of examples where the hydrophobic nature of neutral-nonpolar compounds has been utilized to remove them in solvent sublation. Some examples appear in Table 1a in which the solute removed, solvent, and the operating conditions are listed. A surfactant is only necessary when the compound to be removed is ionizable, e.g., ionic dyes, metal complexes (Cervera et al., 1982; Huiru and Xiuyu, 1988; Wang et al., 1993), or phenols, as illustrated in Table 1b. In the cases of weakly ionizable species, such as
S0888-5885(95)00365-4 CCC: $12 00 © 1996 American Chemical Society

+ |
+ |
Ind. Eng. Chem. Res., Vol. 35, No. 5, 1996 1689
Table 1. Representative Solvent Sublation Studies
|
|
|
|
|
air flow rate / |
|
|
surfactant (or |
|
column |
water flow rate |
|
|
compound |
complex agent) |
solvent |
dimensions |
max (mL/min) |
investigators |
|
|
|
|
|
|
|
|
|
|
(a) Neutral Compounds |
116 cm |
|
|
|
1,1,1-trichloroethane |
|
1-octanol |
5.2 |
120/nil |
Lionel et al., 1981 |
|
dichlorobenzenes, |
|
mineral oil |
3.5 |
85 cm |
97/nil |
Valsaraj and Wilson, |
nitrophenols, PCBs, |
|
|
|
|
|
1983 |
lindane, endrin |
|
|
|
85 cm |
|
|
naphthalene, phenanthrene |
|
mineral oil |
3.5 |
97/nil |
Huang et al., 1983 |
|
alkyl phthalates |
|
mineral oil |
3.6 |
90 cm |
180/nil |
Tamamushi and Wilson, |
|
|
|
|
90 cm |
|
1984-5 |
indene, aldrin |
|
mineral oil |
3.1 |
70/nil |
Foltz et al., 1986 |
|
pentachlorophenol (PCP) |
|
mineral oil, hexane, |
5 100 cm |
168/nil |
Valsaraj and Springer, |
|
(pH ) 2.5) |
|
1-octanol |
|
100 cm |
|
1986 |
diphenyl |
|
mineral oil |
3.2 |
100/nil |
Wang and Huang, 1988 |
|
o-dichlorobenzene, |
|
mineral oil, |
8 50 cm |
133/nil |
Shin and Coughlin, 1990 |
|
toluene |
|
1-octanol, |
|
|
|
|
|
|
2-octanol |
|
60 cm |
|
|
hexachlorobutadiene, |
|
mineral oil |
3.5 |
180/nil |
Shih et al., 1990 |
|
2,4,6-trichlorophenol |
|
|
|
|
|
|
(TCP) |
|
|
5 100 cm, |
|
|
|
PCP, TCP, naphthalene |
|
mineral oil |
250/25 |
Valsaraj et al., 1992 |
||
|
|
|
15 cm |
|
|
|
|
|
|
150 cm |
|
|
|
|
|
(b) Ionic Compounds |
46 cm |
|
|
|
methyl orange |
hexadecyltrimethyl- |
2-octanol |
4.5 |
30/nil |
Karger et al., 1967a |
|
Rhodamine B |
ammonium bromide, |
|
|
|
|
|
|
HTMAB |
|
|
|
|
|
methyl orange |
HTMAB |
2-octanol |
9 cm diam. |
167/nil |
Karger et al., 1970 |
|
|
|
|
(2 lt.) |
|
|
|
hexacyanoferrate(II) |
dodecylpyridinium |
2-octanol |
9 cm diam. |
167/nil |
Spargo and Pinfold, 1970 |
|
|
chloride |
|
(2 lt.) |
|
|
|
thulium and americium |
citric acid |
N/A |
N/A |
N/A |
Stachurski and Szeglowski, |
|
|
|
|
|
87 cm |
|
1974 |
methylene blue and |
HTMAB |
2-octanol |
3.5 |
57/nil |
Womack et al., 1982 |
|
orange |
|
|
|
60 cm |
|
|
magneta (cationic dye) |
sodium lauryl |
mineral oil |
3.5 |
120/nil |
Sheu and Huang, 1987 |
|
|
sulfate |
|
|
|
|
|
eleven phenolic |
HTMAB, |
diisopropyl ether, |
N/A |
60/nil |
Caballero et al., 1988 |
|
compounds |
stearylamine |
isopropyl alcohol |
6 76 cm |
|
|
|
phenols |
ethylhexadecyl- |
MIBK |
65/nil |
Nolan and McTernan, 1988 |
||
|
ammonium |
|
|
|
|
|
|
bromide |
|
|
100 cm |
|
|
neutral and ionic PCP |
HTMAB |
mineral oil, decyl |
2.3 |
30/nil |
Valsaraj and Thibodeaux, |
|
|
|
alcohol |
|
100 cm |
|
1991a |
neutral and Ionic, PCP, |
HTMAB |
mineral oil, decyl |
2.3 |
72/6 1 run with |
Valsaraj and Thibodeaux, |
|
1,2,4-trichlorobenzene, |
|
alcohol |
|
|
1.8 mL/ min |
1991b; Lu et al., 1991 |
2,3,6-trichloroanisole, |
|
|
|
|
solvent flow |
|
TCP |
|
|
|
40 cm |
rate |
|
Gold |
HTMAB |
2-octanol, MIBK, |
3.7 |
45/nil |
Wang et al., 1993 |
|
|
|
n-butyl acetate, |
|
|
|
|
|
|
tributyl phosphate |
|
|
|
|
phenols, the use of surfactant can be avoided by adjusting the pH (Valsaraj and Springer, 1986).
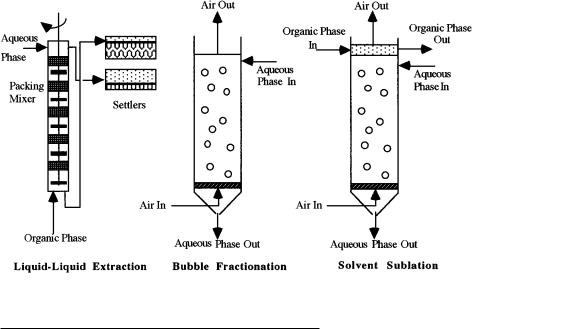
Solvent sublation may be thought of as a combination of conventional liquid-liquid extraction and bubble fractionation. In Figure 1, countercurrent configurations of these processes are compared. Like all adsorptive bubble processes, solvent sublation is similar to bubble fractionation. The difference is that, in sublation, a nonvolatile organic solvent is floated upon the water column. In bubble fractionation, nonvolatile compounds become enriched in the top portion of the aqueous phase, and volatile organic compounds (VOCs) are lost to the atmosphere unless some other gas-phase treatment is used. In solvent sublation, on the other hand, volatile and nonvolatile compounds are recovered in the solvent phase, just like they are recovered in the solvent phase used in the extraction process. In the extraction process, multiple stages are required for any appreciable recovery; however, in sublation, only one stage of solvent-water contact is required. Furthermore, in solvent sublation, mixers and settlers are not
needed, which makes sublation less expensive. The biggest advantage over both conventional extraction (single-staged) and bubble fractionation is that a higher degree of fractional removal is possible under certain circumstances (Valsaraj et al., 1991).
As can be seen in Table 1a,b, most of the sublation work to date has been conducted on small-scale laboratory columns operating in a batch mode relative to the liquid phase. Though this type of information is important for studying the transport mechanisms in sublation, it is not useful for ascertaining scaleup or industrial feasibility.
Recently (Lu et al., 1991; Valsaraj and Thibodeaux, 1991a,b; Valsaraj et al., 1992), our group investigated semicontinuous operation (continuous, countercurrent air and water phases) and examined the effect of column diameter (15 versus 5 cm). These studies demonstrated the feasibility of operating continuously and showed that solvent sublation consistently outperformed bubble fractionation in terms of fractional removal. Furthermore, sublation performance was found to be less
+ |
+ |
1690 Ind. Eng. Chem. Res., Vol. 35, No. 5, 1996
Figure 1. Comparison of liquid-liquid extraction, bubble fractionation, and solvent sublation.
Table 2. Thermodynamic Properties of Hydrophobic
Compoundsa
|
|
|
PAH (pyrene) |
CP (PCP) |
||
|
|
|
(MW ) 202) (MW ) 266) |
|||
|
|
|
|
|
|
|
aqueous solubility (mg/L) |
|
|
0.135 |
14 |
10-4 |
|
vapor pressure (mmHg) |
|
|
6.80 |
10-7 |
1.10 |
|
log Kow′′ |
|
|
4.88 |
-4 |
5.01 |
-4 |
3 |
3 |
) |
7.65 |
1.39 |
||
Henry's constant, Hc (cm |
/cm |
10-3 |
10-5 |
|||
Interfacialbpartition constant, |
|
5.39 |
10 |
9.13 |
10 |
|
KA (cm) |
|
|
|
|
|
|
a Montgomery and Welkom, 1990. b Mackay et al., 1990; Hoff et al., 1993.
dependent on the column diameter. This was in contrast to the bubble fractionation results where the performance suffered as the diameter increased. It is generally known that increasing the column diameter adversely affects the axial mixing in bubble fractionation (Kown and Wang, 1971; Deckwer et al., 1974; Shah et al., 1982); however, it was concluded that, once a solvent layer captures the solute as in sublation, it is retained as the solvent possesses a greater affinity for the solute. From preliminary studies using the 15 cm diameter column, it was recognized that the inability to produce small bubbles (<1 mm) at high air flow rates (>600 mL/min) can be a problem in scaled-up operation. It was observed that, over a long duration, the activity in the stagnant solvent phase becomes greater than that in the water phase, in which case, the driving force for mass transport is reversed. It was recommended that future studies should investigate ways to produce and maintain small bubbles at high air flow rates and reduce backmixing from the organic solvent to the aqueous phase by continuously replenishing the solvent phase.
These results have motivated our group to further investigate aspects of solvent sublation at the pilot-scale. These aspects include (i) the development of a steadystate mathematical model more suited for engineering applications and scaleup; (ii) the effect of novel bubble spargers on the bubble size and other hydrodynamic properties, and (iii) the effect of air, solvent, and water flow rates on the performance of a three-phase continuous sublation column. The compounds chosen to be investigated in this research are pyrene and pentachlorophenol. These pollutants have unique physiochemical properties as shown in Table 2.
In part 1 of this series, we discuss the mechanisms of transport in solvent sublation and develop math-
ematical models to predict the steady-state pollutant concentrations in all three phases of a continuous sublation column. We examine the effects of the operating variables, thermodynamic variables, and design variables on sublation performance. Modelgenerated, fractional removal data are correlated in terms of key dimensionless numbers so that the use of the complex analytical solutions may be avoided. In part 2, we present hydrodynamic data, such as bubble size and gas holdup, for two types of gas spargers used in a pilot-scale sublation column. We also show that the homogeneous or bubbly flow regime (Shah et al., 1982) is the appropriate operating regime for solvent sublation. In part 3 of this series, we will present steady-state fractional removal data collected from a continuous, pilot sublation column and a bubble fractionation column.
Mass Transport Mechanisms
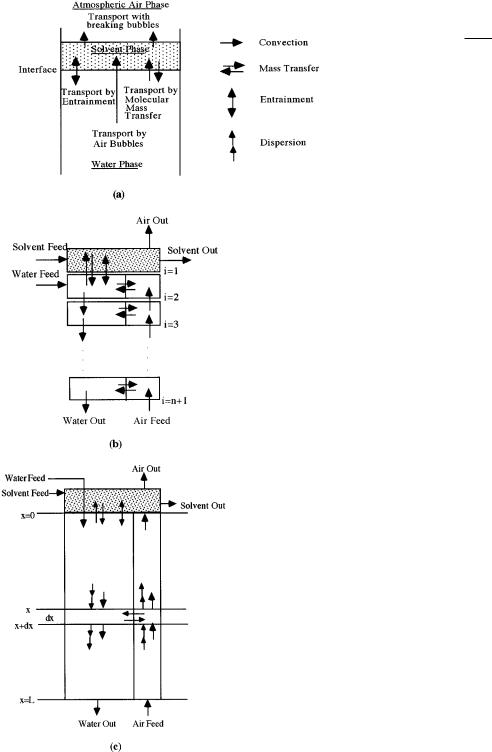
In solvent sublation, there are three principle pathways or transport mechanisms available by which a pollutant may be removed from the aqueous phase. They are transport by air bubbles, water entrainment due to the wakes of rising air bubbles, and molecular mass transport across the solvent-water interface. These mechanisms are illustrated in Figure 2a and discussed below.
Transport by Air Bubbles. The most significant pathway for the removal of pollutants is the unidirectional transport by air bubbles. As air bubbles rise up the column, both volatile and nonvolatile compounds partition into and on the surface of the bubble. For dilute systems of volatile compounds, Henry's law adequately describes the extent of partitioning and, ultimately, the extent of stripping. However, for the case of strongly hydrophobic compounds that are of low volatility such as polyaromatic hydrocarbons, chlorinated pesticides, etc., the partitioning process is primarily due to interfacial adsorption upon the bubble surface. The extent of partitioning can be determined by combining the equilibrium relationships for bulkphase partitioning and surface adsorption with a mass balance for the total amount of pollutant carried by a bubble of radius a. In eq 1, m is the total amount of pollutant, ¡ is the surface concentration of the bubble, and Cv is the concentration of pollutant in the air
+ |
+ |
Figure 2. (a) Mechanisms of mass transport, (b) series CSTR model (SCM), and (c) two-phase axial dispersion model (ADM2).
m ) 4ða2¡ + |
4ða3Cv |
(1) |
|
3 |
|
bubble. At equilibrium, the concentrations are related to the bulk-phase water concentration through linear relationships
¡ ) KACw Cv ) HcCw |
(2) |
where KA is the interfacial partition constant, and Hc is the Henry's law constant. When eqs 1 and 2 are combined, the following effective air concentration
Ind. Eng. Chem. Res., Vol. 35, No. 5, 1996 1691
results:
CA ) m ) (3KA + Hc)Cw (3) 43ða3 a
The term in parentheses is the effective Henry's law constant, H. It depends inversely upon the air bubble size. The ratio of the Henry's law constants, H/Hc, is termed the enhancement factor, H. From the values of Hc and KA shown in Table 2 for pyrene, one can determine that H is at least an order of magnitude greater than Hc. When the bubble radius is on the order of 0.05 cm, H becomes over a 100 times greater than
Hc.
Bubble-Wake Entrainment. Bubble-wake entrainment is the second most important transport mechanism in solvent sublation. It results from the fact that a bubble rising in a water column is not exactly spherical. It is actually shaped more like a semispherical cap. Located behind the bubble resides a small quantity of water called the wake (Fan and Tsuchiya, 1990), the amount of which is defined by the streamlines in the fluid created by the rising bubble. When the bubble and wake enter the solvent, the wake disengages and becomes a small droplet that slowly descends to the aqueous phase. This releases pollutant back into the solvent. The droplet returns to the aqueous phase with an equilibrium amount of pollutant. To account for this type of transport, it is assumed that the wake uniformly surrounds the bubble such that the volume of the wake can be approximated as 4ða2di, where di is the wake thickness.
Solvent-Water Interfacial Molecular Mass Transfer. Unarguably, the organic solvent-water interface is the focal point for all mass transport. As shown in Figure 2a, one of the transport mechanisms across the interface is molecular mass transport. In a conventional liquid-liquid extraction process, this is the sole mechanism of transport and is very important. However, it is not as important in solvent sublation. The explanation for this is that, in a sublation column, convective mass transport due to the rising air bubbles overwhelms the rate of molecular mass transport and prevents the establishment of equilibrium across the solvent-water interface. This is only true if the sublation column is operated in a three-phase continuous mode where steady-state operation is possible.
Model Development
The traditional (Lionel et al., 1981; Womack et al., 1982; Wilson and Valsaraj, 1982-3; Huang et al., 1983; Valsaraj and Thibodeaux, 1991a,b) mathematical analysis of sublation columns involves dividing the column into a series of well-mixed stages, the number of which describes the degree of axial mixing, and simultaneously solving a set of mass balance equations. One nontraditional approach reported in the literature (Stachurski and Szeglowski, 1974) involves probabilistic arguments to predict removal efficiencies. Though there is nothing inherently wrong with either approach, they are not generally accepted methods of analyzing gas- liquid mass transfer in bubble columns. The preferred approach is to treat the water column as a continuum and to use the axial dispersion model (ADM) (Deckwer et al., 1983; Deckwer and Schumpe, 1993). In the following development, we apply both the traditional
+ |
+ |
1692 Ind. Eng. Chem. Res., Vol. 35, No. 5, 1996
model and the axial dispersion model to solvent sublation. We further show that one can easily convert from one model to the other.
Series CSTR Model (SCM). A general illustration of the SCM appears in Figure 2b. The top stage, designated as stage 1, represents the thin layer of solvent which floats upon the column of water. The stages below the first make up the water column, which is partitioned into an air phase and a water phase. The volume fraction of the air phase is equal to the gas holdup, , while that of the water phase is 1 - . The total number of stages comprising the water column determines the amount of axial mixing present in the column. The simplest case to consider is a two-staged model (or two-box model); i.e., the water column is comprised of just one stage (box).
The transport mechanisms shown in Figure 2b include convection, molecular-mass transfer between the water and solvent, molecular-mass transfer between the water and air, and bubble-wake entrainment. These mechanisms are included in steady-state mass balances that describe the transport of pollutant in the sublation process. For a two-box SCM, the governing mass balances are
QwCw° - QwCw - 3akðrc2L (Cw - CHA)-
(ðrc2k1(1 - ) + 3QAdai)(Cw - KCowo )) 0 (4)
QACA° - QACA |
+ |
3kðrc2L (Cw |
- |
CA |
)) 0 (5) |
|
|||||
|
|
a |
|
H |
|
QoCo° - QoCo + QA(CA - HKcCo)+
( 2 ow di)( Co )
ðrc k1(1 - ) + 3QA a Cw - Kow ) 0 (6)
where Cw, CA, and Co are the effluent water, air, and solvent molar concentrations, respectively, and Qw, QA, and Qo are the water, air, and solvent volumetric flow rates, respectively. The superscript degree, designates the molar feed concentration; however, in this analysis, it is assumed that the air and solvent enter the process free of pollutant (i.e., CA° ) Co° ) 0). When eqs 4-6
are divided through by QwCw°, QAHCw°, and QoKowCw°, respectively, the following dimensionless equations
result:
1 - W - StwA(W - A) - (Stw + Ew)(W - S) ) 0 |
(7) |
A° - A + StA(W - A) ) 0 |
(8) |
S° - S + (Sto + Eo)(W - S) + PA( HA - S) ) 0 |
(9) |
The system of eqs 7-9 has an analytical solution which is given in the appendix. When the number of boxes used in the SCM is greater than two, a numerical algorithm is recommended.
Two-Phase Axial Dispersion Model (ADM2). An alternative method for modeling the sublation process is to consider the water column as a continuum of wellmixed, interacting boxes. The interactions allow for axial mixing which is defined in terms of a dis-
persion coefficient and a second derivative. In this development, axial dispersion in the gas phase is also included.
Figure 2c shows a depiction similar to that used in the SCM; however, the transport mechanisms within the column have been drawn about a differential element, dx. The solvent is not considered part of the continuum and is treated as a separate well-mixed box. The governing equations that describe the transport of pollutant are
@A ) @2A |
+ Pe |
|
|
@A |
+ Sh |
(W - A) |
(10) |
|||
@ô |
@ê2 |
|
1 @ê |
|
1 |
|
|
|
||
@W ) @2W |
- Pe |
|
@W |
- Sh |
|
(W - A) |
(11) |
|||
@ô |
@ê2 |
|
|
2 |
@ê |
|
2 |
|
|
|
1 dS
dô ) PA( HAjê)0 - S) + (Eo + Sto)(Wjê)0 - S) - S
(12)
Equations 10 and 11 apply to the air and water phases and are referred to here as the two-phase axial dispersion model (ADM2). Equation 12 is a mass balance around the solvent layer. When the time derivatives in eqs 10-12 are set to zero and the appropriate boundary conditions are used, a steady-state solution can be found as shown in the appendix. In the general case, the Peclet and Sherwood numbers would be written in terms of two different axial dispersion coefficients, one for the water phase and one for the air phase. Since it will be shown in part 2 of this series that the bubbly flow regime is the preferred regime for solvent sublation, the gas-phase dispersion coefficient is assumed to be equal to that of the liquid phase. This is a good assumption for the bubbly flow regime; however, it has been reported (Shetty et al., 1992) that the mechanism of gas-phase dispersion in the heterogeneous regime (characterized by two distinct bubble sizes) is distinctly different from that in the homogeneous regime. Therefore, the single-dispersion-coef- ficient assumption is not valid in the heterogeneous regime.
A relationship exists (Fogler, 1992) that allows one to determine the axial dispersion coefficient used in the ADM2 from the number of well-mixed boxes used in the SCM. The derivation of the relationship involves determining the effluent response curves (or residence time distributions, RTDs) of both models when the mass-transfer terms are set to zero, and the feeds to each model are subjected to a perfect impulse. Next, the variance (second moment) of the RTD for n-CSTRs in series is set equal to the variance of the RTD for the axial dispersion model. The result is eq 13. After
1 ) |
2 |
+ |
|
8 |
|
(13) |
|
Pe12 |
|||||
n |
Pe1 |
|
||||
rearrangement, the expression for the dispersion coefficient is obtained as
uL
D ) (14)
n + (n2 + 8n)1/2
where n is the number of CSTRs making up the water column (n ) i - 1), u is the gas velocity (ug/ ), and L is the length of the vessel. The obvious benefit of this relationship is that one can easily convert between the
+ |
+ |
Ind. Eng. Chem. Res., Vol. 35, No. 5, 1996 1693
Figure 3. Fractional removal versus QA and Qw as predicted by the SCM.
Table 3. |
Model Parameters |
|
|
|
|
|
|
|||||||||
thermodynamic |
|
|
kinetic |
hydrodynamic |
|
|
design |
|||||||||
|
|
|
|
|
|
|
|
|
|
|
|
|
|
|||
Hc |
) |
5 |
-4 |
|
k |
) |
10-4 cm/s |
a ) 0.1u |
1/2 |
cm |
r |
|
) 5.08 cm |
|||
|
|
10 |
-3 |
cm |
|
5 -4 |
cm/s |
g |
|
|
|
c |
|
|||
KA ) 5 10 |
|
k1 ) 10 |
) 0.05ug |
|
L ) 152.4 cm |
|||||||||||
K |
|
) 76412 |
|
n ) 1 |
|
V /Vb ) 1.5 |
|
bubbly flow |
||||||||
ow |
|
|
|
|
|
|
|
|
|
w10-4Vb-0.741 |
type sparger |
|||||
two models given either the number of CSTRs or the axial dispersion coefficient.
Results and Discussion
The two response functions that describe the effectiveness or performance of a sublation column are the fractional removal of pollutant, FR, and the separation factor, ª,
FR ) 1 - W ) 1 - |
Cw |
|
|||||||
Cw° |
|
|
|||||||
ª ) |
S |
|
) |
|
Co |
|
(15) |
||
W |
CwKow |
||||||||
|
|
|
|||||||
The separation factor is the ratio of the effluent solvent concentration to the effluent water concentration and is a good measure of the effectiveness of solvent sublation relative to other liquid-liquid separation processes. Both response functions are dependent upon five types of variables: thermodynamic, kinetic, design, operational, and hydrodynamic. Not all of these variables, however, are independent. In most cases, the kinetic and hydrodynamic variables are defined in terms of the gas velocity, which is an operational variable. Hydrodynamic properties are also dependent upon the design variables, especially the sparger type. Thus, the problem of characterizing sublation column performance is one which investigates the effects of the operational, design, and thermodynamic variables.
Effect of Operational Variables (QA, Qw, Qo). In Figure 3, a representative surface of fractional removal versus QA and Qw is shown for a strongly hydrophobic compound, like a polynuclear aromatic hydrocarbon (PAH). The surface was generated from the SCM using typical values (i ) 2 and Qo ) 2 cm3/min). An equivalent surface would result from the ADM2 if Pe1 ) 4. Other model parameters that were used to generate the surface are listed in Table 3. As shown in the table, the hydrodynamic variables were determined from power-law models which are representative of the bubbly flow regime (Clift et al., 1978; Shah et al., 1982;
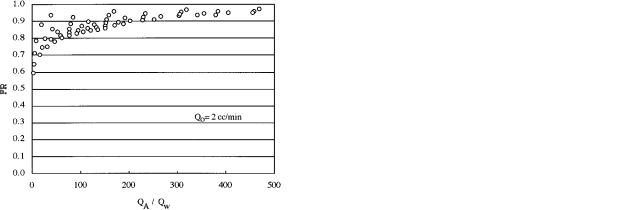
Figure 4. Fractional removal versus QA/Qw shows multiple steady-states.
Geary and Rice, 1991). The bubble-wake correlation appearing in the table possesses the same functional form of experimental data cited elsewhere (Fan and Tsuchiya, 1990). Overall, the characteristics of the surface plot are what one would expect: fractional removal varies directly with air flow rate and inversely with water flow rate; and the approach toward unity is asymptotic. Though the surface plot nicely illustrates the model, it is not accessible for quantitative use. Furthermore, multiple surface plots are required to span Qo. Because of these reasons, an alternate way to present the model is necessary.
Since it has been customary in previous sublation studies to plot fractional removal versus a ratio of flow rates, the same fractional removal data used in the previous figure was plotted versus QA/Qw (see Figure 4). As can be seen in the figure, multiple steady states are predicted. The reason why this occurs is that fractional removal is affected by column hydrodynamic properties which are functions of gas velocitysnot QA/ Qw. For example, the hydrodynamics of the column are different at (QA ) 2000 cm3/min; Qw ) 20 cm3/min) than they are at (QA ) 10000 cm3/min; Qw ) 100 cm3/min) even though the ratios of QA/Qw are the same. If Qw were fixed, then multiple steady states would not occur as the ratio QA/Qw would be directly proportional to gas velocity. Again, the problem with fixing a variable is that multiple plots become necessary. Therefore, it was decided to correlate the model predictions in terms of the dimensionless numbers that describe the mass transport mechanisms. The advantage of this approach is that the effect of the operational variables and the effect of their influences on column hydrodynamics are combined. Based on multiple-variable regression analyses of 250 computer simulations, correlations for fractional removal and the separation factor were determined. The ranges of the operational variables used in the simulations were 400 e QA e 15 200 cm3/min, 20 e Qw e 100 cm3/min, and 0.1 e Qo e 100 cm3/min.
For strongly hydrophobic compounds where the solute capacity of the solvent is large (Pw e 0.013), a simple correlation for the fractional removal was found.
|
FR |
) E 0.1657St |
0.8352 |
(16) |
|
|
|
wA |
|||
1 |
- FR |
w |
|
||
|
|
|
|||
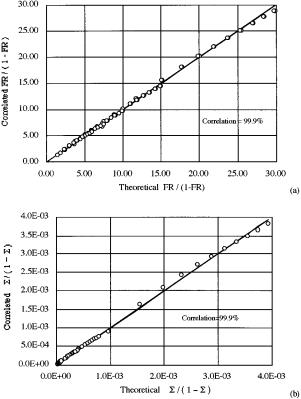
In Figure 5a, a parity plot of fractional removal shows very good agreement between the theory and the correlation, as all the deviations are within (10%. The reason for the good agreement is that the functional dependence of eq 16 is consistent with the relative
+ |
+ |
1694 Ind. Eng. Chem. Res., Vol. 35, No. 5, 1996
Figure 5. Parity plots of the theoretical (a) fractional removal and (b) separation factor versus predictions by correlation.
importance of the mass-transfer mechanisms. The mass transfer associated with the air bubbles, StwA, is weighted more than that associated with entrainment, Ew. As alluded to, the mass transfer across the solvent-water interface (Stw or Sto) has no effect on the fractional removal for systems which are overwhelmed by the transport of air bubbles. One advantage of the correlation is that fractional removal of strongly hydrophobic compounds can be estimated very easily without resorting to the analytic solution. Another advantage is that the correlation suggests the appropriate way in which experimental data should be plotted, as will be shown in a later paper (part 3 of this series).
From the regression analysis, a simple correlation for the separation factor was also obtained.
|
ª |
) E |
1.464P |
0.544Q |
K |
ow |
(Q |
o |
in cm3/min) (17) |
|
|
|
|||||||||
1 |
- ª |
o |
A |
o |
|
|
|
|||
|
|
|
|
|
|
|
|
|||
A parity plot of this correlation and the theoretical separation factor is shown in Figure 5b. Again, the agreement is within (10%. One interesting feature about the correlation is that, though it is appears first order in QoKow, the overall dependence is actually(QoKow)-1. To explicitly see the inverse dependence, eq 17 is rearranged and expressed in terms of dimensional numbers.
|
|
|
|
|
QAdi |
1.464 QAHc 0.544 |
|||||||||
|
|
3 |
|
|
|
|
|
|
|
|
|
QoKow |
|||
|
Co |
QoKowa} {QoKow} |
|||||||||||||
|
{ |
|
|
|
|||||||||||
ª ) |
|
) |
|
|
|
|
|
|
|
|
|
|
|
|
|
CwKow |
|
|
|
QAdi |
|
1.464 QAHc |
0.544 |
|
|||||||
|
|
1 + |
3 |
|
|
|
|
|
|
|
|
QoKow |
|||
|
|
QoKowa} {QoKow} |
|||||||||||||
|
|
|
|
{ |
(18) |
||||||||||
|
|
|
|
|
|
|
|
|
|
|
|
|
|
||
Observing that the exponents for the terms in braces sum to approximately 2, one can factor a (QoKow)-2 from
the terms, leaving a net (QoKow)-1 dependence in the numerator and denominator.
|
|
¾K |
-1Q -1 |
|
||
ª |
|
ow |
o |
|
(19) |
|
1 + ¾Kow-1Qo-1 |
||||||
where |
|
|
|
|
|
|
¾ [3 |
QAdi |
]1.464[QAHc]0.544 |
(19) |
|||
a |
||||||
The physical importance of eq 19 becomes clear when one recognizes that the terms remaining in the brackets (collectively referred to as the kinetic factor, ¾) reflect the kinetic and hydrodynamic processes associated with the air (bubble) phase. Essentially, ¾ controls the extent to which equilibrium is approached between the solvent and water. First, in the limit of small ¾, the departure from equilibrium is great, and as eq 19 suggests, ª is predicted to be zero. Of course, a zero separation factor is not accurate since the physics of the process change significantly when the air phase is removed. The lower limit is better described by considering the solvent and water phases as two contacting CSTRs. Though such a situation is kinetically undesirable in practice, it does represent a theoretical lower limit for solvent sublation and does exist for a singlestaged quiescent solvent extraction process. It can be shown that, for such a case, ª is equal to Sto/(1 + Sto). Using this expression and typical conditions used in this paper (Sto ) 6.34 10-6), one can estimate that the lower limit for ª Sto , or equivlalently ª/(1 - ª) Sto. As one can see in Figure 5b, predictions of ª for practical sublation conditions are as much as 3 orders of magnitude greater than the lower theoretical limit. The improved separation is attributed to the additional transport processes associated with the air (bubble) phase. In the limit of large ¾, the separation factor approaches unity, the condition for solvent-water equilibrium. In practice, however, it is unlikely that equilibrium may be reached solely by adjusting ¾. Since the hydrodynamic properties were assumed to be that of homogeneous flow, the SCM will eventually break down as ¾ becomes very large. Thus, other means of improving the performance are needed, such as reducing the solvent usage, Qo, without significantly affecting the overall fractional removal.
It is emphasized that the correlations, eqs 16 and 17, were developed from the SCM with fixed kinetic parameters (see Table 3) and are valid for strongly hydrophobic compounds (Pw e 0.013). For weakly hydrophobic compounds, the exact solutions given in the appendix must be used.
Effect of Thermodynamic Variables. Examining the effects of thermodynamic properties is important because they can vary greatly between families of hydrophobic pollutants. As shown in Table 2, the interfacial partition constant can vary over 4 orders of magnitude. Other properties such as the Henry's law constant and the solvent-water partition coefficient can vary greatly as well. Therefore, computer simulations, again based on the SCM (i ) 2) and values cited in Table 3, were performed to determine the relative importance of these thermodynamic properties.
There was negligible effect of the solvent-water partition constant on fractional removal for Kow g 700. This was not a surprise given the fact that fractional removal was shown not to be dependent upon solvent-

+ |
+ |
Ind. Eng. Chem. Res., Vol. 35, No. 5, 1996 1695
Figure 6. Effect of the Henry's enhancement factor on fractional removal (Qw ) 50 cm3/min, Qo ) 2 cm3/min) for (a) Hc ) 10-4, (b) Hc ) 10-3, and (c) Hc ) 10-2.
water mass transfer for strongly hydrophobic compounds. However, the effects of Hc and KA on fractional removal were significant. In Figure 6a, fractional removal is plotted versus the enhancement factor, H )
1 + 3KA/aHc, for constant values of QA/Qw. The enhancement factor was varied by varying KA over the
range 5 10-5-5 10-2 cm. As expected, the enhancement factor had a pronounced favorable effect on fractional removal. Even for compounds which do not have large enhancement factors, the effect was appreciable at high air flow rates. At low air flow rates, the effect was significantly reduced even for H on the order of 100. The condition where H ) 1 represented the situation where no adsorption to the bubble occurs. In this situation, the mass transfer to the air phase was solely driven by Henry's law.
For the case shown in Figure 6a, Hc was 10-4. When values higher than 10-4 were used, the curves in Figure 6a were simply translated up the x-axis by an amount of 1/¢Hc. For example, when Hc was 10-3, the curves were translated up the x-axis by a factor of 10, as shown in Figure 6b. The shape of the curves and the values of fractional removal remained unchanged. For Hc > 10-3, the curves were translated up the x-axis such that the lower portion of the curves were truncated. This is illustrated in Figure 6c, where fractional removal is plotted for Hc ) 10-2. The reason for this behavior is that, for a small Hc, surface adsorption is the sole mass transfer mechanism; thus, to achieve a high degree of fractional removal, a large enhancement factor is required. For a large Hc, however, Henry law partitioning becomes significant, and the same degree of fractional removal is achieved at a lower enhancement factor.
Figure 7. Effect of bubble size on fractional removal in solvent sublation.
One interesting feature about Figure 6 is that each QA/Qw curve represents not only a fixed air flow rate but also a fixed bubble size, since the bubble size was taken to be a function of gas velocity. The implication is that one can predict the effect of a smaller bubble size at a constant air flow rate or, similarly, the effect of increasing the air flow rate at constant bubble size. Such an exercise may be important if surfactant is used to change the surface tension or if an improvement in sparger design is made, as will be discussed in the next section. To illustrate the idea, consider curve (b) in Figure 6b at H ) 10. The fractional removal is about 80% for these conditions. The bubble size can be shown to be about 1 mm. If the bubble size were to be made 50% smaller, H would become 19, corresponding to a fractional removal of 86%. If the bubble size were an order of magnitude smaller than its original value at this flow rate, the fractional removal would increase to 91%. This illustration demonstrates that bubble size affects not only the interfacial area for mass transfer but also the thermodynamics (enhancement factor) influencing the driving force for mass transfer.
Effect of Design Variables. Design variables do not play a large role in solvent sublation; however, they can affect hydrodynamic properties which do have significant impacts on sublation performance. For example, bubble size is determined, to a great extent, by the type of device used for bubble generation. Since bubble size contributes largely to the interfacial area available for mass transfer as well as the enhancement factor, the choice of bubble generator is important. Some examples of bubble generators are submersible orifices (gas spargers) such as nozzles, sintered-metal or -glass plates, sprinklers, and rubber membranes. Some bubble generators are external to the column. An example is an aerated vessel containing surfactant and water. The bubbles which form in the vessel are removed and injected into the bottom of the bubble column.
Small improvements in sparger design may have significant effects on sublation performance. An example of this is illustrated in Figure 7, where fractional removal is plotted versus QA/Qw for two different powerlaw models describing bubble size dependence: one with a square-root dependence on velocity and one with a 1/4 power dependence. The model with the 1/4 dependence is hypothetical; however, it is not necessarily infeasible. Spargers that eject bubbles into an overlying shear field have been shown to produce smaller bubbles than what is normally observed in the bubbly flow regime (Johnson et al., 1982; Johnson and Gershey, 1990; Marshall et al., 1993). Such spargers may well be described by a
+ |
+ |
1696 Ind. Eng. Chem. Res., Vol. 35, No. 5, 1996
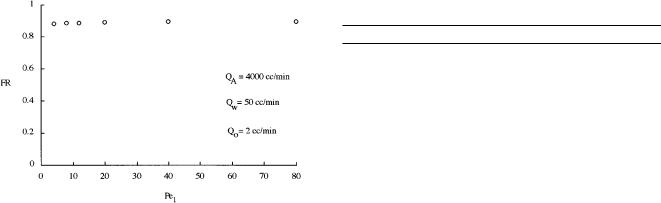
Figure 8. Effect of axial mixing (Pe1) on fractional removal.
power-law model with a weaker dependence in velocity. In part 2 of this series, bubble size results from an annular shear bubble sparger support this type of model dependence.
Gas holdup is an important hydrodynamic property that contributes to the interfacial area. In general, it is determined soley by the gas velocity and the physical properties of the liquid (Akita and Yoshida, 1973; Hikita et al., 1980; Shah et al., 1982). However, in part 2, experimental results indicate that gas holdup may be improved by the use of novel spargers, such as the annular shear sparger already mentioned.
Axial dispersion, on the other hand, has a strong dependence upon column diameter (Deckwer and Schumpe, 1993). In general, reducing the axial dispersion or mixing in bubble column reactors is desirable and can be accomplished using tall columns (Deckwer et al., 1974). To elucidate the effect of axial mixing on sublation performance, the ADM2 was used to show the dependence of fractional removal on the Peclet number, Pe1. As one can see in Figure 8, there is essentially no effect of mixing. This behavior is consistent with experimental observations (Valsaraj et al., 1992) which showed that the fractional removal was independent of column diameter. The explanation for this is that the solute is strongly retained in the organic phase and is prevented from being backmixed in the aqueous phase. Therefore, unlike other bubble column processes, the influence of column diameter on axial mixing is not important. From a mathematical perspective, the implication is that the two-box SCM should adequately describe sublation performance despite the extent of mixing. In part 3 of this series, experimental data obtained from a pilot sublation process compare well with the SCM and support the idea that mixing in the aqueous phase is unimportant in sublation processes.
ADM2 versus SCM. To illustrate how well the ADM2 compares with the SCM, fractional removal data were calculated from each model using the analytical solutions listed in the appendix. The calculations were based on the model parameters listed in Table 3. The axial dispersion coefficient was determined from eq 14. Table 4 shows the various conditions for the operating variables and the corresponding model results. As can be seen in the table, the ADM2 consistently predicts a slightly higher fractional removal than the SCM but is no higher than about 0.01 in all but one case. One possible explanation for this offset may be attributed to the choice of boundary conditions used for the ADM2. The traditional Danckwerts conditions (open vessel) were used in the development. These conditions require that the dispersive flux match the convective flux at the
Table 4. Comparison of Fractional Removal between the SCM (i ) 2) and the ADM2 (Pe1 ) 4)
QA (cm3/min) Qw (cm3/min) Qo (cm3/min) FR ADM2 FR SCM
400 |
40 |
20 |
0.799 |
0.786 |
400 |
20 |
2 |
0.888 |
0.880 |
400 |
80 |
2 |
0.665 |
0.647 |
400 |
40 |
0.01 |
0.788 |
0.774 |
3200 |
80 |
2 |
0.809 |
0.791 |
3200 |
40 |
20 |
0.894 |
0.883 |
3200 |
20 |
2 |
0.944 |
0.938 |
3200 |
40 |
0.01 |
0.889 |
0.877 |
6200 |
20 |
2 |
0.957 |
0.952 |
6200 |
80 |
2 |
0.849 |
0.833 |
6200 |
40 |
0.01 |
0.914 |
0.905 |
6200 |
40 |
20 |
0.918 |
0.909 |
12200 |
80 |
2 |
0.884 |
0.871 |
12200 |
40 |
20 |
0.939 |
0.931 |
12200 |
40 |
0.01 |
0.936 |
0.928 |
12200 |
20 |
2 |
0.968 |
0.964 |
boundaries instead of specifying the concentration (closed vessel). When one examines an aqueous concentration profile generated from the ADM2 for the conditions given, a slight gradient is observed. Removing the gradient would bring the fractional removal values sufficiently close together. The implication is that the appropriate boundary conditions for the ADM2 be ªclosedº for the case where the model is compared to the SCM with n ) 1 (i.e., no convective character at all). Despite the small offset, the results in Table 4 indicate that the two mathematical models are indeed equivalent and can be used interchangeably.
Conclusions
Solvent sublation is a nonfoaming adsorptive bubble process which is capable of removing trace levels of nonvolatile and volatile organic compounds from wastewaters. The advantage of solvent sublation over bubble fractionation or air stripping is that higher removal efficiencies are possible. Like liquid-liquid extraction, sublation utilizes a water-immiscible solvent for contaminant recovery; however, in sublation, mixers and phase separators are not needed. Moreover, the effluent water from a sublation column does not require further treatment to remove residual solvent.
In this paper, the transport mechanisms in solvent sublation were presented. In order of relative importance, the mechanisms are (i) transport by air bubbles, (ii) transport by bubble-wake entrainment, and (iii) transport by solvent-water mass transfer. These mechanisms were combined with mass balances derived from a continuous, countercurrent sublation process. Two equivalent, mathematical models resulted, namely, the series CSTR model (SCM) and two-phase axial dispersion model (ADM2). Based upon hydrodynamic models characterizing the bubbly flow regime in bubble columns, the SCM was used to elucidate the effects of operational, thermodynamic, and design variables on solvent sublation performance. It was found that these effects can be approximated in terms of correlations involving dimensionless numbers that describe the transport mechanisms.
For strongly hydrophobic compounds (Pw e 0.013), the steady-state fractional removal was easily determined from the air-water Stanton number, StwA, and the water-side entrainment number, Ew. Determining the separation factor required the oil-side entrainment number, Eo, the air-solvent capacity factor, PA, and the product QoKow (not dimensionless).